Note4Students
From UPSC perspective, the following things are important :
Prelims level: The 73rd and 74th Constitutional Amendments Acts
Mains level: Ensuring greater devolution of powers and responsibilities to lower tiers of panchayats
Central Idea:
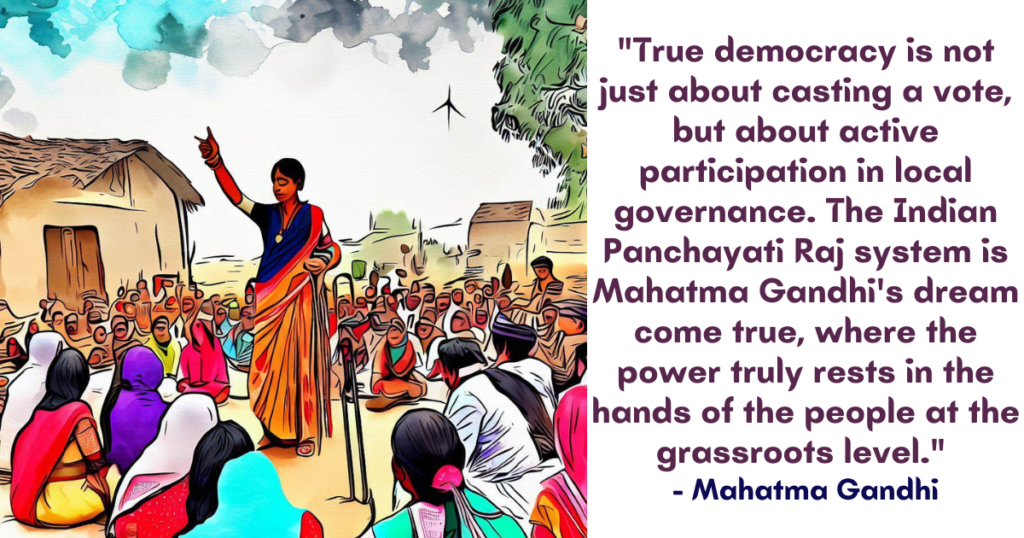
The article discusses the progress and challenges of decentralization in India, focusing on the effectiveness of Panchayati Raj institutions in local governance. It highlights the limited success in revenue generation by these institutions despite constitutional provisions and emphasizes the need for greater efforts towards self-sufficiency.
Key Highlights:
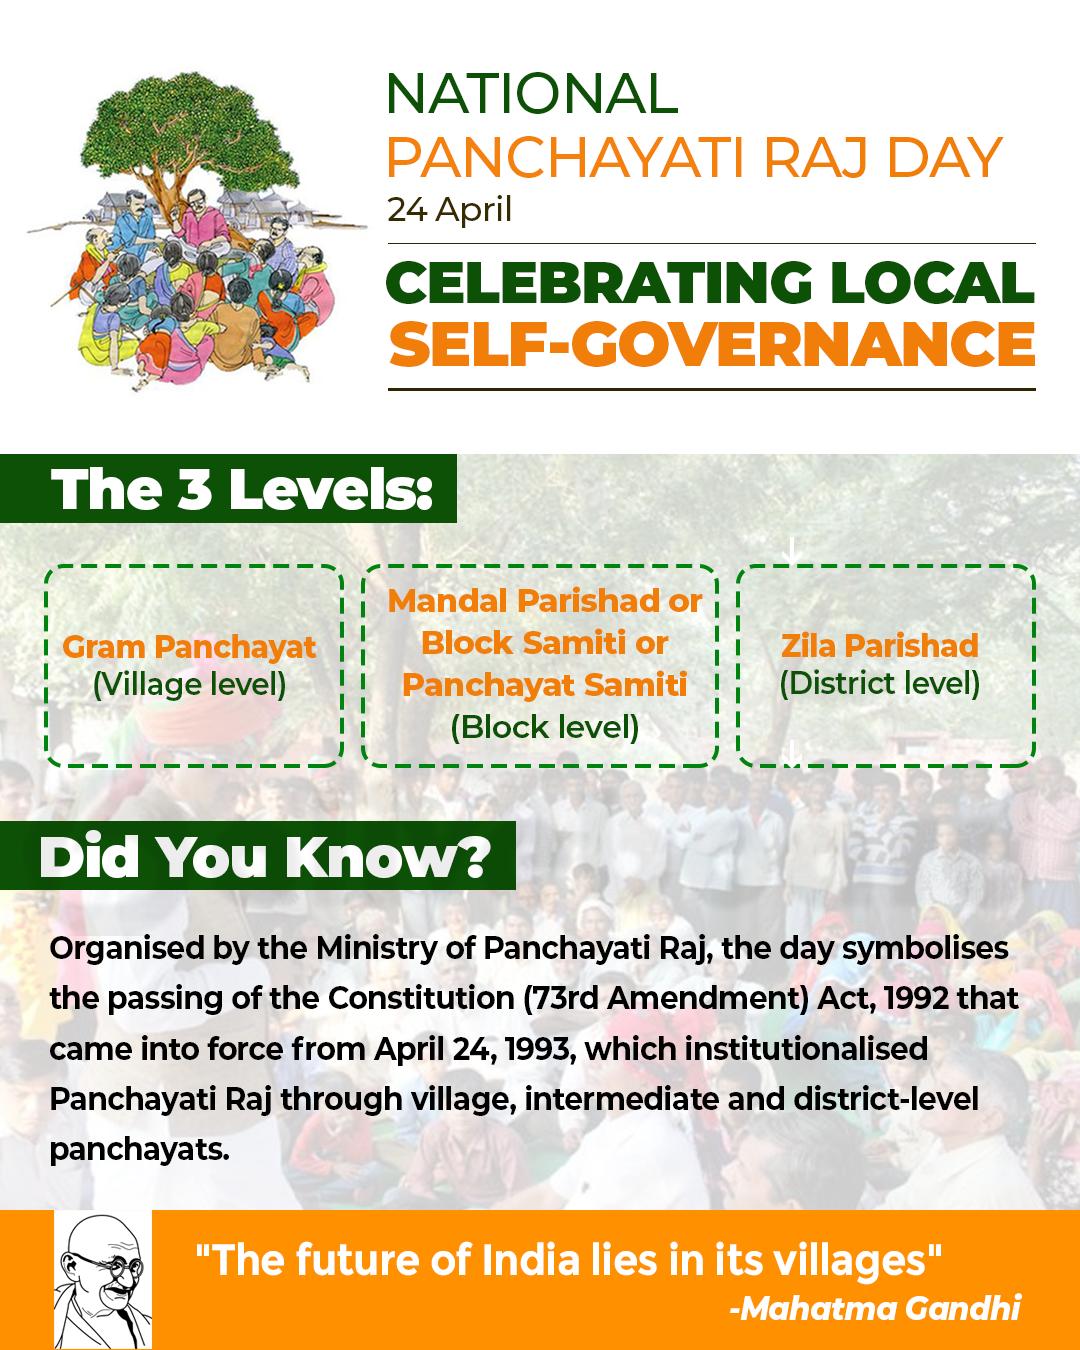
- Background of Decentralization: The 73rd and 74th Constitutional Amendments Acts aimed to empower local bodies for self-governance, leading to the establishment of the Ministry of Panchayati Raj in 2004.
- Fiscal Devolution: The constitutional amendment outlined fiscal devolution details, including own revenue generation by panchayats. However, most revenue still comes from grants, with only 1% generated through taxes.
- Avenues for Revenue: The article lists various avenues for revenue generation by panchayats, including property tax, user charges, and innovative projects like rural business hubs and renewable energy initiatives.
- Role of Gram Sabhas: Gram sabhas play a crucial role in local development and revenue generation by leveraging local resources, engaging in planning, and imposing taxes for community welfare.
- Challenges: Despite potential avenues for revenue, panchayats face challenges such as a culture of dependency on grants, reluctance to impose taxes, and lack of authority in tax collection.
- Dependency Syndrome: The article discusses the prevalent “freebie culture” and the reluctance of elected representatives to impose taxes due to concerns about popularity.
Key Challenges:
- Overreliance on grants from central and state governments.
- Reluctance of elected representatives to impose taxes due to concerns about popularity.
- Lack of authority and capacity in tax collection by panchayats.
- Prevailing “freebie culture” hindering public willingness to pay taxes.
Main Terms:
- Decentralization: Transfer of authority and responsibility from central to local government.
- Panchayati Raj: System of local self-government in rural areas.
- Fiscal Devolution: Transfer of financial powers from central to local governments.
- Own Source of Revenue (OSR): Revenue generated by local bodies through taxes, fees, and other means.
- Gram Sabha: Village assembly responsible for local governance and decision-making.
Important Phrases for answer writing:
- “Decentralization initiatives”
- “Revenue generation efforts”
- “Own source of revenue”
- “Freebie culture”
- “Dependency syndrome”
Quotes for answer quality improvement:
- “Panchayats earn only 1% of the revenue through taxes.”
- “Gram sabhas have a significant role in fostering self-sufficiency and sustainable development.”
- “The dependency syndrome for grants has to be minimized.”
Useful Statements that can be used for essay:
- “Despite efforts towards decentralization, many panchayats still rely heavily on grants for revenue.”
- “Gram sabhas can play a pivotal role in promoting entrepreneurship and local development.”
- “There is a need to educate elected representatives and the public on the significance of revenue generation for panchayat development.”
Examples and References:
- The 73rd and 74th Constitutional Amendments Acts.
- Ministry of Panchayati Raj’s expert committee report on own source of revenue.
- Data highlighting the percentage of revenue generated by panchayats through taxes.
- Examples of successful revenue generation initiatives by panchayats, such as property tax and user charges.
Facts and Data for critical arguments in answer:
- Panchayats earn only 1% of revenue through taxes, with 80% from the Centre and 15% from the States.
- Allocation for rural local bodies increased significantly in recent Finance Commissions, reaching ₹2,80,733 crore in the 15th Finance Commission.
- Tax revenue collected by panchayats decreased from ₹3,12,075 lakh in 2018-19 to ₹2,71,386 lakh in 2021-2022.
Critical Analysis:
While constitutional amendments and expert committee reports have outlined mechanisms for fiscal devolution and revenue generation, there remains a significant gap between policy intent and implementation. Factors such as political reluctance, administrative capacity constraints, and societal attitudes towards taxation pose significant challenges to effective decentralization.
Way Forward:
- Strengthening capacity building initiatives for panchayats in tax administration and financial management.
- Encouraging public awareness campaigns to promote the importance of local revenue generation for sustainable development.
- Ensuring greater devolution of powers and responsibilities to lower tiers of panchayats.
- Exploring innovative revenue generation avenues such as public-private partnerships and leveraging local resources for economic development.
Improve your answer writing with us and crack the mains
Try to attempt following question and write the answer in comment box below
- “What are the various sources available for Panchayats to generate revenue, and how can these sources contribute to enhancing the financial autonomy and sustainability of Panchayati Raj institutions?”
- “What are the main challenges hindering the financial autonomy of Panchayati Raj?”
- “Why is financial autonomy crucial for the effective functioning of local governance?”
Get an IAS/IPS ranker as your 1: 1 personal mentor for UPSC 2024
Attend Now
Note4Students
From UPSC perspective, the following things are important :
Prelims level: IT Rules 2021
Mains level: importance of upholding free speech in the digital age

Central Idea:
Justice Gautam Patel’s landmark decision on the Kunal Kamra’s case underscores the critical importance of upholding the constitutional right to free speech, particularly in the realm of social media. The decision highlights the inherent dangers of arbitrary censorship and the need for clear, reasonable restrictions in line with constitutional principles.
Key Highlights:
- Upholding Free Speech: The decision reaffirms the sacrosanct nature of the constitutional guarantee of free speech, emphasizing its protection against undue state encroachment.
- Rejection of Arbitrary Censorship: Justice Patel condemns the amended Rule 3(1)(b)(v) of the IT Rules 2021 as vague and overbroad, posing a threat to critical discourse and debate.
- Constitutional Principles: The judgment invokes Article 19 and Article 14 of the Constitution, arguing that the amended rule infringes upon fundamental rights and lacks reasonable standards.
- Importance of Judicial Review: The decision underscores the role of judicial review in curbing potential abuses of power by government entities, particularly in safeguarding democratic principles.
- Recognition of Digital Regulation: While acknowledging the need to combat misinformation, the judgment insists on the importance of balanced regulation that respects free speech rights.
Key Challenges:
- Interpretation of Constitutional Rights: Balancing free speech with the need for regulation presents a challenge in defining clear and reasonable restrictions.
- Enforcement and Compliance: Ensuring compliance with constitutional principles and judicial decisions poses challenges in a dynamic digital landscape.
- Government Response: The government’s response to judicial decisions and its commitment to upholding constitutional principles may vary, influencing the effectiveness of legal interventions.
Main Terms or key terms for answer writing:
- Free Speech
- Constitutional Guarantee
- Social Media Regulation
- Arbitrary Censorship
- Judicial Review
- Fundamental Rights
- Digital Platforms
- Misinformation
- Democratic Principles
Important Phrases for good marks in mains:
- “The sacrosanctity of the inviolate constitutional guarantee of free speech”
- “Vague and overbroad”
- “The imperative of combatting fakery and misinformation”
- “A bulwark against the excesses of majoritarian assemblies”
- “Agents of injustice”
- “Inter-institutional comity”
Quotes that you can use in essay for value addition:
- “The cacophony of dissent and disagreement is the symphony of a democracy at work.”
- “Falsehood flies, and truth comes limping after it.”
- “The will of the State is subject to scrutiny by those affected by the exercise of State power.”
- “Democratic power is a trust held upon conditions.”
Useful Statements for value addition:
- “The decision reaffirms the constitutional conscience and rejects the potential for wanton abuse of power.”
- “Fear-instilled stillness ill serves the case of a vibrant democracy.”
- “A law that permits its enforcers to become agents of injustice cannot be countenanced in a constitutional democracy.”
Examples and References:
Facts and Data for value addition and credibility to your arguments:
- Mention of the amended Rule 3(1)(b)(v) of the IT Rules 2021.
- Reference to Justice Patel’s decision on the Kunal Kamra’s case, dated 31st January.
Critical Analysis:
Justice Patel’s decision serves as a significant safeguard against potential abuses of power and underscores the importance of upholding free speech in the digital age. By rejecting arbitrary censorship and emphasizing the need for clear, reasonable restrictions, the judgment sets a crucial precedent for protecting democratic principles.
Way Forward:
- Ensure compliance with constitutional principles in regulating digital platforms.
- Encourage balanced regulation that combats misinformation while respecting free speech rights.
- Foster inter-institutional comity by heeding judicial decisions and promoting democratic accountability.
By adhering to these principles, policymakers can navigate the complexities of digital regulation while upholding fundamental rights and democratic values.
Improve your answer writing with us and crack the mains
Try to attempt following question and write the answer in comment box below
- How does Justice Patel’s decision in the Kunal Kamra’s case uphold the constitutional right to free speech?
- What are the key challenges in balancing free speech with the need for regulation, as highlighted in the judgment?
- How does the judgment emphasize the importance of judicial review in safeguarding democratic principles in the digital age?
Get an IAS/IPS ranker as your 1: 1 personal mentor for UPSC 2024
Attend Now
Note4Students
From UPSC perspective, the following things are important :
Prelims level: Geographical locations of dams
Mains level: Interstate water disputes
Central Idea:
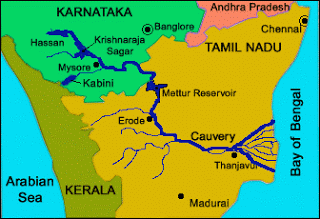
The article recounts the historical background and negotiations leading to the Agreement between the states of Mysore and Madras regarding the construction and regulation of dams on the Cauvery River. It highlights the challenges faced, key terms agreed upon, and the significance of the agreement in resolving disputes and laying down principles for water management in the region.
Key Highlights:
- M. Visvesvaraya’s proposal for the Krishnarajasagara (KRS) reservoir in 1910.
- Arbitration led by Sir H.D. Griffin resulting in the approval of the KRS dam project.
- Friction between Madras and Mysore over the execution of the dam’s next phase.
- Negotiations and arbitration processes spanning several years.
- Drafting of rules for the regulation of KRS and other reservoirs.
- The signing of the Agreement, facilitating the construction of KRS and Mettur dams.
- Consent for irrigation projects and assurance of water supplies to Madras.
- Perception of the agreement as a fair settlement by Mysore’s Dewan, A.R. Banerji.
Key Challenges:
- Disputes over water rights and dam construction between upper and lower riparian states.
- Lengthy negotiations and arbitration processes due to differing interests and concerns.
- Balancing the need for irrigation expansion with the preservation of water resources.
- Ensuring equitable distribution of water while addressing the concerns of both states.
Main Terms:
- Construction of KRS and Mettur dams.
- Limitation on new irrigation areas under the Mettur project.
- Formulation of rules for the regulation of reservoirs.
- Assurance of water supplies to Madras.
- Review of certain stipulations after 50 years.
Important Phrases:
- “Kannambadi Arbitration Case”
- “Prescriptive right of Madras”
- “Broader settlement”
- “Give and take”
- “British hand”
Quotes:
- “A fair and honourable settlement.” – A.R. Banerji, Mysore Dewan.
- “The spirit of ‘give and take’ reigned throughout.” – A.R. Banerji.
- “No British hand behind the settlement.” – A.R. Banerji.
Anecdotes:
- Sir H.D. Griffin’s swift arbitration process.
- Negotiations between Mysore and Madras officials.
- A.R. Banerji’s statement in The Hindu.
Useful Statements:
- “The pact allowed a review of certain stipulations of the agreement after 50 years.”
- “The agreement was perceived as a fair settlement by both parties involved.”
- “Balancing irrigation expansion with water resource preservation was a key challenge.”
Examples and References:
- Construction of the KRS and Mettur dams.
- Negotiation processes between Madras and Mysore officials.
- A.R. Banerji’s statement published in The Hindu.
Facts and Data:
- Construction of KRS with a capacity of 44.83 TMC.
- Limitation of new irrigation areas under the Mettur project to 3.01 lakh acres.
- Review of certain stipulations after 50 years.
Critical Analysis:
The Agreement marked a significant milestone in resolving the Cauvery River dispute between Mysore and Madras. Despite initial challenges and differing interests, the agreement laid down principles for water management and established a framework for future cooperation. While perceptions may vary, A.R. Banerji’s statement underscores the agreement’s perceived fairness and the spirit of cooperation between the two states.
Way Forward:
The Agreement serves as a historical precedent for resolving interstate water disputes through negotiation and compromise. Moving forward, stakeholders should build upon this foundation to address evolving water management challenges, ensuring equitable distribution and sustainable use of water resources in the region. Cooperation and dialogue remain essential for fostering lasting solutions to water-related conflicts.
Get an IAS/IPS ranker as your 1: 1 personal mentor for UPSC 2024
Attend Now
Note4Students
From UPSC perspective, the following things are important :
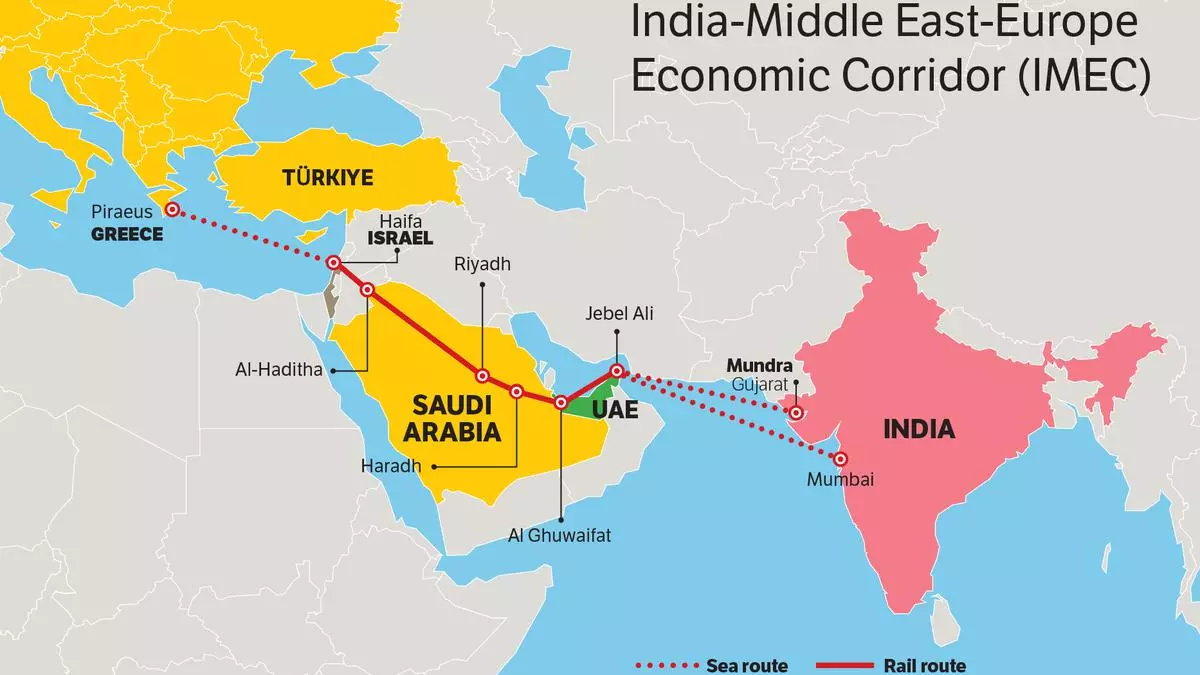
Prelims level: India-Middle East-Europe Economic Corridor (IMEEC)
Mains level: deeper collaboration between Greece and India

Central Idea:
The article discusses the growing strategic relationship between Greece and India, emphasizing the importance of deepening bilateral ties across various sectors. It highlights the mutual benefits of collaboration, the significance of security and stability in their respective regions, and the potential for economic cooperation through initiatives like the India-Middle East-Europe Economic Corridor (IMEEC).
Key Highlights:
- The visit of Greek Prime Minister Kyriakos Mitsotakis to India signifies the momentum in strengthening bilateral relations initiated by Indian Prime Minister Narendra Modi’s visit to Greece.
- Both countries recognize the strategic importance of their geographical locations and the need for cooperation to ensure security, stability, and prosperity.
- Collaboration extends across strategic, military, and business sectors, with examples such as joint military exercises and investment partnerships.
- Economic reforms in Greece under the Mitsotakis government aim to boost sustainable growth and position the country as a reliable partner in the Eastern Mediterranean.
- The concept of the India-Middle East-Europe Economic Corridor (IMEEC) emerges as a promising avenue for enhancing economic ties between India and Greece.
- Emphasis is placed on fostering people-to-people ties through cultural exchanges, education programs, and media cooperation.
Key Challenges:
- The pace of bilateral cooperation has been slow, indicating a need for greater momentum.
- Despite existing collaborations, there is room for further expansion and diversification of partnerships.
- Ensuring sustained commitment from both governments and businesses to deepen ties amidst global uncertainties.
Main Terms:
- Strategic relationship
- Geopolitical volatility
- Bilateral cooperation
- Economic reforms
- India-Middle East-Europe Economic Corridor (IMEEC)
- People-to-people ties
Important Phrases:
- “No better gateway to Europe than Greece”
- “Prisoners of geography”
- “Constructing the India-Middle East-Europe Economic Corridor (IMEEC)”
- “Critical year in the building of the Greece-India strategic partnership”
Quotes:
- “India will find no better gateway to Europe than my country and for Greece there is no better gateway to Asia than a close strategic relationship with India.”
- “Greece is still by far the best European country to invest in.”
- “The fact that the political leaders of Greece and India are exchanging visits within a short time frame shows not just their determination to move the relationship forward but also the urgency they attach to this task.”
Useful Statements:
- Collaboration between Greece and India is essential for ensuring security, stability, and prosperity in their respective regions.
- Economic reforms in Greece aim to position the country as a reliable partner in the Eastern Mediterranean.
- Initiatives like the India-Middle East-Europe Economic Corridor (IMEEC) offer significant potential for enhancing bilateral economic ties.
Examples and References:
- Joint military exercises between the Indian Navy and Greek armed forces.
- Investment partnerships between Indian and Greek businesses, such as the construction of a new airport on the island of Crete.
- The involvement of Indian-Canadian billionaire Prem Watsa in Greek investments, advocating for Greek-Indian business cooperation.
Facts and Data:
- Historic visit of Indian Prime Minister Narendra Modi to Greece in August 2023.
- Collaboration between Indian and Greek businesses in various sectors, including construction, shipping, and finance.
Critical Analysis:
- The article underscores the significance of deeper collaboration between Greece and India in light of geopolitical challenges and economic opportunities.
- It highlights the need for accelerated efforts to overcome historical inertia and realize the full potential of the bilateral relationship.
- Emphasis on people-to-people ties reflects a holistic approach to strengthening cultural and educational exchanges alongside economic and strategic cooperation.
Way Forward:
- Both governments should prioritize the implementation of existing agreements and explore new avenues for cooperation.
- Continued engagement between businesses from both countries is crucial for diversifying and expanding partnerships.
- Investing in educational and cultural exchanges can foster mutual understanding and long-term cooperation.
- Regular high-level visits and dialogue mechanisms should be maintained to sustain momentum and address emerging challenges.
Get an IAS/IPS ranker as your 1: 1 personal mentor for UPSC 2024
Attend Now
Note4Students
From UPSC perspective, the following things are important :
Prelims level: Na
Mains level: mismatch between engineering graduates' skills and service sector demands

Central Idea:
- Article discusses the growing significance of the services sector in India’s economy and the demand for skilled manpower. Proposes the introduction of a generic “service engineering” course to address the need for professionals adept at navigating modern service-oriented industries.
Key Highlights:
- Services sector contributes significantly to India’s Gross Value Added and employment.
- Engineering graduates increasingly employed in non-technical roles within the services sector due to adaptable skills.
- Lack of generic courses tailored to service sector needs, leading engineers to fill entry-level service jobs.
- Proposal for “service engineering” course blending technical proficiency, soft skills, and industry-specific knowledge.
- Integration of AI and IoT to enhance employability.
- Emphasis on diverse curriculum covering service delivery fundamentals, process improvement, and client management.
Key Challenges:
- Resistance from traditional education systems and institutions.
- Development and implementation of comprehensive curriculum.
- Ensuring affordability and accessibility, especially in tier 2 and 3 cities.
- Overcoming societal biases and stereotypes about career paths.
- Adapting to rapid technological advancements and industry changes.
Main Terms:
- Services sector
- Engineering graduates
- Service-oriented roles
- Soft skills
- Technical proficiency
- Service management principles
- Process improvement methodologies
- Client management
Important Phrases for answer writing:
- “Service engineering”
- “White-collar service environments”
- “Dynamic service landscape”
- “Process reengineering”
- “Critical thinking frameworks”
- “Virtual learning environments”
- “Inclusivity in education”
- “Services-driven economy”
Quotes:
- “Engineers are increasingly finding employment not solely based on a precise match of skills but due to the adaptability and problem-solving mindset ingrained in their education.”
- “Just as an engineering education equips the student with the basic skills to find a vocation in an industrial setup, we need an equivalent services skill education.”
- “The introduction of such a course — let us call it ‘service engineering’ — holds transformative potential, offering a pathway to enhanced employability, improved service delivery, and sustained economic growth.”
Anecdotes:
- Example of engineering graduates transitioning into non-technical roles within the services sector, such as banking, insurance, and retail.
- Mention of the increasing participation of women in the workforce and how a service engineering course could support their work-life balance.
Useful Statements:
- “The rising prominence of the services sector has opened avenues for engineers to be gainfully employed in white-collar jobs.”
- “Such a course can offer a holistic blend of technical proficiency, soft skills, and industry-specific knowledge essential for success in service-centric roles.”
Examples and References:
- Data on employability of engineering graduates.
- Commissioned report on engineering seat enrollment.
- Periodic Labour Force Survey (PLFS) data on women’s participation in the workforce.
Critical Analysis:
- The article effectively highlights the mismatch between engineering graduates’ skills and service sector demands, proposing a “service engineering” course as a solution. However, it lacks in-depth analysis of challenges and implementation strategies, especially regarding soft skills integration.
Way Forward:
- Collaborate with industry experts for curriculum design.
- Offer scholarships for affordability and accessibility.
- Conduct awareness campaigns to challenge biases.
- Establish partnerships for practical training.
- Continuously update the curriculum to match industry changes.
Get an IAS/IPS ranker as your 1: 1 personal mentor for UPSC 2024
Attend Now

Central Idea:
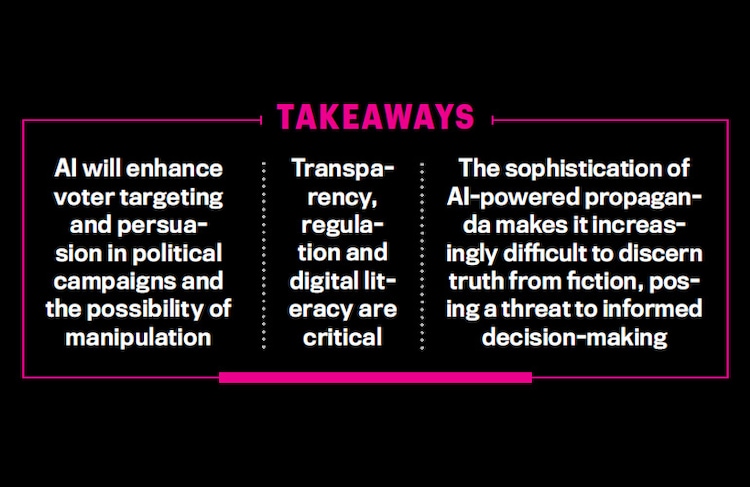
The year 2024 is marked by a significant global exercise in democracy, with concerns arising over the impact of AI on elections. However, while efforts to regulate AI and address disinformation are underway, there are potential unintended consequences that may exacerbate existing challenges and concentrate power within the AI industry.
Key Highlights:
- Increased global engagement in elections in 2024 prompts worries about AI-driven disinformation.
- Governments rush to regulate AI to combat disinformation, but unintended consequences may worsen existing issues.
- Concentration of power within the AI industry may occur due to regulatory requirements, hindering competition and innovation.
- Ethical and transparency guidelines for AI development face challenges due to differing values and priorities.
- Democracy faces numerous challenges beyond AI, including political repression, violence, and electoral fraud.
Key Challenges:
- Balancing the need to regulate AI with potential unintended consequences that may worsen existing problems.
- Addressing power concentration within the AI industry without stifling innovation and competition.
- Establishing ethical guidelines for AI development amidst diverse societal values and priorities.
- Ensuring meaningful transparency in AI systems through effective auditing mechanisms.
- Anticipating future risks of AI in electoral processes and formulating proactive regulations.
Main Terms:
- AI (Artificial Intelligence)
- Disinformation
- Deepfakes
- Regulation
- Concentration of power
- Ethical guidelines
- Transparency
- Electoral risks
Important Phrases:
- “Ultimate election year”
- “Digital voter manipulation”
- “AI bogeyman”
- “Content moderation”
- “Watermarking”
- “Red-teaming exercises”
- “Existential risks”
- “Complex adaptive system”
- “Toothless regulations”
Quotes:
- “Democracy has many demons to battle even before we get to the AI demon.”
- “AI-sorcery may, on the margin, not rank among the biggest mischief-makers this year.”
- “It is better that these well-intended regulators understand the unintended consequences of rushed regulations.”
- “Voters in elections beyond 2024 will be grateful for such foresight.”
Useful Statements:
- Rushed regulations to combat AI-related electoral risks may exacerbate existing challenges.
- Power concentration within the AI industry could hinder innovation and ethical oversight.
- Ethical guidelines for AI development must consider diverse societal values and priorities.
- Effective auditing mechanisms are crucial for ensuring transparency in AI systems.
- Proactive regulations are needed to anticipate and mitigate future risks of AI in electoral processes.
Examples and References:
- Manipulated videos affecting political leaders’ images in Bangladesh and elsewhere.
- Concentration of AI investments and influence in a few major companies.
- Challenges faced by New York’s law requiring audits of automated employment decision tools.
- Voluntary transparency mechanisms offered by companies like IBM and OpenAI.
Facts and Data:
- Close to half of the world’s population engaging in elections in 2024.
- Three companies received two-thirds of all investments in generative AI in the previous year.
- New York’s law on auditing automated employment decision tools found to be ineffective.
- Over 83 elections taking place worldwide in 2024.
Critical Analysis:
Efforts to regulate AI in electoral processes must strike a delicate balance between addressing immediate risks and avoiding unintended consequences that may worsen existing challenges. Power concentration within the AI industry poses significant ethical and competitive concerns, while diverse societal values complicate the establishment of universal ethical guidelines. Ensuring transparency in AI systems requires robust auditing mechanisms and proactive regulatory measures to anticipate future risks.
Way Forward:
- Proceed cautiously with AI regulations to avoid exacerbating existing challenges.
- Foster competition and innovation within the AI industry while addressing concerns about power concentration.
- Engage diverse stakeholders to establish ethical guidelines that reflect societal values and priorities.
- Implement effective auditing mechanisms to ensure transparency in AI systems.
- Anticipate future risks of AI in electoral processes and formulate proactive regulations to mitigate them.
Get an IAS/IPS ranker as your 1: 1 personal mentor for UPSC 2024
Attend Now
Note4Students
From UPSC perspective, the following things are important :
Prelims level: Opaque nature of AI algorithms
Mains level: challenges posed by AI

Central Idea:
The concept of meritocracy, once heralded as a fair system for rewarding individuals based on their abilities and efforts, is facing significant challenges in the era of Artificial Intelligence (AI). While proponents argue for its intuitive fairness and potential for reform, critics point out its divisive consequences and perpetuation of inequalities. The introduction of AI complicates the notion of meritocracy by questioning traditional metrics of merit, exacerbating biases, and polarizing the workforce. Recalibrating meritocracy in the age of AI requires a nuanced understanding of its impact on societal structures and a deliberate rethinking of how merit is defined and rewarded.
Key Highlights:
- The critiques of meritocracy by thinkers like Michael Young, Michael Sandel, and Adrian Wooldridge.
- The evolution of meritocracy from a force for progress to a system perpetuating new inequalities.
- The disruptive impact of AI on meritocracy, challenging traditional notions of merit, exacerbating biases, and polarizing the workforce.
- The opaque nature of AI algorithms and the concentration of power in tech giants posing challenges to accountability.
- The potential for AI to set standards for merit in the digital age, sidelining smaller players and deepening existing inequalities.
Key Challenges:
- Reconciling the intuitive fairness of meritocracy with its divisive consequences and perpetuation of inequalities.
- Addressing the disruptive impact of AI on traditional notions of merit and societal structures.
- Ensuring transparency and accountability in AI algorithms to uphold the meritocratic ideal.
- Mitigating the potential for AI to deepen existing socioeconomic disparities and sideline smaller players.
Main Terms:
- Meritocracy: A system where individuals are rewarded and advance based on their abilities, achievements, and hard work.
- Artificial Intelligence (AI): Non-human entities capable of performing tasks, making decisions, and creating at levels that can surpass human abilities.
- Social Stratification: The division of society into hierarchical layers based on social status, wealth, or power.
- Biases: Systematic errors in judgment or decision-making due to factors such as stereotypes or prejudices.
- Tech Giants: Large technology companies with significant influence and control over digital platforms and data.
Important Phrases:
- “Dystopian meritocratic world”
- “Divisive consequences”
- “Fluidity and contingency of merit”
- “Hereditary meritocracy”
- “Opaque nature of AI algorithms”
- “Data hegemony”
Quotes:
- “Meritocracy fosters a sense of entitlement among the successful and resentment among those left behind.” – Michael Sandel
- “Meritocratic systems are inherently subjective and can reinforce existing inequalities.” – Post-structuralists
Useful Statements:
- “The introduction of AI complicates the notion of meritocracy by questioning traditional metrics of merit and exacerbating biases.”
- “Recalibrating meritocracy in the age of AI requires a nuanced understanding of its impact on societal structures and a deliberate rethinking of how merit is defined and rewarded.”
Examples and References:
- Michael Young’s satirical book “The Rise of the Meritocracy” (1958)
- AI tool predicting pancreatic cancer three years before radiologists can diagnose it
- The concentration of power in tech giants like Google, Facebook, and Amazon
Facts and Data:
- A recent paper published in Nature Medicine showed an AI tool predicting pancreatic cancer in a patient three years before radiologists can make the diagnosis.
Critical Analysis:
- The article provides a balanced view of the merits and critiques of meritocracy, incorporating insights from various thinkers and addressing the challenges posed by AI.
- It highlights the potential for AI to exacerbate existing inequalities and challenges the traditional notion of meritocracy.
- The critique of meritocracy from multiple perspectives enriches the analysis and provides a comprehensive understanding of its complexities.
Way Forward:
- Recalibrating meritocracy in the age of AI requires transparency, accountability, and a reevaluation of how merit is defined and rewarded.
- Efforts should be made to mitigate the biases inherent in AI algorithms and ensure equitable access to technology.
- Policies promoting access to education and training, particularly in high-skill fields, can help address the polarization of the workforce and reduce socioeconomic disparities.
Get an IAS/IPS ranker as your 1: 1 personal mentor for UPSC 2024
Attend Now
Note4Students
From UPSC perspective, the following things are important :
Prelims level: Teacher Eligibility Test (TET)
Mains level: discrepancy between qualifications and the requirements of primary education
Central Idea:
The central idea of the article revolves around the recent Supreme Court ruling in India, which upheld the necessity of specialized qualifications for primary school teaching, emphasizing the significance of Diploma in Education (DEd), Diploma in Elementary Education (DElEd), or Bachelor of Elementary Education (BElEd) degrees over Bachelor of Education (B.Ed). The article highlights the implications of this decision on recruitment policies and the quality of primary education in the country.
Key Highlights:
- Different Requirements for Primary Teaching: Teaching young children in primary grades requires specialized skills in foundational literacy and numeracy, which cannot be adequately addressed by the B.Ed degree, designed for teaching older students. The Right to Education Act underscores the importance of appropriate qualifications for primary school teachers.
- Discrepancies in Qualifications: Despite regulations, there are discrepancies in the qualifications of primary school teachers, with a significant portion holding B.Ed degrees instead of the required DEd, DElEd, or BElEd qualifications.
- Challenges in Quality: The quality of teacher education programs varies, with government-funded institutions generally performing better than self-financed ones. Concerns exist regarding low mean scores, especially in mathematics, indicating a need for improvement in pedagogical content knowledge.
- Government Support and Innovation: There is a call for government support and innovation in primary teacher education, including the expansion of successful programs like BElEd and the Integrated Teacher Education Programme (ITEP).
Key Challenges:
- Discrepancies in Qualifications: The prevalence of B.Ed holders in primary teaching roles highlights the challenge of aligning qualifications with the specific requirements of primary education.
- Quality Disparities: Disparities in the quality of teacher education programs, particularly between government-funded and self-financed institutions, pose a challenge to ensuring consistently high standards of teacher preparation.
- Limited Government Focus: The article criticizes the government’s focus on higher education faculty development rather than primary teacher preparation, potentially neglecting the crucial foundation of education.
Main Terms:
- Bachelor of Education (B.Ed)
- Diploma in Education (DEd)
- Diploma in Elementary Education (DElEd)
- Bachelor of Elementary Education (BElEd)
- Right to Education Act
- Teacher Eligibility Test (TET)
- District Institutes of Education and Training (DIETs)
- Integrated Teacher Education Programme (ITEP)
Important Phrases:
- Foundational Literacy and Numeracy (FLN)
- Teacher Eligibility Test (TET)
- District Institutes of Education and Training (DIETs)
- Integrated Teacher Education Programme (ITEP)
- Pandit Madan Mohan Malaviya National Mission on Teachers & Teaching
Quotes:
- “Teaching these competencies has to be learnt by prospective primary schoolteachers, through specialized teacher education for this stage.”
- “Almost all of us have forgotten how we learned to read or manipulate the number system.”
- “Better students seem to prefer government-funded institutions.”
- “The decision to become a teacher can also occur at different stages.”
Examples and References:
- The State of Teachers, Teaching and Teacher Education Report.
- Analysis of Teachers Eligibility Test (TET) data from a particular state.
- The success of programs like BElEd offered by Delhi University.
- The announcement of the Integrated Teacher Education Programme (ITEP) and the Scheme of Pandit Madan Mohan Malaviya National Mission on Teachers & Teaching.
Facts and Data:
- 90% of teachers have some form of professional qualification.
- Only 46% of teachers teaching primary grades have the DElEd (or equivalent) qualification.
- 22% of primary school teachers in private schools have B.Ed degrees.
- 4% of students enrolled in DElEd already have a B.Ed.
- Only 14% of qualifying candidates in TET had a mean score of 60% or above.
Critical Analysis:
The article effectively critiques the discrepancy between qualifications and the requirements of primary education, highlighting the need for specialized training in foundational literacy and numeracy. It addresses disparities in teacher education quality and government focus, advocating for greater attention to primary teacher preparation. However, it could delve further into the socio-economic factors influencing qualification choices and explore potential solutions in more detail.
Way Forward:
- Strengthening government support for primary teacher education programs.
- Expanding successful models like BElEd and ITEP.
- Addressing quality disparities between institutions.
- Implementing section-wise qualifying cut-off marks in TET.
- Providing pathways for professional development for B.Ed holders aiming for primary teaching roles.
Get an IAS/IPS ranker as your 1: 1 personal mentor for UPSC 2024
Attend Now
Note4Students
From UPSC perspective, the following things are important :
Prelims level: National Food Security Act (NFSA)
Mains level: demands of farmers for a legal guarantee for MSP
Central Idea:
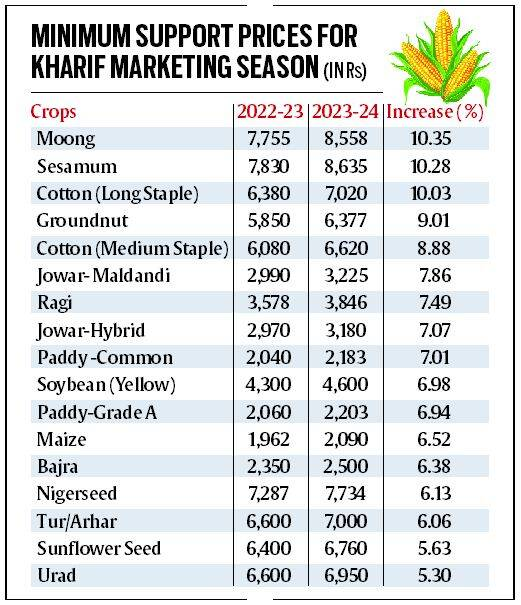
Farmers in India are demanding a legal guarantee for Minimum Support Prices (MSP) to stabilize agricultural commodity prices and ensure their livelihoods. Despite the longstanding demand and political consensus, successive governments have been hesitant to implement this, primarily due to concerns about fiscal costs. However, the actual costs and benefits of such a guarantee are often misunderstood, leading to fear mongering and misconceptions about its implications.
Key Highlights:
- Farmers’ demands for a legal guarantee for MSP stem from the need for stability in agricultural commodity prices to protect their incomes.
- MSP is a mechanism to ensure price stability for essential agricultural commodities, but its implementation is limited, mainly focusing on rice and wheat.
- Misconceptions about the fiscal costs of MSP guarantee have hindered its implementation, despite political consensus and support from various parties and unions.
- The cost of procuring agricultural produce is often misconstrued, with the majority being a subsidy to consumers rather than to farmers.
- A guaranteed MSP offers an opportunity to rectify imbalances in the MSP and procurement system, promoting regional diversification and crop expansion.
- Neglect of the agrarian economy has led to declining real incomes and wages for farmers, highlighting the urgency of reforming the MSP system.
Key Challenges:
- Misunderstanding and fear mongering about the fiscal costs and implications of implementing a legal guarantee for MSP.
- Limited implementation of MSP, primarily focusing on rice and wheat, leaving other crops and regions underserved.
- Neglect of the agrarian economy leading to declining real incomes and wages for farmers.
- Political hesitancy to implement MSP guarantee despite consensus and support from various stakeholders.
- Lack of comprehensive understanding of the benefits of MSP guarantee in stabilizing agricultural commodity prices and reviving the rural economy.
Main Terms:
- Minimum Support Prices (MSP)
- National Food Security Act (NFSA)
- Price Stability
- Market Intervention
- Agricultural Commodity Prices
- Fiscal Costs
- Marketable Surplus
- Procurement System
- Agrarian Economy
- Regional Diversification
Important Phrases:
- Legal guarantee for MSP
- Fear mongering and misconceptions
- Fiscal requirements
- Price volatility
- Market intervention
- Income protection
- Regional imbalances
- Declining real incomes
- Rural economy revival
- Comprehensive reform
Quotes:
- “A guaranteed MSP may not solve the farmers’ problems. But it offers a good opportunity to rectify the imbalances in the MSP and procurement system.”
- “Protecting the income of farmers will help revive the rural economy at a time when it’s struggling with deficient demand and rising inflation.”
- “Misconceptions about the fiscal costs of MSP guarantee have hindered its implementation, despite political consensus and support from various parties and unions.”
Anecdotes:
- The article references the fear mongering and misconceptions similar to those observed during the enactment of the National Food Security Act and the National Rural Employment Guarantee Act.
- It highlights the success of MSP implementation for rice and wheat during the last two years, where market prices were higher than MSP.
Useful Statements:
- “Despite political consensus, successive governments have dithered on legalizing this mechanism, primarily due to the fear of excessive fiscal requirements.”
- “A guaranteed MSP offers an opportunity to rectify the imbalances in the MSP and procurement system, promoting regional diversification and crop expansion.”
- “Protecting the income of farmers will help revive the rural economy, particularly during times of deficient demand and rising inflation.”
Examples and References:
- Reference to the successful implementation of MSP for rice and wheat during the last two years, despite market prices being higher than MSP.
- Comparison with other countries where similar mechanisms exist to stabilize agricultural commodity prices.
- Mention of the fear mongering and misconceptions observed during the enactment of previous agricultural legislations like the National Food Security Act.
Facts and Data:
- Government procurement of wheat in 2022 was only 19 million tonnes against a target of 44 million tonnes.
- In 2023, government procurement of rice and wheat was 26 million tonnes against a target of 35 million tonnes.
- Reference to the cost of procuring agricultural produce being misconstrued, with the majority being a subsidy to consumers rather than to farmers.
Critical Analysis:
The article provides a comprehensive analysis of the demands of farmers for a legal guarantee for MSP, highlighting the misconceptions and challenges surrounding its implementation. It emphasizes the importance of rectifying imbalances in the MSP and procurement system to promote regional diversification and crop expansion. However, it could further delve into the specific policy measures needed to address these challenges and provide a more detailed analysis of the potential benefits of implementing a guaranteed MSP.
Way Forward:
- Implementing a legal guarantee for MSP to ensure stability in agricultural commodity prices and protect farmers’ incomes.
- Rectifying imbalances in the MSP and procurement system to promote regional diversification and crop expansion.
- Addressing misconceptions and fear mongering surrounding the fiscal costs and implications of MSP guarantee through public awareness campaigns and comprehensive policy discussions.
- Engaging with stakeholders, including farmers’ unions, political parties, and policymakers, to formulate and implement effective MSP policies that address the needs and concerns of all parties involved.
- Investing in rural infrastructure, storage facilities, and crop diversification programs to strengthen the agrarian economy and revitalize rural communities.
Get an IAS/IPS ranker as your 1: 1 personal mentor for UPSC 2024
Attend Now
Note4Students
From UPSC perspective, the following things are important :
Prelims level: interim budget session of Parliament
Mains level: gap between government rhetoric and ground realities, emphasizing the human impact of policy failures

Central Idea:
The article critiques the recent interim budget session of Parliament, highlighting the discrepancy between the government’s rhetoric and the lived realities of everyday Indians. Through the stories of Rekha, Kavita, and Mohan, it exposes the failure of government schemes like Ayushman Bharat, food subsidies, and employment initiatives to address the fundamental issues facing citizens.
Key Highlights:
- The government’s self-aggrandizing adjectives during the budget session are criticized for being unsubstantiated by facts.
- The article delves into the lives of ordinary Indians to reveal the truth behind government data.
- Through scenarios, it demonstrates how government schemes often fail to provide adequate healthcare, nutrition, and employment opportunities.
- The suspension of a senior professor behind a damning health report raises questions about intellectual honesty regarding data.
- The Global Hunger Index ranking and reports from international organizations highlight India’s challenges in food security.
- Unemployment rates and the plight of educated youth like Mohan illustrate the failures in job creation and protection.
Key Challenges:
- Inadequate investment in healthcare, leading to poor quality and inaccessible services for millions.
- Subsidized food options lack nutritional value, exacerbating hunger and malnutrition.
- Job scarcity and lack of protection for workers, pushing individuals to precarious employment or even dangerous situations abroad.
- Discrepancies between government claims and ground realities, highlighting issues of transparency and accountability.
Main Terms:
- Ayushman Bharat scheme
- NFHS (National Family Health Survey)
- Global Hunger Index
- Gig economy
- Unemployment rate
- Food subsidies
Important Phrases:
- “Data stored with government hospitals under the Ayushman Bharat scheme is riddled with errors.”
- “The suspension of the IIPS Director shortly after the release of the NFHS report.”
- “India ranked out of countries in the Global Hunger Index.”
- “Mohan finds himself among the percent of graduates under years of age who are unemployed.”
- “A packet of rice costs more while dal costs more than before.”
Quotes:
- “The voices of Kavita, Rekha, and Mohan did not find a place in the Prime Minister’s marathon monologue in Parliament.”
- “Every youth believes that they can cement their job position with hard work and skills.”
- “Reality gets worse for Indian women like Rekha.”
- “Three out of four Indians cannot afford a healthy diet.”
Anecdotes:
- Rekha’s struggle to access healthcare at a government hospital.
- Kavita’s dilemma between subsidized but low-nutrient food and higher quality groceries.
- Mohan’s choice between unemployment at home or precarious work abroad.
Useful Statements:
- “The numbers either misidentify the dead, incorrectly record surgery details or entirely leave out beneficiaries from the list.”
- “Half the country does not turn to government facilities in their time of need.”
- “A job in a war zone is his only option.”
- “Mohan has not found employment for months.”
Examples and References:
- Global Hunger Index ranking (India ranked out of countries).
- NFHS data highlighting issues in healthcare access.
- Mohan’s situation exemplifying unemployment among educated youth.
Facts and Data:
- India invests only percent of GDP in healthcare.
- Three out of four Indians cannot afford a healthy diet.
- percent of graduates under years of age are unemployed.
- A packet of rice costs more, while dal costs more than before.
Critical Analysis:
The article effectively exposes the gap between government rhetoric and ground realities, emphasizing the human impact of policy failures. By presenting concrete examples and data, it challenges the narrative of progress touted by the government. The suspension of the IIPS Director adds weight to concerns about data integrity and transparency. However, the article could benefit from more analysis on systemic issues contributing to these failures, such as corruption and inadequate social welfare policies.
Way Forward:
- Increase investment in healthcare to improve accessibility and quality of services.
- Reform food subsidy programs to ensure nutritious options for all citizens.
- Create more employment opportunities through targeted policies and investments in key sectors.
- Enhance transparency and accountability in data collection and reporting to address systemic issues.
- Prioritize the voices and needs of ordinary citizens in policymaking process
Get an IAS/IPS ranker as your 1: 1 personal mentor for UPSC 2024
Attend Now
Note4Students
From UPSC perspective, the following things are important :
Prelims level: na
Mains level: The electoral bonds scheme
Central Idea:
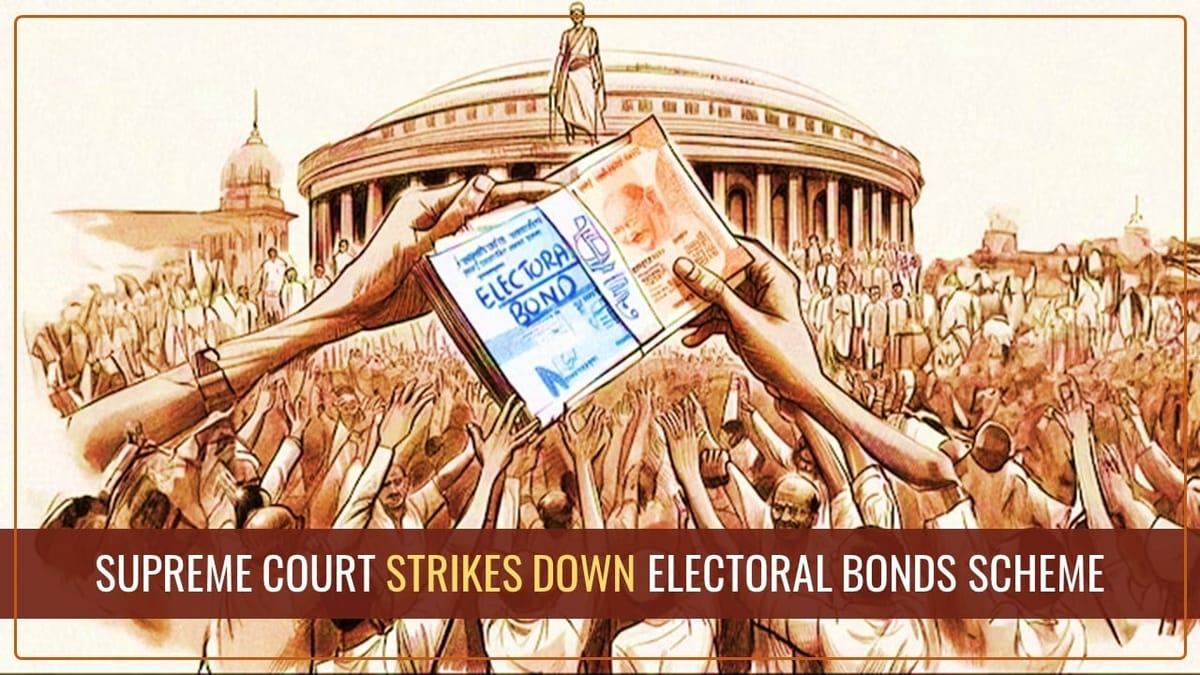
The Supreme Court’s recent decision to strike down India’s electoral bonds scheme marks a significant victory for transparency in democracy. The judgment highlights the importance of ensuring that political funding is transparent and accountable to the public.
Key Highlights:
- The Supreme Court’s ruling on February 15, 2024, declared the electoral bonds scheme unconstitutional due to its lack of transparency.
- The scheme allowed undisclosed corporate funding of political parties, removing previous limits and potentially enabling influence peddling.
- Amendments to the Reserve Bank of India Act and other laws to introduce electoral bonds were deemed arbitrary and violative of fundamental rights.
- The court ordered the State Bank of India to cease issuing electoral bonds and mandated disclosure of all previously issued bonds to the Election Commission.
- The judgment underscores the importance of judicial review in upholding democratic principles and protecting constitutional rights.
Key Challenges:
- The influence of money in elections remains a challenge, including the use of black money and bribery.
- The lack of independent voting in India’s legislative process allows ruling parties to pass laws without sufficient scrutiny or consultation.
- Political parties’ resistance to transparency raises concerns about their commitment to serving the public interest.
Main Terms from the article:
- Electoral bonds: Instruments for anonymous political donations introduced in India.
- Transparency: Openness and accountability in political processes and decision-making.
- Judicial review: The power of courts to assess the constitutionality of laws and government actions.
- Fundamental rights: Constitutional protections for individual freedoms and equality.
- Campaign funding: Financial support for political parties and candidates during elections.
Important phrases for mains answer writing:
- “Transparency is the basis of campaign funding.”
- “The judgment restores transparency in political funding.”
- “The ruling prevents undue influence on the government by corporate donors.”
- “The power of judicial review is crucial for upholding democracy.”
- “The price of democracy is eternal vigilance.”
Quotes for value addition:
- “The electoral bonds scheme was opaque.”
- “The judgment prevents crony capitalism from influencing political parties.”
- “The ruling party bypassed transparency with electoral bonds.”
- “The power of judicial review is precious.”
- “We need political parties, but it is up to us to ensure they work for the good of society.”
Useful Statements:
- “The Supreme Court’s decision reaffirms the principle that transparency is essential for democracy.”
- “The ruling highlights the need for robust mechanisms to prevent undue influence on political processes.”
- “Public scrutiny and vigilance are vital for holding political parties accountable.”
- “The judgment sets a precedent for upholding constitutional rights in electoral matters.”
- “Citizens’ engagement is crucial for ensuring that political parties serve the interests of the nation.”
Examples and References:
- The case of electoral bonds exemplifies the tension between transparency and political expediency in India’s democracy.
- Similar challenges with campaign finance transparency have been observed in other democracies worldwide.
- Instances of corporate influence on policy-making underscore the importance of regulating political funding.
- Civil society organizations and activists have played a critical role in advocating for transparency in political funding.
- Past instances of electoral malpractice highlight the need for stronger legal safeguards against undue influence.
Facts and Data:
- The Supreme Court’s ruling was issued on February 15, 2024.
- Electoral bonds were introduced as a means of anonymous political funding.
- Amendments to various laws facilitated the implementation of the electoral bonds scheme.
- The Election Commission of India raised concerns about the potential misuse of electoral bonds.
- The judgment requires the State Bank of India to disclose all previously issued electoral bonds to the Election Commission by March 6, 2024.
Critical Analysis:
- The electoral bonds scheme represented a departure from established norms of transparency in political funding.
- The Supreme Court’s decision underscores the judiciary’s role in upholding democratic principles and constitutional rights.
- The ruling highlights the challenges of balancing political expediency with the need for transparency and accountability.
- Political parties’ resistance to transparency raises questions about their commitment to democratic values.
- The judgment sets a precedent for future legal challenges to electoral practices that undermine transparency and accountability.
Way Forward:
- Strengthening legal safeguards to ensure transparency and accountability in political funding.
- Promoting civic engagement and public awareness to hold political parties accountable.
- Enhancing mechanisms for independent oversight and regulation of campaign finance.
- Encouraging broader political reforms to address systemic issues of corruption and undue influence.
- Emphasizing the importance of upholding democratic principles and constitutional rights in electoral matters
Get an IAS/IPS ranker as your 1: 1 personal mentor for UPSC 2024
Attend Now
Note4Students
From UPSC perspective, the following things are important :
Prelims level: Na
Mains level: ethical considerations surrounding the use of Artificial Intelligence (AI) to clone voices for creative purposes in the music industry
Get an IAS/IPS ranker as your 1: 1 personal mentor for UPSC 2024
Attend Now
Note4Students
From UPSC perspective, the following things are important :
Prelims level: Bar Council of India
Mains level: systemic challenges plaguing legal education in India and the urgent need for reform

Central Idea:
The article discusses the recent recommendations made by the Parliamentary Standing Committee on Personnel, Public Grievances, Law, and Justice to enhance the quality of legal education in India. It highlights the need for a new regulatory body, the National Council for Legal Education and Research (NCLER), to oversee post-graduation level education, prioritize research in law schools, and address the challenges hindering the excellence of legal education in the country.
Key Highlights:
- Recommendations for Regulatory Reform: The committee proposes limiting the Bar Council of India’s (BCI) role in legal education regulation and establishing the NCLER to set qualitative benchmarks for post-graduation level education.
- Emphasis on Research: Recognizing the deficiency in research focus among Indian law schools, the committee stresses the importance of promoting research to improve teaching outcomes and cultivate critical thinking skills among students.
- Global Perspective: Acknowledging the impact of globalization on legal education, the committee suggests incorporating global curriculum, international exchange programs, and more international law courses to prepare students for a globalizing world.
- Call for Strong Leadership and Academic Freedom: The article emphasizes the necessity for passionate and visionary academic leaders in law faculties and universities to foster a supportive environment for faculty and promote academic freedom.
Key Challenges:
- Lack of Leadership: The absence of effective leadership in law faculties and universities impedes efforts to achieve excellence in legal education.
- Insufficient Research Focus: Many law schools in India prioritize teaching over research, resulting in a scarcity of indigenous legal knowledge and reliance on Western legal literature.
- Resistance to Change: Implementing reforms in legal education requires a shift in mindset among stakeholders and a commitment to prioritize higher education.
Main Terms or key quotes:
- National Council for Legal Education and Research (NCLER)
- Bar Council of India (BCI)
- Globalization
- Academic Freedom
Important Phrases for mains answer enrichment:
- “Sea of institutionalized mediocrity”
- “Consumer of legal knowledge generated in the West”
- “Augmenting the research ecosystem”
- “Complete academic freedom and autonomy”
Quotes for quality essay:
- Albert Einstein: “The value of a college education is not the learning of many facts but the training of the mind to think.”
- Jawaharlal Nehru: “A university stands for humanism, for tolerance, for reason, for the adventure of ideas and for the search of truth.”
Useful Statements:
- “Legal education in India needs regulatory reform to address its current shortcomings and enhance its quality.”
- “Promoting research is crucial to improving teaching outcomes and fostering critical thinking skills among students.”
- “Effective leadership and academic freedom are essential for driving meaningful change in legal education.”
Examples and References:
- National Law School of India University and Jindal Global Law School are among the few Indian law schools ranked in the top 250 globally.
- Out of over 800 law journals indexed in Scopus, only a handful are from India, indicating the low level of research output from Indian law schools.
Facts and Data:
- India has over 1,700 law schools, but only a few have achieved excellence in legal education.
- Legal education in India has historically lagged behind fields like medicine and engineering in terms of priority and investment.
Critical Analysis:
The article aptly highlights the systemic challenges plaguing legal education in India and the urgent need for reform. It identifies regulatory deficiencies, research gaps, and leadership issues as key barriers to achieving excellence. However, it fails to delve deeply into the specific strategies or mechanisms required to address these challenges.
Way Forward:
- Implement the recommendations of the Parliamentary Standing Committee to establish the NCLER and redefine the role of the BCI.
- Invest in promoting research culture in law schools through funding, infrastructure, and academic support.
- Encourage academic leadership that fosters a culture of innovation, excellence, and academic freedom.
- Foster collaboration between law schools, industry, and international institutions to enhance curriculum relevance and global exposure for students.
In conclusion, while the recommendations put forth by the committee represent a step in the right direction, concerted efforts from all stakeholders are necessary to bring about meaningful change and elevate the quality of legal education in India.
Get an IAS/IPS ranker as your 1: 1 personal mentor for UPSC 2024
Attend Now
Note4Students
From UPSC perspective, the following things are important :
Prelims level: Places of Worship Act, 1991
Mains level: need for the Supreme Court to intervene to protect the integrity of the Places of Worship Act and prevent its politicization
Central Idea:
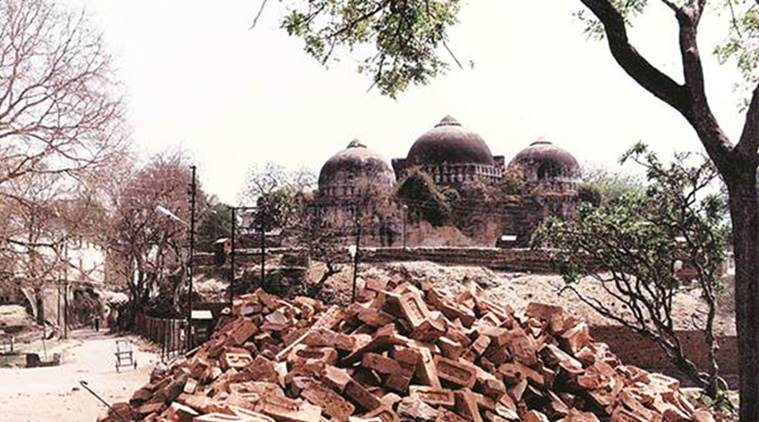
The article discusses the aftermath of the Supreme Court verdict on the Babri Masjid case in November 2019 and its implications on the Places of Worship (Special Provisions) Act, 1991. It highlights the challenges posed by the resurgence of petitions targeting mosques like the Gyanvapi Masjid in Varanasi and the Shahi Idgah in Mathura, and the subsequent debates on the Act’s validity and applicability. It emphasizes the need for the Supreme Court to intervene to protect the integrity of the Act and prevent its politicization.
Key Highlights:
- Supreme Court’s verdict on the Babri Masjid case in November 2019 praised the Places of Worship Act, 1991 for preserving the religious character of places of worship as of August 15, 1947.
- Hindutva forces initiated petitions targeting mosques in Mathura, Varanasi, and other places, challenging their status and calling for their liberation.
- Despite lack of concrete evidence, petitions against mosques were admitted in various district courts, signaling a deliberate challenge to the Places of Worship Act.
- The Supreme Court’s silence on the increasing challenges to the Act raised concerns about its integrity and enforcement.
- The court’s decision to hear petitions against the Act itself and the Union government’s delays in specifying its stance raised doubts about the Act’s future.
Key Challenges:
- Increasing petitions challenging the status of mosques threaten communal harmony and challenge the secular principles enshrined in the Indian Constitution.
- The politicization of the issue, with petitions being used as a tool to further certain political narratives, adds complexity to the debate.
- Delays in the Supreme Court’s intervention and the government’s ambiguity on the Act’s status create uncertainty and erode public trust in the legal system.
- Historical grievances and communal tensions fuel the resurgence of demands for the reclamation of religious sites.
Main Terms or key words:
- Places of Worship (Special Provisions) Act, 1991: Legislation preserving the religious character of places of worship as of August 15, 1947, and prohibiting their conversion.
- Hindutva: Ideology promoting Hindu nationalism.
- Communal Harmony: Peaceful coexistence and cooperation among different religious communities.
- Secularism: Principle of separating religion from state affairs and ensuring equal treatment of all religions.
- Petitions: Formal requests submitted to a court seeking legal action or remedy.
Important Phrases for mains value addition:
- “Non-retrogression as an essential feature of our secular values.”
- “Challenges to the Act amount to a breach of public trust.”
- “The politicization of petitions serves certain political narratives.”
- “The silence of the top court is unsettling.”
Quotes for quality enrichment of mains answers:
- “The Places of Worship Act imposes a non-derogable obligation towards enforcing our commitment to secularism under the Indian Constitution.”
- “Similarly minded people are as little likely to be deterred by the provisions of the Places of Worship (Special Provisions) Act 1991.”
- “The ascertainment of the religious character of a place as a procedural instrument may not necessarily fall foul of the provisions of sections 3 and 4 of the Act of 1991.”
Anecdotes:
- The order of a district court in Uttar Pradesh in 1986 kick-started events leading to the destruction of the Babri Masjid, illustrating the significance of legal decisions regarding places of worship.
Useful Statements:
- The resurgence of demands for the reclamation of religious sites threatens communal harmony and challenges secular principles.
- The Supreme Court’s intervention is crucial to uphold the integrity of the Places of Worship Act and prevent its politicization.
Examples and References:
- Petitions targeting mosques in Mathura, Varanasi, and other places highlight the growing challenges to the Places of Worship Act.
- The Babri Masjid-Ramjanambhoomi agitation and slogans like “Ayodhya to jhanki hai, Kashi, Mathura baqi hai” demonstrate historical grievances and communal tensions.
Facts and Data:
- The Places of Worship Act, 1991, preserves the religious character of places of worship as of August 15, 1947.
- The Supreme Court admitted petitions challenging the Act’s validity and the government’s delays in specifying its stance.
Critical Analysis:
The article provides a comprehensive overview of the challenges posed by petitions targeting mosques and questioning the Places of Worship Act, 1991. It emphasizes the importance of preserving communal harmony and secular principles while addressing historical grievances. However, it also highlights the politicization of the issue and the need for timely intervention by the Supreme Court to prevent further escalation.
Way Forward:
- The Supreme Court should actively intervene to uphold the integrity of the Places of Worship Act and prevent its politicization.
- Political leaders and stakeholders should prioritize communal harmony and refrain from using religious sentiments for political gain.
- Civil society should promote dialogue and understanding among different religious communities to prevent communal tensions.
- The government should clarify its stance on the Act and ensure its effective implementation to maintain secularism and protect religious freedoms.
Get an IAS/IPS ranker as your 1: 1 personal mentor for UPSC 2024
Attend Now
Note4Students
From UPSC perspective, the following things are important :
Prelims level: Fatehpur Sikri
Mains level: Rights of Persons with Disabilities Act (RPWD)

Central Idea:
The article highlights the importance of accessibility and inclusion for individuals with disabilities in public spaces, using personal experiences and examples from Fatehpur Sikri, a 16th-century monument, to underscore the need for adherence to international standards and the implementation of inclusive practices across India. It emphasizes the urgent need for prioritizing accessibility in the built environment, including ramps and other accommodations, to enable full participation and empowerment of all citizens, regardless of their physical limitations.
Key Highlights:
- Personal experiences at Fatehpur Sikri illustrate the significance of proper accessibility measures.
- Lack of adherence to international standards poses challenges for individuals with disabilities in navigating public spaces.
- The Rights of Persons with Disabilities Act (RPWD) is mentioned as a framework for promoting accessibility, but implementation lags.
- Inclusive design is essential for ensuring equal access to public buildings, transport, and information technology.
- The absence of accurate disability data in India raises questions about the extent of inclusivity and the need for targeted policies.
Key Challenges:
- Inconsistent adherence to international accessibility standards in public spaces.
- Limited implementation of the Rights of Persons with Disabilities Act (RPWD) despite its enactment.
- Lack of accurate disability data hampers effective policy formulation and planning.
- Heterogeneity of disabilities poses challenges in designing inclusive solutions.
- Socioeconomic disparities contribute to unequal access to accessible infrastructure and support services.
Main Terms:
- Accessibility
- Inclusion
- Rights of Persons with Disabilities Act (RPWD)
- Universal design
- Public accommodations
- Built environment
- International standards
- Heterogeneity of disabilities
- Socioeconomic disparities
- Inclusive practice

Important Phrases:
- “International standard for a ramp slope”
- “Rights of Persons with Disabilities Act (RPWD)”
- “Universal design”
- “Built environment”
- “Socio-economic background”
- “Accurate disability data”
- “Inclusive environment”
- “Heterogeneity of disability”
- “Accessibility of public accommodations and roads”
- “Participation in civic and socio-economic life”
Quotes:
- “If a city built in 1569 AD can be made nearly 95 per cent wheelchair accessible, so can all public accommodations and roads.”
- “Only by accomplishing this can we realise the full potential of our citizenry, empowering them to actively contribute their professional expertise and diverse skills for the optimal development of the country.”
- “It is evident that our country has miles to go before genuine inclusivity can be celebrated.”
- “The absence of ramps is just one example of why the disabled citizenry often finds it challenging to fully participate in civic and socio-economic life, potentially resulting in diminished self-esteem.”
- “Every Indian deserves the freedom to experience our country’s rich history and heritage along with the rights accorded to all citizens.”
Anecdotes:
- The personal experience of the author’s brother tipping over in a wheelchair due to a steep ramp highlights the dangers posed by inadequate accessibility measures.
- The contrast between the accessible ramps at Fatehpur Sikri and the inaccessible environments encountered in daily life underscores the importance of universal design in public spaces.
Useful Statements:
- “Implementing proper accessibility measures is a cost-effective investment in enhancing accessibility for individuals with physical limitations.”
- “Inclusive design is essential for ensuring equal access to public buildings, transport, and information technology.”
- “In pursuing true accessibility, involving multiple end-users in the design process is crucial for determining its success.”
Examples and References:
- Fatehpur Sikri as an example of successful accessibility implementation.
- Comparison between international standards and the actual accessibility of public spaces in India.
- Mention of UN-Habitat’s definition of an inclusive environment.
- Reference to the Rights of Persons with Disabilities Act (RPWD) as a framework for promoting accessibility.
- World Health Organization’s data on global disability prevalence versus India’s reported disability rates.
Facts and Data:
- Fatehpur Sikri is mentioned as being nearly 95% wheelchair accessible.
- The World Health Organization estimates that 16% of the global population experiences significant disabilities.
- India’s last Census in 2011 reported only 2.2% of the population as having disabilities.
Critical Analysis: The article effectively combines personal anecdotes with broader observations to highlight the challenges and importance of accessibility and inclusion in India. It critiques the lack of adherence to international standards and the limited implementation of legislative frameworks, emphasizing the need for concrete action to address these issues. However, it also acknowledges the complexities involved, such as the heterogeneity of disabilities and socioeconomic disparities, which require nuanced approaches to ensure meaningful inclusivity.
Way Forward:
- Prioritize accessibility and inclusion as national priorities, possibly under a dedicated “mission.”
- Ensure consistent adherence to international standards in the design and construction of public spaces.
- Improve implementation of the Rights of Persons with Disabilities Act (RPWD) and enhance data collection on disability prevalence.
- Promote inclusive design practices and involve end-users in the planning and development of accessible infrastructure.
- Raise awareness and advocate for the rights of individuals with disabilities to foster a more inclusive society.
Get an IAS/IPS ranker as your 1: 1 personal mentor for UPSC 2024
Attend Now
Note4Students
From UPSC perspective, the following things are important :
Prelims level: President and governor speeches
Mains level: the tradition of presidential and gubernatorial addresses to Parliament and Legislative Assemblies in India
Central Idea:
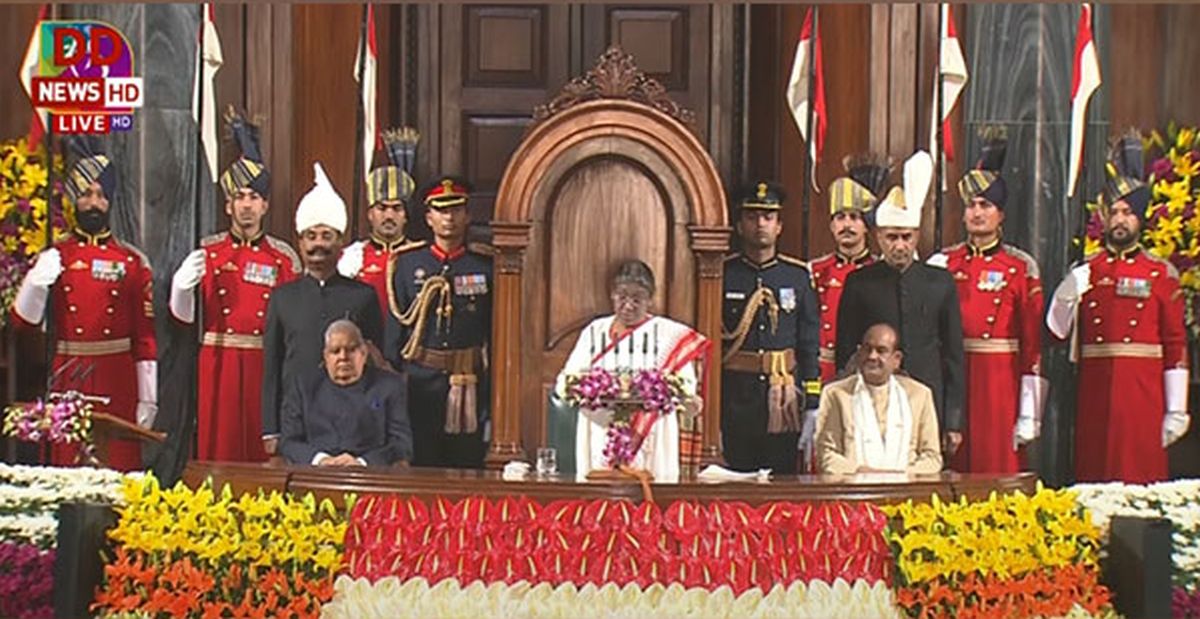
The article discusses the tradition of presidential and gubernatorial addresses to Parliament and Legislative Assemblies in India, highlighting the ceremonial and ritualistic nature of these events. It emphasizes the need for reform to streamline these addresses, suggesting a shift towards shorter, more concise speeches akin to the British practice, to save time and enhance efficiency in legislative proceedings.
Key Highlights:
- Presidential and gubernatorial addresses in India are steeped in tradition, characterized by elaborate ceremonies and rituals.
- The speeches are drafted by the government of the day, with little involvement from the heads of state, leading to lengthy and sometimes tiresome readings.
- Past presidents like R. Venkataraman and K.R. Narayanan exhibited meticulousness in reviewing draft speeches, suggesting improvements that were generally accepted.
- Similar experiences were observed at the state level, with governors making suggestions for changes to their addresses, sometimes leading to unexpected challenges.
- The article reflects on instances of political civility, where suggested changes were acknowledged and accommodated, despite time constraints.
- Despite the ceremonial nature of these addresses, controversy and turbulence in legislative assemblies have been on the rise, fueled by accusations and counter-accusations.
- The root cause of the problem lies in the disconnect between the writers and readers of these speeches, raising questions about ownership and relevance.
- The author proposes adopting a more concise format for these addresses, similar to the British model, to refocus attention on legislative business and mitigate political polarization.
Key Challenges:
- Resistance from governments accustomed to using these addresses as platforms to showcase their achievements and plans.
- Convincing stakeholders about the efficacy of shifting towards shorter, more focused speeches.
- Overcoming entrenched traditions and resistance to change within the political system.
- Balancing the ceremonial aspects of these addresses with the need for efficiency and relevance in legislative proceedings.
- Addressing political polarization between central and state governments, which may hinder collaborative efforts towards reform.
Main terms for answer quality enhancement:
- Presidential address
- Gubernatorial address
- Ceremonial
- Ritualistic
- Legislative proceedings
- Political polarization
- Tradition
- Efficiency
- Reform
Important Phrases:
- “Land of largely unquestioned custom, ceremonials, and rituals”
- “Suggesting changes by them difficult”
- “Saving of time and the avoiding of tedium”
- “Political civility”
- “Root of the problem”
- “Ornament of convention”
- “Collective body of legislators”
- “Innovative and self-denying Chief Minister”
Quotes:
- “When I am asked to read these Addresses, I feel like saying ‘Rashtrapati Bhavan’ and sitting down!” – R. Venkataraman
- “The speech was not mine, it was yours.” – Unnamed speaker to Nitish Kumar
- “Who Owns that Speech?” – Professor A.R. Venkatachalapathy
Anecdotes:
- R. Venkataraman’s meticulous review of draft speeches, despite tight timeframes.
- Chief Minister Buddhadeb Bhattacharjee’s prompt action to rectify an oversight in a gubernatorial address.
- The Governor of Bihar officiating a seamless legislative ceremony, earning appreciation from the Chief Minister.
Useful Statements for critical approach in answer writing:
- “The root of the problem lies in the foundational dichotomy of one agency writing the speech and another reading it.”
- “Presidents and Governors will, I think, be relieved with such a rearrangement.”
- “It will take an innovative and self-denying Chief Minister to start the reform to rescue a custom, ceremony, and ritual of grace from disgrace.”
Examples and References:
- Instances of past presidents and governors suggesting changes to draft speeches, with varying degrees of acceptance and acknowledgment.
- Comparison with the British practice of brief, outline-focused speeches by the head of state.
Facts and Data:
- Terms of past presidents and governors mentioned in the article (e.g., R. Venkataraman, K.R. Narayanan).
- References to specific events, such as the oversight in printing a gubernatorial address.
Critical Analysis:
- The article presents a nuanced critique of the ceremonial nature of presidential and gubernatorial addresses, highlighting inefficiencies and challenges.
- It underscores the importance of streamlining these addresses to enhance legislative efficiency and mitigate political polarization.
- The proposed reform aligns with the need for modernization and adaptation within the Indian political system.
Way Forward:
- Advocate for collaborative efforts among stakeholders to initiate reform and streamline the process of presidential and gubernatorial addresses.
- Emphasize the benefits of shorter, more focused speeches in enhancing legislative efficiency and relevance.
- Encourage political leaders to prioritize the collective interests of legislators and citizens over traditional ceremonies and rituals.
Get an IAS/IPS ranker as your 1: 1 personal mentor for UPSC 2024
Attend Now
Note4Students
From UPSC perspective, the following things are important :
Prelims level: World Economic Forum's Global Gender Gap Report
Mains level: debate surrounding paid menstrual leave
Central Idea:
The article discusses the complex issue of providing paid leave for menstruation, highlighting its potential impact on gender equality and societal perceptions of menstruation. It argues against the implementation of blanket policies, advocating instead for tailored support and inclusivity on a case-by-case basis.
Key Highlights:
- Sabrimala Temple Issue: Highlights the struggle against discriminatory practices related to menstruation, emphasizing the need for gender equality.
- Global Gender Gap: Discusses the widening gender gap globally and its implications on workforce participation and leadership roles for women.
- Challenges in Implementing Paid Menstrual Leave: Raises concerns about exacerbating gender inequality, social stigma, and potential misuse of leave policies.
- Case of Japan: Explores the experience of Japan with unpaid menstrual leave and its limited uptake, alongside persisting gender disparities in the workforce.
- Enforcement Challenges: Cites instances of intrusive enforcement methods and underscores the need for sensitive implementation strategies.
- Ongoing Struggles for Gender Equality: Highlights various arenas where women continue to fight for equal treatment, including combat roles and pay parity.
Key Challenges:
- Social Stigma: Addressing societal taboos and perceptions surrounding menstruation.
- Gender Equality: Balancing the need for menstrual support with potential impacts on women’s workforce participation and leadership opportunities.
- Implementation Issues: Ensuring fair and non-intrusive enforcement of leave policies without perpetuating discrimination or abuse.
- Cultural Sensitivity: Acknowledging diverse experiences and cultural contexts surrounding menstruation.
- Policy Effectiveness: Assessing the efficacy of paid menstrual leave in addressing menstrual health needs while advancing gender equality.
Main Terms:
- Menstruation
- Gender Gap
- Paid Leave
- Gender Equality
- Social Stigma
- Workforce Participation
Important Phrases:
- “Period shaming”
- “Blanket biological disadvantage”
- “Tailoring support”
- “Inclusivity on a case-by-case basis”
- “Sensitive implementation strategies”

- The menstrual cycle can be affected by external factors such as stress, changes in temperature and altitude, and even exposure to certain chemicals and toxins.
- This can cause changes in the length of the cycle, the intensity of bleeding, and the severity of symptoms.
- There is also a small percentage of women who experience menorrhagia, which is an excessive bleeding during menstruation. This can be caused by hormonal imbalances, fibroids, endometriosis, and other underlying medical conditions.
Quotes:
- “Menstruation is not a disease, but a natural phenomenon.”
- “Granting special status to menstruation would validate social stigma.”
- “Recognizing the diverse nature of menstrual experiences is essential.”
- “Women in Japan are less likely to be employed and often paid lesser.”
- “Women continue to fight for equal treatment in various arenas.”
Anecdotes:
- Sabrimala Temple issue highlighting the struggle against discriminatory practices.
- Instances of intrusive enforcement methods in Bhuj and Muzzaffarnagar schools.
- Limited uptake of unpaid menstrual leave in Japan despite its availability for decades.
Useful Statements:
- “Paid leave for menstruation could unintentionally widen the gender gap.”
- “Tailoring support on a case-by-case basis promotes inclusivity and addresses individual needs.”
- “Sensitive implementation strategies are crucial to prevent discrimination and abuse.”
Examples and References:
- Sabrimala Temple issue
- Global Gender Gap Report 2021
- Case of Japan and its gender disparities in the workforce
- Incidents in Bhuj and Muzzaffarnagar schools
- Ongoing struggles for gender equality in combat roles and pay parity
Facts and Data:
- The World Economic Forum’s Global Gender Gap Report 2021.
- National Family Health Survey (NFHS) report highlighting menstrual health challenges in India.
- Low uptake of menstrual leave in Japan, with only 0.9% of women availing it.
- Gender disparities in Japan’s workforce despite higher education levels among women.
Critical Analysis:
The article offers a nuanced perspective on the debate surrounding paid menstrual leave, highlighting both its potential benefits and challenges. It critically examines the implications of such policies on gender equality, social stigma, and workforce dynamics, emphasizing the importance of context-sensitive approaches.
Way Forward:
- Awareness and Education: Promote awareness and education to combat social stigma and misconceptions surrounding menstruation.
- Tailored Support: Advocate for tailored support and accommodations for individuals experiencing menstrual challenges, rather than blanket policies.
- Sensitive Implementation: Develop sensitive implementation strategies to ensure fair and non-discriminatory enforcement of leave policies.
- Continued Advocacy: Continue advocating for gender equality in all spheres, including combat roles and pay parity, to address systemic inequalities.
Get an IAS/IPS ranker as your 1: 1 personal mentor for UPSC 2024
Attend Now
Note4Students
From UPSC perspective, the following things are important :
Mains level: India's evolving relations with the Gulf
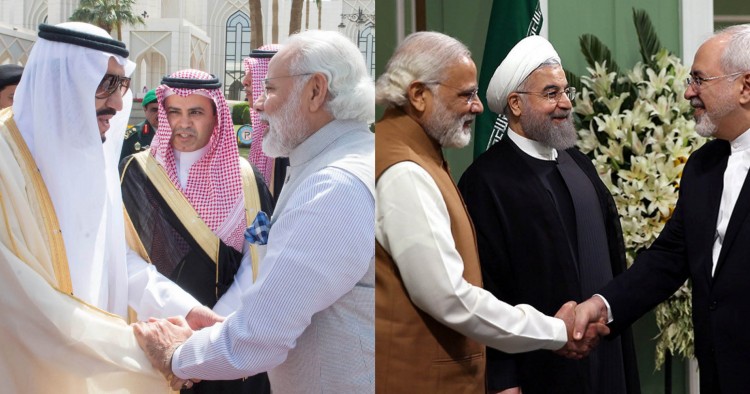
Central Idea:
The article discusses the significant transformation in India’s relations with the Gulf region under Prime Minister Narendra Modi’s leadership, highlighted by recent diplomatic achievements such as the inauguration of a Hindu temple in Abu Dhabi and the release of Indian ex-naval personnel from Qatar. It identifies five key factors contributing to this transformation: diplomatic efforts, political engagement, religious perceptions, economic collaboration, and counter-terrorism cooperation.
Key Highlights:
- Modi’s proactive diplomacy in the Middle East, contrasting with the previous administration’s limited engagement.
- The shift from transactional to strategic economic ties, recognizing the Gulf’s growing influence in global capitalism.
- Improvement in religious tolerance in the Gulf, symbolized by the construction of a Hindu temple in Abu Dhabi.
- Enhanced counter-terror collaboration between India, Saudi Arabia, and the UAE.
- The potential for deeper defense cooperation and India’s role as a regional security provider.
Key Challenges:
- Historical religious tensions and the need to overcome past perceptions.
- Maximizing defense collaboration potential amid shifting regional geopolitics.
- Ensuring sustainable economic partnerships beyond oil purchases and labor exports.
Main Terms:
- Diplomacy
- Political engagement
- Religious tolerance
- Economic modernization
- Counter-terrorism collaboration
- Defense cooperation
Important Phrases:
- “Transformation of India’s relations with the Gulf”
- “Personal connection with the emirs”
- “Gulf’s emergence as a major center of global capitalism”
- “Growing religious tolerance”
- “Counter-terror collaboration”
- “Regional security provider”
Quotes/Useful Statements:
- “Modi’s proactive diplomacy contrasts with the previous administration’s limited engagement.”
- “The shift from transactional to strategic economic ties is crucial.”
- “Enhanced counter-terror collaboration signals a new phase in regional security.”
- “The construction of a Hindu temple in Abu Dhabi symbolizes growing religious tolerance.”
- “India must maximize defense collaboration potential amid shifting regional geopolitics.”
Examples and References:
- Narendra Modi’s 15 visits to the Middle East contrasted with the previous Prime Minister’s limited engagements.
- The inauguration of the Hindu temple in Abu Dhabi and the release of Indian ex-naval personnel from Qatar serve as tangible examples of improved relations.
- The establishment of the I2U2 group and the India-Middle East-Europe Economic Corridor illustrate India’s reoriented geopolitical engagement.
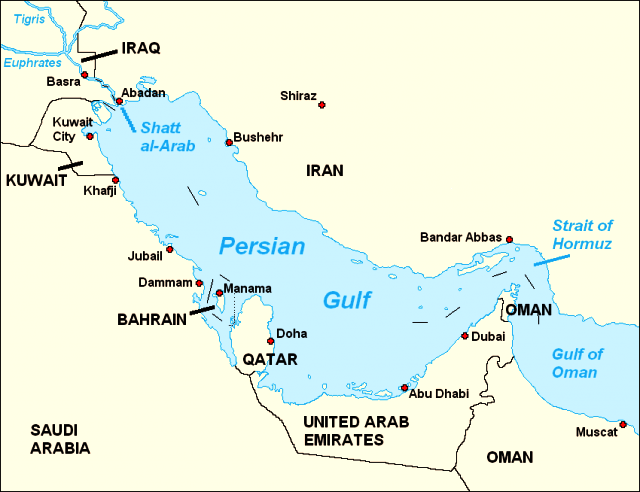
Facts and Data:
- Modi’s 15 visits to the Middle East compared to the previous Prime Minister’s four visits during the UPA rule.
- The release of Indian ex-naval personnel from Qatar following their espionage charges.
- The establishment of the I2U2 group and the India-Middle East-Europe Economic Corridor.
Critical Analysis:
- The article provides a comprehensive overview of India’s evolving relations with the Gulf, highlighting both achievements and challenges.
- It emphasizes the importance of Modi’s proactive diplomacy and the need for deeper economic and defense cooperation.
- However, it also acknowledges historical tensions and the complexities of navigating religious and geopolitical dynamics in the region.
Way Forward:
- India should continue to strengthen diplomatic ties and capitalize on economic opportunities in the Gulf.
- Deeper defense collaboration and regional security cooperation should be prioritized.
- Efforts to promote religious tolerance and overcome historical tensions are essential for fostering long-term stability and prosperity in the region.
Get an IAS/IPS ranker as your 1: 1 personal mentor for UPSC 2024
Attend Now
Note4Students
From UPSC perspective, the following things are important :
Prelims level: na
Mains level: a shift in the approach of Indian scientists towards addressing real-life problems
Central Idea:
The article argues for a shift in the approach of Indian scientists towards addressing real-life problems by integrating knowledge from various disciplines, including the humanities. It emphasizes the need for scientists to engage with societal issues, collaborate across disciplines, and embrace diverse forms of knowledge to find holistic solutions.
Key Highlights:
- Critique of the current scientific paradigm in India, where pursuit of quick rewards and adherence to disciplinary boundaries hinder problem-solving.
- Advocacy for a multidisciplinary approach that incorporates insights from the humanities and social sciences.
- Emphasis on the importance of understanding human complexities and societal context in scientific endeavors.
- Proposal for scientists to engage with communities, embrace humility, and recognize diverse forms of knowledge.
- Criticism of the hierarchical and reductionist tendencies within the scientific community.
- Assertion that addressing complex problems requires creativity, flexibility, and integration of diverse perspectives.
Key Challenges:
- Resistance from scientists accustomed to disciplinary silos and reductionist methodologies.
- Lack of institutional support and incentives for interdisciplinary collaboration.
- Need for a shift in mindset among scientists to prioritize societal impact over academic achievements.
- Overcoming entrenched power dynamics within the scientific community.
- Bridging the gap between academic research and practical problem-solving.
- Incorporating diverse forms of knowledge while ensuring rigor and reliability.
Main Terms:
- Scientific temper
- Reductionism
- Multidisciplinary approach
- Human sciences
- Interdisciplinary collaboration
- Social embeddedness
- Empirical testing
- Holistic understanding
Important Phrases:
- “Science-society border”
- “Climb down from the ivory tower”
- “Human complexities”
- “Tacit knowledge”
- “Integration of knowledge”
- “Extended peer community”
- “Proper scientific temper”
- “Cross-cultural conversation”
Quotes:
- “While religion is a sacred cow that doubles up as a cash cow, science is a cash cow that can often double up as a sacred cow in India.”
- “The whole is greater than the sum of its parts.”
- “Science leaves this kind of integration of knowledge from other sources out of the ‘scientific method’ altogether.”
- “A traditional puzzle solver scientist is like the mediocre artist who starts with a clearly visualized picture in mind and ends up painting it without leaving any scope for growth and change during the process.”
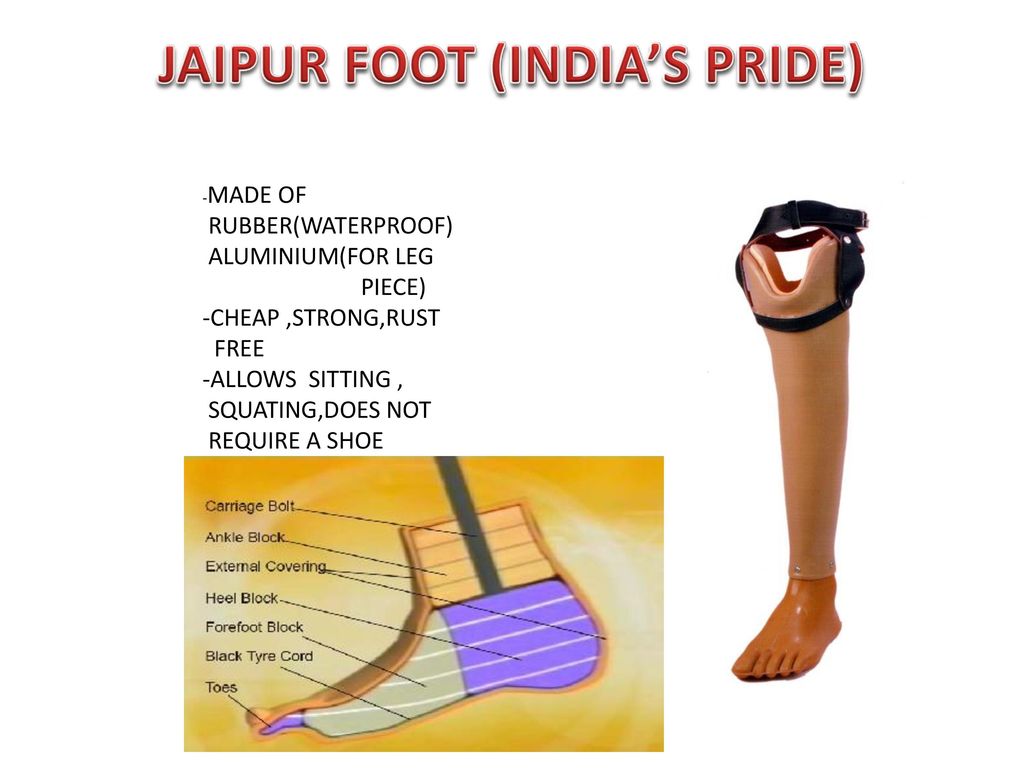
Useful Statements for mains value addition:
- “The time has come for a large chunk of scientific forces to be re-deployed on the science-society border to scout for solutions to real-life problems.”
- “The natural sciences then need to work in tandem with human sciences.”
- “A variety of perspectives and methods from different disciplines need to be brought to bear on a complex real-life problem.”
- “Philosophy has interacted fruitfully with business and medicine on issues of ethics and reproductive technologies.”
- “Science must confront the uncomfortable prospect of dealing with human complexities.”
Examples and References for qauality enrichment:
- The frothing Bellandur lake in Bengaluru vs. scholarly papers on the “giant gravity hole in the Indian Ocean.”
- Collaborations between philosophy, business, and medicine on ethical issues.
- Real-life problems such as human cloning, stem cell research, and the Israeli-Palestinian conflict with religious components.
Facts and Data:
- Reference to Manu Rajan, a retired information scientist from the Indian Institute of Science, Bengaluru.
- Mention of the threats posed by developments such as artificial intelligence.
- Reference to the prevalence of disciplinary silos and reductionist approaches in Indian scientific institutions.
Critical Analysis:
The article provides a compelling critique of the current scientific paradigm in India, highlighting its limitations in addressing real-life problems. It emphasizes the importance of interdisciplinary collaboration and the integration of knowledge from the humanities and social sciences. However, it could provide more concrete examples of successful interdisciplinary efforts and practical strategies for fostering collaboration. Additionally, the article could address potential challenges in implementing its proposed changes, such as institutional resistance and resource constraints.
Way Forward:
- Promote interdisciplinary research initiatives and provide incentives for collaboration.
- Establish platforms for dialogue and knowledge exchange between scientists and diverse stakeholders.
- Invest in education and training programs that emphasize holistic problem-solving skills.
- Foster a culture of humility, curiosity, and openness to diverse perspectives within the scientific community.
- Encourage partnerships between academic institutions, government agencies, and civil society organizations to address pressing societal challenges.
In conclusion, the article advocates for a paradigm shift in Indian science towards a more inclusive, interdisciplinary approach that prioritizes real-life problem-solving and societal impact. By embracing diverse forms of knowledge and collaborating across disciplines, scientists can better address the complex challenges facing society.
Get an IAS/IPS ranker as your 1: 1 personal mentor for UPSC 2024
Attend Now
Note4Students
From UPSC perspective, the following things are important :
Prelims level: Disguised unemployment
Mains level: India's economic stagnation, particularly in terms of industrialization and employment generation,
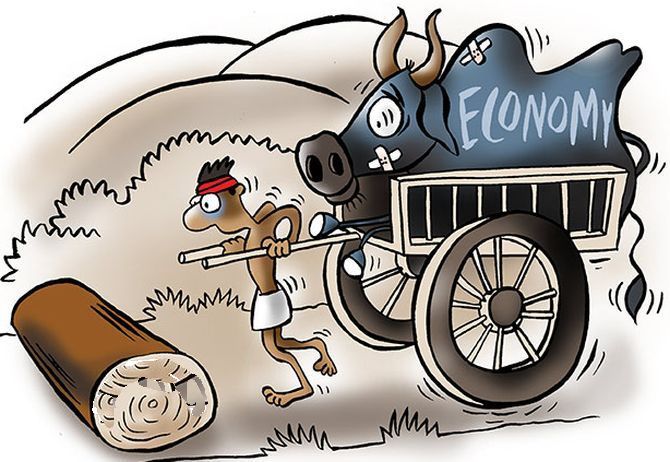
Central Idea:
The article explores India’s economic stagnation, particularly in terms of industrialization and employment generation, and proposes a shift towards high-skill, services-driven growth as advocated by Raghuram Rajan and Rohit Lamba in their book “Breaking the Mould: Reimagining India’s Economic Future”. It argues that traditional approaches to industrialization have not been effective in India and suggests that focusing on high-skill services, particularly in the IT sector, could stimulate manufacturing and address socio-economic inequalities.
Key Highlights:
- India’s historical struggle with industrialization despite various reform efforts.
- Proposal for a shift towards high-skill services-led growth to stimulate manufacturing.
- Critique of traditional industrial policy and its failure to address unemployment and trade deficits.
- Challenges posed by poor employment elasticity of services-led growth and inequality in the service sector.
- Impact of unequal access to education on labor market outcomes and economic disparities.
- Cultural factors contributing to India’s industrial stagnation, including undervaluing certain occupations and skills.
- Importance of mass education and collective absorptive capacity for innovation and economic development.
Key Challenges:
- Poor employment elasticity of services-led growth.
- Inequality in the service sector, particularly in terms of wages.
- Unequal access to education and skills training, exacerbating socio-economic disparities.
- Cultural attitudes towards certain occupations hindering innovation and industrial development.
- Lack of mass education and collective absorptive capacity for technological progress.
Main Terms:
- Industrialization
- Services-driven growth
- High-skill services
- Information technology (IT)
- Unemployment
- Trade deficit
- Inequality
- Mass education
- Absorptive capacity
- Technological progress
Important Phrases:
- “Premature deindustrialization”
- “Disguised unemployment”
- “Mass school education”
- “High-skill services pitch”
- “Cultural prerequisite for industrialization”
- “Useful knowledge”
- “Organic innovation in manufacturing”
- “Collective absorptive capacity”
- “Deep industrialization”
Quotes:
- “Rural entrepreneurship was able to grow out of the traditional agricultural sector on a massive scale [in China]. The rural Indian, in contrast, hampered by a poor endowment of human capital, were not able to start entrepreneurial ventures remotely on the scale of the Chinese.” – Yasheng Huang
- “India needs deep industrialization, not just the service sector, that has the power of changing the foundations of society.” – Authors (Rajan and Lamba)
Useful Statements:
- “India’s historical struggle with industrialization despite various reform efforts.”
- “Proposal for a shift towards high-skill services-led growth to stimulate manufacturing.”
- “Impact of unequal access to education on labor market outcomes and economic disparities.”
- “Importance of mass education and collective absorptive capacity for innovation and economic development.”
Examples and References:
- Periodic Labour Force Survey, 2021-22.
- Raghuram Rajan and Rohit Lamba’s book “Breaking the Mould: Reimagining India’s Economic Future”.
- Economic historian Joel Mokyr’s insights on the role of useful knowledge in economic development.
- Comparison between India and China’s approaches to rural entrepreneurship and industrialization.
Facts and Data:
- India’s manufacturing share in output and employment has been stagnant and below 20%.
- India’s trade deficit has been widening, largely driven by imported goods.
- Inequality in the service sector is higher compared to manufacturing.
- India is one of the world’s most unequal countries in terms of education.
Critical Analysis:
- The article presents a critical examination of India’s historical industrialization efforts and their limitations.
- It questions traditional approaches to industrial policy and offers a provocative alternative centered around high-skill services.
- The critique of inequality in the service sector and its implications for socio-economic disparities adds depth to the analysis.
- The cultural factors influencing India’s industrial stagnation provide valuable insights into the broader challenges faced by the country.
Way Forward:
- Emphasize the need for a comprehensive approach to economic development that addresses both industrialization and service sector growth.
- Invest in mass education and skills training to enhance collective absorptive capacity and promote innovation.
- Reevaluate cultural attitudes towards certain occupations to foster organic innovation in manufacturing.
- Ensure that economic policies prioritize reducing inequality and promoting inclusive growth.
Get an IAS/IPS ranker as your 1: 1 personal mentor for UPSC 2024
Attend Now