Mains Ready By December. Smash Mains & Smash PYQ Admissions Open

GS Paper: GS3-01.Indian Economy and issues relating to planning, mobilization of resources, growth, development and employment.

  • Economy is resilient, but risks remain

    Economy is resilient, but risks remain

    Why in the News

    The State of the Economy report, compiled by economists at the Reserve Bank of India (RBI), together with the finance ministry’s monthly economic review, has found that India’s underlying growth momentum held up through the first quarter of the financial year. Both readings point to firm household consumption, industrial output and credit growth even as global conditions stay unsettled. The outlook nonetheless remains clouded by continuing geopolitical and trade related uncertainty, volatile energy prices and a strengthening El Niño (a periodic warming of central and eastern Pacific Ocean waters that disrupts monsoon rainfall patterns), risks that could weigh on growth just as the National Statistics Office (NSO) prepares to release its first quarter Gross Domestic Product (GDP) estimate.

    What signals point to resilient domestic growth?

    1. Steady consumption indicators: E way bill generation has stayed firm, Goods and Services Tax (GST) revenues have remained healthy, and passenger vehicle, tractor and two wheeler sales have all been strong.
    2. Firm industrial output: The Index of Industrial Production (IIP), a measure of output across mining, manufacturing and electricity, rose 5.8 percent in the quarter, aided by the manufacturing sector, while electricity demand held steady.
    3. Corporate profitability and credit growth: Firms in both manufacturing and services reported improved operating profits, and bank credit has grown at a brisk pace across both industrial and retail lending.
    4. Monsoon recovery and exports: A recovery in the monsoon has supported kharif sowing, and exports excluding oil grew 12.8 percent in the first four months of the year, aided by the currency’s depreciation.
    5. Public capital spending: The Centre’s own expenditure grew by roughly 24 percent in the quarter, keeping public capital spending on track.

    What risks could weigh on this resilience?

    1. External uncertainty: Continuing geopolitical and trade related tensions, along with supply chain pressures, threaten to unsettle the momentum built up domestically.
    2. Volatile energy prices: Fluctuating global energy prices raise input costs across manufacturing and transport and feed inflation risk.
    3. A strengthening El Niño: A stronger El Niño could unsettle the rainfall gains that supported this quarter’s kharif sowing and rural demand.
    4. A cautious institutional tone: The finance ministry’s economic review itself notes that “recent years have been a time for hunkering down and battening down the hatches,” and expects coming years to be no exception.

    What does the growth trajectory imply for the GDP estimate?

    1. RBI’s own projection: At its August Monetary Policy Committee (MPC) meeting, the central bank projected 7 percent growth for the first quarter, a figure broadly matched by assessments from agencies such as Crisil and ICRA.
    2. The GDP release ahead: The National Statistics Office is set to release its first quarter GDP estimate shortly, with growth seen as likely to surprise on the upside even as the external environment continues to weigh on the outlook.

    Conclusion

    Domestic demand, industrial output and credit growth show the economy’s underlying momentum has held up, but persistent external risks, from trade tensions to volatile energy prices and a strengthening El Niño, mean policymakers cannot afford complacency. The National Statistics Office’s forthcoming GDP estimate will offer the first concrete test of whether this resilience is translating into headline growth, even as the external environment continues to demand a calibrated policy response.

    Back2Basics: What is the State of the Economy report?

    1. Publisher: It is a monthly assessment published in the Reserve Bank of India’s Bulletin, written by economists in the RBI’s Monetary Policy Department.
    2. Status: It carries a standard disclaimer that the views expressed are those of the authors and not necessarily those of the RBI.
    3. Purpose: It reviews high frequency indicators of growth, inflation and the external sector to assess the economy’s current momentum.

    [2021] “Explain the difference between computing methodology of India’s Gross Domestic Product(GDP) before the year 2015 and after the year 2015.”

  • PSU banks more efficient than private peers: EAC-PM

    PSU banks more efficient than private peers: EAC-PM

    Why in the News

    A paper by two economists for the Economic Advisory Council to the Prime Minister (EAC-PM), a body that advises the Prime Minister on economic policy questions, found that public sector banks (PSBs) are more efficient than private and foreign banks.

    Titled “Reforms, Efficiency, and Productivity of Indian Banking Sector in the Last Decade: DEA Approach”, the paper used Data Envelopment Analysis (DEA), a method that measures how far a unit could shrink its inputs while producing the same output, to compare 47 banks.

    What does the study find?

    1. PSBs improved significantly: During 2014-15 to 2025-26, PSBs recorded average efficiency of 88.53%, compared with 85.62% for private banks. Foreign banks led over the full period: Foreign banks had the highest 12-year average of 88.98%, but their efficiency declined from 95.86% in 2014-15. Most efficient banks:
    2. HSBC and JPMorgan Chase: 100% efficiency in all 12 years.
    3. HDFC Bank: 97.54% average efficiency among private banks.
    4. State Bank of India (SBI): 97.49%, highest among PSBs.
    5. DBS Bank India: Lowest single-year efficiency of 40.12% in 2021-22, linked to its merger with Lakshmi Vilas Bank.
    6. Impact of PSB mergers: PSBs were relatively less efficient than private banks during FY2019 to FY2022, partly due to the merger and rationalisation of branches, employees and business operations.

    Data Envelopment Analysis (DEA)

    1. DEA is a method for measuring the relative efficiency of units, here banks, that produce the same kind of output from different combinations of inputs.
    2. An efficiency score below 100% means the unit could reduce its inputs by that shortfall and still produce the same output. Eg. A score of 85% means the unit could cut inputs by 15% without any loss of output.

    “[2024] Consider the following statements:
    Statement-I: Syndicated lending spreads the risk of borrower default across multiple lenders.
    Statement-II: The syndicated loan can be a fixed amount/lump sum of funds, but cannot be a credit line.
    Which one of the following is correct in respect of the above statements?
    (a) Both Statement-I and Statement-II are correct and Statement-II explains Statement-I
    (b) Both Statement-I and Statement-II are correct, but Statement-II does not explain Statement-I
    (c) Statement-I is correct, but Statement-II is incorrect
    (d) Statement-I is incorrect, but Statement-II is correct

  • Rural India needs jobs, not wage guarantees

    Rural India needs jobs, not wage guarantees

    Why in the News

    An opinion piece argues that a new rural wage-guarantee scheme has recorded low uptake among the rural workforce, and contends this shows rural India needs durable, income-generating employment rather than a guaranteed-wage safety net. The scheme pays a guaranteed wage for a fixed number of days, which the piece contrasts with sectors such as food processing, renewable energy and small and medium enterprises (SMEs), which it argues could generate sustained employment rather than a temporary income floor. The tension is between a safety-net approach to rural distress and a growth-oriented approach that builds durable non-farm jobs.

    Why has the wage-guarantee scheme seen low uptake?

    1. Wage ceiling below market rates: Where the scheme’s guaranteed wage sits below prevailing local market wages for casual labour, workers have limited incentive to enrol, since informal market work pays more for the same effort.
    2. Seasonal mismatch: A fixed-day guarantee does not align well with the seasonal peaks in rural labour demand during sowing and harvest, when private demand for labour already absorbs much of the available workforce.

    What alternative does the piece propose?

    1. Food processing: Expanding food processing capacity near production zones can absorb rural labour in agro-processing roles that persist beyond a single season.
    2. Renewable energy: Rural solar and biomass energy projects can generate sustained local employment in installation, operation and maintenance roles.
    3. Small and medium enterprises: Supporting rural SMEs with credit and market access can create employment that grows with demand, rather than being capped at a fixed number of guaranteed days.

    Unemployment in India

    1. The International Labour Organization (ILO) defines an unemployed person as someone of working age, without work, currently available to work and actively seeking work in a reference period.
    2. India’s unemployment carries several distinct types: frictional, structural (a mismatch between workers’ skills and market demand), cyclical, seasonal, disguised (as in agriculture, where more people are employed than the work requires), and chronic.
    3. Over 90 percent of India’s workforce remains informal, which limits meaningful, secure job creation regardless of headline employment growth.
    4. Manufacturing contributes only about 16 to 18 percent of GDP, well below China’s roughly 26 percent, constraining the sector’s capacity to absorb surplus labour.

    Government Initiatives for Employment Generation

    1. Mahatma Gandhi National Rural Employment Guarantee Act (MGNREGA), 2005: Guarantees 100 days of rural wage employment a year to any adult member of a rural household, and is the specific scheme this op-ed’s wage-guarantee critique concerns.
    2. PM Vishwakarma: Provides collateral-free loans, skilling and toolkits to artisans across 18 traditional trades.
    3. PM Vishwakarma Rozgar Yojana / Employment Linked Incentive (ELI) scheme: Approved with an outlay of about 99,446 crore rupees, targeting 3.5 crore jobs over two years.
    4. e-Shram Portal: A national database that issues unorganised workers a Universal Account Number and links them to social security schemes.
    5. DAY-NRLM: Mobilises the rural poor into Self-Help Groups to build self-sustained livelihoods.

    Challenges in Unemployment

    1. Survey design undercounts informal and rural work: Household surveys do not fully capture home-based, gig or platform work within the roughly 90 percent informal workforce, and rural labour force surveys have historically run at a lower frequency than urban ones. Eg. Rural Periodic Labour Force Survey (PLFS) data was measured only annually for years, while urban data was collected quarterly, understating rural distress in real time. Fix. Move rural PLFS to the same quarterly frequency as urban surveys and explicitly incorporate underemployment into the headline definition.
    2. Capital-intensive growth limits absorption: Investment has flowed disproportionately toward information technology and infrastructure rather than labour-intensive sectors capable of absorbing low and semi-skilled workers. Eg. Services now drive the largest share of GDP growth while employing under 30 percent of the workforce, the jobless growth pattern this op-ed’s wage-guarantee critique responds to. Fix. Direct incentive schemes toward labour-intensive sectors such as textiles, leather, food processing and electronics assembly rather than capital-intensive ones alone.

    Conclusion

    The piece argues that a wage-guarantee scheme with low enrolment is evidence that rural India’s underlying problem is a shortage of durable jobs, not a shortage of a temporary income floor, and that policy should shift resources toward sectors capable of generating sustained rural employment.

    Back2Basics: Periodic Labour Force Survey (PLFS)

    1. The PLFS is India’s principal household survey for estimating employment and unemployment, conducted by the National Sample Survey Office (NSSO) under the Ministry of Statistics and Programme Implementation (MoSPI).
    2. It reports unemployment on three measures: Usual Status (activity over the preceding year), Current Weekly Status, and Current Daily Status, the last of which best captures underemployment.
    3. It has historically surveyed urban areas quarterly but rural areas only annually, a frequency gap that limits its ability to track rural distress as it develops.

    “[2023, GS3, 15 marks] Most of the unemployment in India is structural in nature. Examine the methodology adopted to compute unemployment in the country and suggest improvements.”

  • Fair pricing could help sustain UPI network

    Fair pricing could help sustain UPI network

    Why in the News

    The op-ed, by a NITI Aayog consultant, argues that the zero-Merchant Discount Rate (MDR) regime underpinning Unified Payments Interface (UPI)‘s free-to-use model is financially unsustainable, and proposes a differentiated pricing structure as the Department of Financial Services examines whether to restore MDR for high-threshold transactions or merchants. The piece is pegged to a Parliamentary Standing Committee on Finance report tabled this month, which cited an industry estimate of about Rs 20,700 crore in annual UPI operating costs against a Rs 2,000 crore government allocation under the zero-MDR regime.

    What is the fiscal problem with UPI’s current pricing model, and what does the op-ed propose?

    1. The cost-subsidy gap is large and quantified: The Parliamentary Standing Committee on Finance’s report cited industry estimates of roughly Rs 20,700 crore in annual UPI operating costs, against a government allocation of only Rs 2,000 crore under the zero-MDR regime, with banks and payment companies absorbing the balance.
    2. Two restructuring options are formally under examination: The Department of Financial Services is examining restoring MDR for certain high-threshold transactions or merchants, and separately, phasing out government support through a tiered incentive structure.
    3. The op-ed’s proposed principle is differentiated, not uniform, pricing: It argues for keeping UPI free for consumers and small merchants while allowing a capped MDR for larger commercial users and higher-value transactions, on the basis that a uniform rate would be negligible for a large retailer but consequential for a street vendor.
    4. The author’s own research links merchant ecosystem formalisation to UPI adoption: Citing research with Sharon Buteau, the op-ed states that more formalised merchant ecosystems are associated with higher UPI use, and that MDR design should be calibrated to where acceptance networks are still developing rather than applied uniformly.
    5. Aggregated payment data is proposed as a second, non-MDR revenue and policy tool: The op-ed cites PhonePe’s PulsePro and a recent MoU with the Ministry of Electronics and Information Technology (MeitY) to integrate UPI transaction metrics into PM GatiShakti for infrastructure and economic planning, arguing that privacy-safe aggregated payment signals have public value independent of any pricing decision.

    Conclusion

    The op-ed’s position is that UPI’s zero-MDR model has reached a fiscal limit documented by Parliament’s own Standing Committee, and that a threshold-based, differentiated MDR, protecting small merchants and consumers while pricing larger commercial transactions, is a more sustainable path than either continuing an unfunded subsidy or imposing a uniform fee that would slow onboarding in less-formalised markets.

    Back2Basics

    1. Merchant Discount Rate (MDR): The fee a merchant pays to their bank or payment service provider for accepting digital payments, historically waived to zero on UPI and RuPay debit card transactions in India since January 2020 to encourage adoption.
    2. Unified Payments Interface (UPI): A real-time payment system developed by the National Payments Corporation of India (NPCI) that enables instant interbank transactions through a single mobile application.

    “[2023, GS3, 10 marks] What is the status of digitalization in the Indian economy? Examine the problems faced in this regard and suggest improvements.”

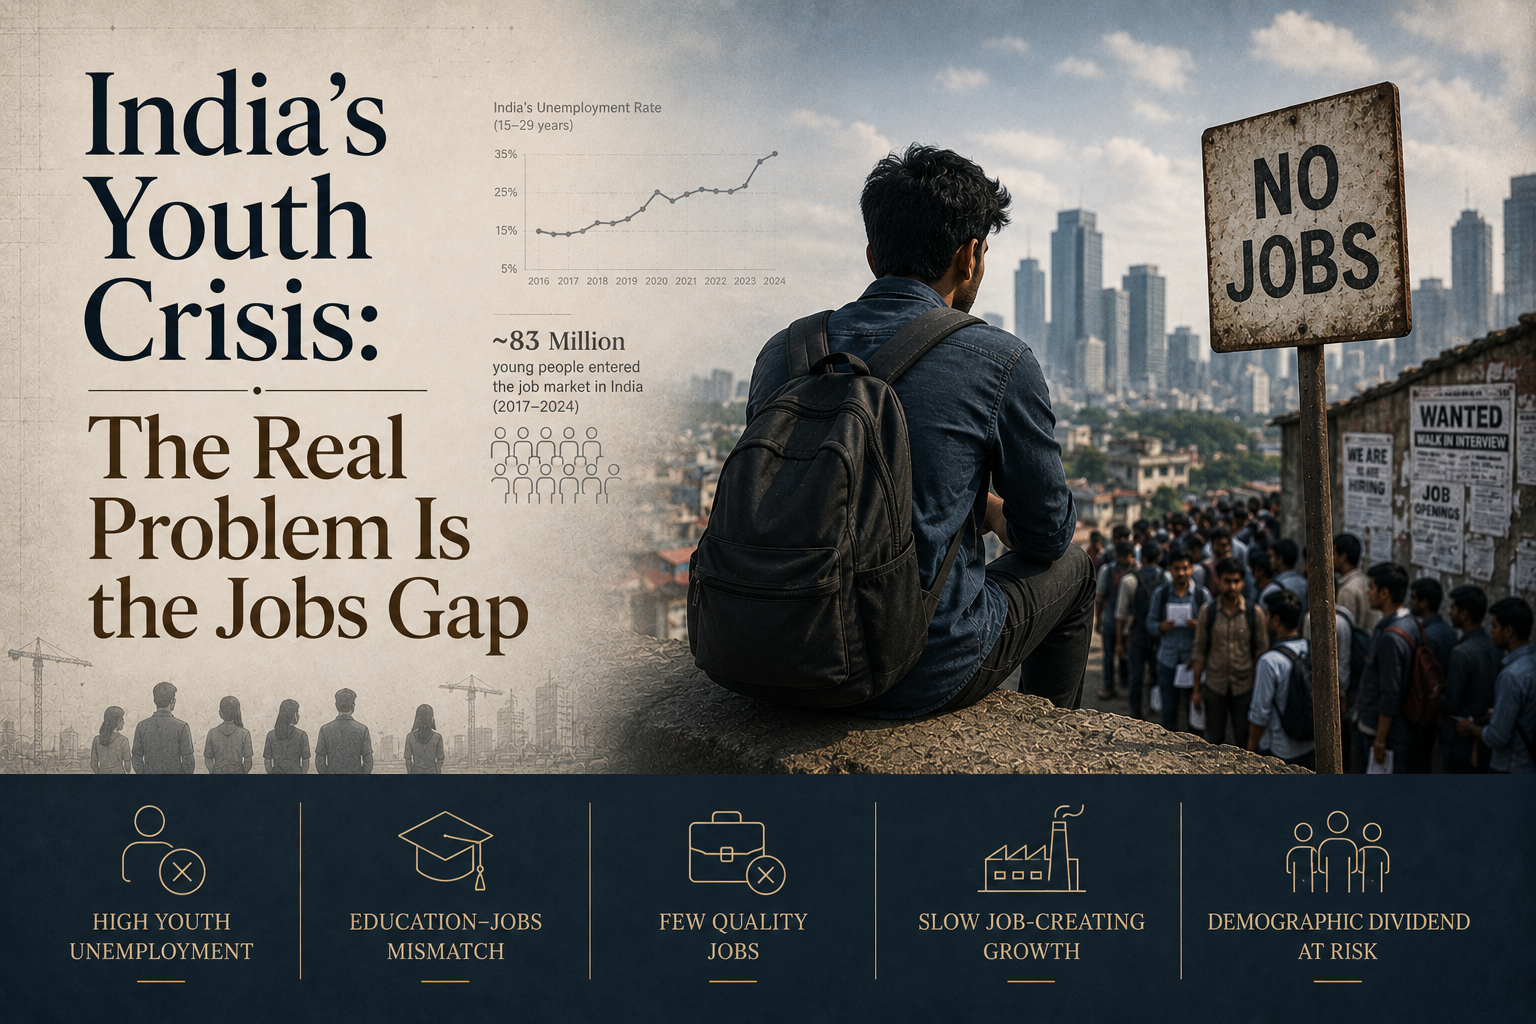
  • India’s youth crisis is about the absence of jobs, not just examination reform

    India’s youth crisis is about the absence of jobs, not just examination reform

    Question (2023, GS3): Most of the unemployment in India is structural in nature. Examine the methodology adopted to compute unemployment in the country and suggest improvements.
    Linkage: The editorial contends that youth agitations and demand for cheaper coaching address only the symptoms of the crisis, whereas the foundational issue is structural unemployment—the deep-seated absence of final job opportunities for qualified youths at the end of their preparation.

    Mentor comment

    The Hindu’s editorial argues that India’s youth unemployment problem is a jobs crisis, not merely an examination reform problem. The youth agitation that forced the resignation of the then Union Education Minister produced a government commitment to examination reform, including free online coaching for competitive examinations using India’s Digital Public Infrastructure. The editorial contends that cheaper coaching addresses only the preparation stage of the crisis, while the deeper problem is the absence of jobs at the end of that preparation.

    What does the data show about the scale of the crisis?

    1. Coaching costs have risen, not fallen: Private coaching now costs 16% of what an average Indian family spends on a child’s education, up from 12.5% in 2018. Nearly a quarter of that spending occurs during the higher secondary years, when students prepare for competitive examinations.
    2. Seat scarcity dwarfs coaching costs: Over 22 lakh candidates appeared for this year’s medical entrance examination for about 1.4 lakh undergraduate seats, with fewer than 10,000 of those seats at the top 50 colleges. The Joint Entrance Examination for engineering colleges shows a similar pattern.
    3. Undergraduate enrolment has fallen for the first time: For the first time since the All India Survey on Higher Education began in 2011, undergraduate enrolment fell by 93,322 in 2023-24, sharpest among young men.
    4. The fall is regionally concentrated: Uttar Pradesh recorded the steepest decline, with undergraduate enrolment down 1.53 lakh even as diploma enrolment rose 1.38 lakh, suggesting students are substituting away from degrees that do not lead to jobs.
    5. Formal, secure jobs remain rare among graduates: Periodic Labour Force Survey unit level data shows that of every 100 graduates aged 15 to 29 in 2025, only 26 held regular salaried employment, and only four held a salaried job with both a contract and social security.

    Why has growth not translated into jobs?

    1. Manufacturing has not absorbed graduates: Manufacturing, the sector best placed to absorb India’s college graduates, remains at around a sixth of gross value added, well short of the quarter of the economy the government has long promised.
    2. Private investment has retreated: Corporate investment fell from 17.3% of GDP in 2007-08 to 10.3% in 2024-25, unmoved by the cut in the corporate tax rate from 30% to 22% in 2019.
    3. Regulatory enforcement has turned selective: The editorial states that a regulatory and enforcement zeal that selectively targets enterprises has disproportionately affected medium sized companies, the segment best placed to generate jobs.

    Conclusion

    The youth employment crisis has two distinct ends: preparation for jobs, and the jobs themselves. Free coaching addresses only the first. The editorial’s position is that public investment in industrial capacity, export-disciplined industrial support, and a less selective regulatory posture toward medium sized enterprises would do more for youth employment than examination reform alone, citing Vietnam as a comparator that has used this route.

  • The fact is youth unemployment has a household cost

    Why in the News

    Periodic Labour Force Survey (PLFS) 2025 data records youth unemployment at 14.8 percent and a Not in Employment, Education or Training (NEET) rate of 40.1 percent among the tertiary-educated, and the argument advanced from this data is that graduate joblessness is a household-level economic cost, not only an individual setback. A young person’s inability to find work does not only reduce that person’s own income, it removes an income the household had budgeted around, often after the household had itself financed the degree that produced no job.

    What is the household cost, distinct from the individual one?

    1. Sunk cost of financing the degree: Households that borrow or spend savings to fund a graduate’s education absorb that cost with no return if the graduate cannot find matching work, a loss the individual unemployment rate does not price in.
    2. Deferred contribution to household income: A household budgets around the expectation that an educated young adult will begin contributing income at a certain age; unemployment past that age forces the household to keep supporting a wage-earner it had expected to become a net contributor.
    3. Compounding effect on savings for other dependants: Money a household would have redirected toward a younger sibling’s education, a parent’s healthcare, or retirement savings instead continues to support an unemployed graduate.
    4. Psychological and bargaining costs within the household: Prolonged dependence on parents past the expected age of self-sufficiency affects a young adult’s standing and decision-making power within the household, a dimension PLFS-style employment data cannot itself measure but that the 40.1 percent NEET rate among the tertiary-educated makes newly visible.

    How does the tertiary-educated NEET rate compare with the general NEET pattern?

    1. Tertiary-educated NEET rate far exceeds the general rate: At 40.1 percent, the NEET rate among India’s tertiary-educated youth is markedly higher than the NEET rate among youth without a degree, inverting the usual expectation that more education reduces the risk of disengagement from work.
    2. Concentration in urban, aspirational households: The households most likely to have financed a tertiary degree, and to therefore carry the sunk cost described above, are disproportionately urban and lower-middle income, the segment for whom a graduate’s income was budgeted as a route out of that bracket.

    Conclusion

    Youth unemployment at 14.8 percent and a 40.1 percent NEET rate among the tertiary-educated do not describe an individual labour market outcome alone. They describe a household that financed an investment in education and is not yet receiving the income return it planned around, a cost that persists in household budgets even where it does not appear in an individual’s own unemployment statistic.

    Youth unemployment in India

    1. About: Youth unemployment measures joblessness among the working-age population, typically 15 to 29 years, whose job search outcomes diverge sharply from the adult labour force.
    2. Rationale for tracking it separately: Youth unemployment behaves differently from the aggregate rate because young workers are more likely to be first-time job seekers with no accumulated informal-sector fallback, so a downturn hits them earliest and hardest.
    3. Recognised typology: Unemployment among India’s youth spans frictional joblessness during the transition from education to work, structural joblessness from a skills mismatch, and disguised underemployment in low-productivity family enterprises and agriculture.
    4. Jobless growth in services: Services drive the largest share of GDP growth but employ under 30 percent of the workforce, limiting the sector’s capacity to absorb new entrants.
    5. Skill deficit at graduation: Only about half of India’s graduates are assessed as readily employable, per employability surveys, pointing to a curriculum gap rather than a shortage of degree holders.
    6. Weak manufacturing absorption: Manufacturing contributes only 16 to 18 percent of GDP, well below the roughly 26 percent contribution in China, limiting the formal, labour-intensive job creation India’s youth bulge needs.
    7. Informality as the default outcome: Over 90 percent of India’s workforce remains informal, so even youth who do find work often find it without security, benefits, or a written contract.
    8. Female youth workforce deficit: Caregiving duties, domestic responsibilities, and mobility constraints keep young women out of paid employment at a much higher rate than young men.

    Challenges in addressing youth unemployment

    1. Survey methodology undercounts informal and gig work: PLFS-style surveys do not fully capture home-based, gig, or platform work within India’s overwhelmingly informal workforce. Eg. Platform-based delivery and ride-hailing work is not consistently classified in the survey’s job categories. Fix. Update survey instruments to explicitly capture gig, platform, and digital work categories, aligned with International Labour Organization and System of National Accounts definitions.
    2. Low-frequency rural data delays policy response: Rural employment data has historically been measured only annually, compared with quarterly urban estimates, masking rural distress in real time. Eg. A poor monsoon’s effect on rural non-farm employment often does not show up in national data until the following year’s release. Fix. Extend the quarterly PLFS survey design to rural areas at the same frequency as urban areas.
    3. Capital-intensive investment bias: Investment continues to flow toward capital-intensive sectors such as information technology and infrastructure rather than the labour-intensive sectors that absorb semi-skilled youth. Eg. Automation in manufacturing has reduced the labour intensity of new capacity even as output has grown. Fix. Direct production-linked incentives toward labour-intensive sectors such as textiles, leather, and food processing, alongside the existing electronics-focused schemes.
    4. Demographic dividend at risk of becoming a demographic trap: A youth bulge that cannot find work stops being an economic asset and starts becoming a fiscal and social liability as the cohort ages without having built savings or skills. Eg. State of Working India 2026 estimates 9.2 crore youth in the NEET category nationally. Fix. Expand the government’s employment-linked incentive schemes and apprenticeship mandates specifically targeted at the 21 to 29 age cohort.
    5. Weak coordination across employment data systems: Employees’ Provident Fund Organisation payroll data, the National Career Service portal, and PLFS survey data are not integrated, making it hard to track whether a given policy intervention is actually creating net new jobs. Eg. The Employment Linked Incentive scheme announced in 2025 tracks payroll additions but not whether they represent new jobs or reclassified existing ones. Fix. Build a single integrated employment data dashboard drawing on EPFO, NCS and PLFS data for real-time tracking.

    Back2Basics: NEET (Not in Employment, Education or Training)

    1. An internationally used labour-market indicator that counts young people who are neither working, studying, nor undergoing any training, distinct from the unemployment rate, which only counts those actively seeking work.
    2. Captures discouraged job seekers and those who have withdrawn from the labour force entirely, a population the standard unemployment rate does not measure.
    3. The State of Working India 2026 report estimates roughly 9.2 crore Indian youth in this category.

    Matching Previous Year Question

    “[2023, GS3, 15 marks] Most of the unemployment in India is structural in nature. Examine the methodology adopted to compute unemployment in the country and suggest improvements.”

  • The other ‘NEET’ that India needs to address

    Why in the News

    Fresh Periodic Labour Force Survey (PLFS) data on the Usual Employment and Unemployment Rate shows nearly 40 percent of Indian graduates aged 25 are unemployed, alongside an estimated 9.2 crore Indian youth falling into the Not in Employment, Education or Training (NEET) category. The State of Working India 2026 report situates this alongside India’s demographic dividend, the working-age population bulge the country has counted on as a growth advantage. A youth cohort large enough to drive growth is instead showing a graduate unemployment rate high enough to raise doubts about whether that dividend is being converted into productive work.

    What does the NEET measure capture that the unemployment rate does not?

    1. NEET counts withdrawal, not just joblessness: The unemployment rate only counts people actively seeking work; NEET (Not in Employment, Education or Training) also captures young people who have stopped searching or never entered education or the labour force, a group the standard unemployment rate misses entirely.
    2. 9.2 crore youth estimated in the NEET category: The State of Working India 2026 report’s estimate of 9.2 crore places the scale of youth disengagement well above what headline unemployment figures alone would suggest.
    3. Graduate unemployment concentrated among the young: Nearly 40 percent of 25-year-old graduates are unemployed, a rate far higher than unemployment among the working-age population as a whole, showing that a degree has not translated into a job for this cohort at the pace the labour market absorbs less-educated job seekers.
    4. Gender skew within the NEET population: Young women make up a disproportionate share of the NEET category, reflecting caregiving responsibilities and mobility constraints that keep them out of both education and paid work even when jobs exist locally.

    Why does graduate unemployment run higher than overall unemployment?

    1. Skill mismatch between degrees and job requirements: Employers report that a large share of graduates are not employable in the roles the formal sector is creating, because curricula have not kept pace with industry requirements.
    2. Weak absorption capacity in manufacturing: Manufacturing’s share of GDP has stayed well below the level needed to absorb a growing pool of educated job seekers into formal, better-paid work, pushing graduates toward informal or underemployed roles instead.
    3. Aspirational mismatch with available jobs: A graduate degree raises the reservation wage and the kind of work a job seeker will accept, so graduates wait longer for a suitable formal-sector opening rather than take the informal work a non-graduate would accept immediately.
    4. Delayed labour market entry compounds the count: Prolonged job searches by graduates keep them in the unemployed count for longer than less-educated job seekers, who exit into informal work faster even at lower wages.

    Conclusion

    The NEET count of 9.2 crore and the near-40 percent graduate unemployment rate among 25-year-olds point to a mismatch between what India’s education system produces and what its labour market currently absorbs. Closing that gap over the remaining years of India’s demographic dividend, rather than after it starts to narrow, is the reform window the data points to.

    Back2Basics: Periodic Labour Force Survey

    1. Conducted by the National Sample Survey Office (NSSO) under the Ministry of Statistics and Programme Implementation, the principal source of employment and unemployment data in India.
    2. Uses the Usual Status approach, based on a person’s activity over the preceding 365 days, alongside the Current Weekly Status approach for more recent snapshots.
    3. Was redesigned to provide quarterly urban estimates in addition to the earlier annual survey, though rural high-frequency coverage remains thinner.
    4. Feeds the official Unemployment Rate and Worker Population Ratio figures cited in Parliament and used for policy design.

    Matching Previous Year Question

    “[2023, GS3, 15 marks] Most of the unemployment in India is structural in nature. Examine the methodology adopted to compute unemployment in the country and suggest improvements.”

  • Triple test, adrift

    Why in the News

    On 20 August 2026, a nine judge Bench of the Supreme Court of India delivered a judgment on the correctness of the ruling in Bangalore Water Supply and Sewerage Board vs A. Rajappa (1978). That 1978 judgment laid down the “Triple Test” for what counts as an “industry” under Section 2(j) of the Industrial Disputes Act, 1947. The present Bench left the Triple Test standing for all pending disputes under the older Act. A majority of the same Bench also ruled that the 1978 judgment will not be a “sheet anchor” for interpreting Section 2(p) of the Industrial Relations Code, 2020. The tension is that Section 2(p) itself reproduces much of the Triple Test’s essence, so an interpretive framework has been severed from a provision that continues to embody it.

    What is the “Triple Test” on what counts as an “industry”?

    1. The three conditions: An activity qualifies as an industry where three conditions are met together: a systematic activity, employer-employee cooperation, and production or distribution of goods and services to satisfy human wants other than those that are purely religious or spiritual.
    2. Profit is irrelevant: Profit motive plays no part in the determination. What matters is the nature of the activity itself, so a loss making or non-commercial body can still be an industry.
    3. The single exclusion: Only “sovereign functions” stand outside the definition, which is a narrow carve out rather than a general exemption for the State.

    How did the reference reach a nine judge Bench?

    1. The origin: The Triple Test was laid down in the 1978 judgment, which read Section 2(j) of the Industrial Disputes Act, 1947 expansively.
    2. The doubt: A five judge Bench in State of U.P. vs Jai Bir Singh (2005) raised a doubt about that definition.
    3. The escalation: A seven judge Bench then sent the question to the current nine judge Bench.
    4. The statute changed while the reference was pending: The Industrial Disputes Act, 1947 was repealed on 21 November 2025, when the Industrial Relations Code, 2020 came into force.
    5. The Bench therefore faced two statutes: It had to decide the status of the Triple Test both for disputes still pending under the repealed Act and for interpretation of the successor provision, which is why the ruling splits along those two lines.

    What did the majority and the dissent hold?

    1. Pending disputes are unaffected: The Bench, led by the Chief Justice of India, left the Triple Test standing for all pending disputes under the older Industrial Disputes Act, 1947.
    2. The anchor was removed for the new Code: A majority of the nine judge Bench ruled that the 1978 judgment will not be a “sheet anchor” for interpreting Section 2(p) of the Industrial Relations Code, 2020.
    3. The dissent went further than disagreement: The dissenting opinion held that the reference itself was unnecessary and that the Triple Test requires no interference at all.
    4. The dissent was not isolated: That view was shared by three other judges on the Bench, so the split on the reference question was narrow rather than lopsided.

    Why does an expansive definition of “industry” matter more now than in 1978?

    1. The workforce has moved: Since 1978, and particularly after the liberalisation and privatisation reforms of 1991, a far higher number of workers have moved to the private sector, out of the security of public employment.
    2. Security no longer comes from the employer: For a worker outside public employment, statutory coverage rather than employment status is what provides protection.
    3. Definition decides access: Whether an establishment is an “industry” determines whether its workers can raise an industrial dispute at all, so the definition is the gateway to every protection that follows.
    4. Most of the workforce is outside formal protection: About 90 per cent of India’s workforce is informal, and nearly 58 per cent of salaried workers still lack a written contract.
    5. The expansive reading is therefore a bulwark: An expansive definition of industry is more necessary now than it was in 1978, precisely because the cushion of public employment has shrunk.

    Was the Triple Test a pro-labour device or a framework for industrial peace?

    1. It was not merely pro-labour: The Triple Test was not only a device for extending worker protection, though it is usually described that way.
    2. It brought restrictions with it: An expansive definition of industry brought with it not just the protections of the Industrial Disputes Act, 1947 but also its restrictions.
    3. The employer gained a defined route: It gave employers a regulated route to retrenchment and closure, rather than leaving those decisions to be contested without a framework.
    4. Workers accepted a limit in return: It carried a bar on workers striking at will, so the coverage came with a procedural discipline on industrial action.
    5. The net effect was industrial peace: In essence the Triple Test allowed for industrial peace rather than worker welfare alone, which is what makes its removal a loss to both sides rather than to one.

    Why is setting the 1978 judgment aside difficult to justify?

    1. The successor provision did not change the test: Section 2(p) of the Industrial Relations Code, 2020 does not move away from the Triple Test formula and reproduces much of its essence.
    2. The reasoning does not follow: It is therefore difficult to understand why the 1978 judgment has to be set aside when Section 2(p) itself comes up for interpretation.
    3. A framework, not just a precedent, was cut away: Severing that principle from the Code cuts away the interpretive framework that allowed such disputes to be resolved at all.
    4. Two footings now coexist: Pending disputes under the repealed Act will be decided on the Triple Test, and disputes under the Code will be decided without it as an anchor, on a definition that says much the same thing.
    5. The burden shifts to the lower courts: It is now incumbent upon courts and tribunals to ensure that a change of statute is not read as a change of intent, and they must do so with the anchor removed.

    Challenges to the definition of “industry” under the Industrial Relations Code, 2020

    1. Litigation will restart from zero: With the 1978 judgment displaced as the anchor, every category of establishment settled over four decades becomes arguable again. Eg. Hospitals, educational institutions and charitable bodies were brought within the definition on the strength of that judgment. Fix. Insert a statutory explanation to Section 2(p) listing the categories expressly included and excluded, so the question is settled by text rather than by fresh litigation.
    2. The “sovereign functions” exclusion has no statutory boundary: The carve out is judicially defined, so its width expands or contracts with each ruling rather than by legislative choice. Eg. Municipal and public utility bodies performing statutory duties have repeatedly contested their status as industries. Fix. Define sovereign functions in the Code by reference to a listed set of constitutional functions.
    3. Threshold changes shrink the protected group: Raising the retrenchment and closure approval threshold reduces how many workers the framework covers regardless of how “industry” is defined. Eg. The Industrial Relations Code, 2020 raises the closure and retrenchment threshold from 100 to 300 workers. Fix. Pair the higher threshold with a statutory retrenchment compensation escalator and a funded reskilling entitlement.
    4. Platform and contract work sits outside the frame: The employer-employee cooperation limb assumes an identifiable employer, which app-mediated and multi-layered contract work does not supply. Eg. Aggregator platforms classify workers as partners rather than employees, which places them outside the industrial dispute route. Fix. Deem an aggregator to be the principal employer for the purpose of dispute resolution where it controls pricing and task allocation.
    5. Two parallel regimes will run for years: Pending disputes under the repealed Act and new disputes under the Code will be decided on different interpretive footings for as long as the backlog lasts. Eg. Industrial disputes routinely take a decade or more to reach final decision. Fix. Issue a transitional provision directing that Section 2(p) be construed consistently with the settled position under Section 2(j) for a stated period.
    6. Tribunal capacity has not been strengthened: A framework that shifts interpretive burden to tribunals fails where those tribunals are understaffed and slow. Eg. Industrial tribunals and labour courts carry long standing vacancies alongside a large pending case load. Fix. Fill sanctioned tribunal posts on a fixed calendar and publish disposal timelines for industrial dispute references.

    Conclusion

    The nine judge Bench preserved the Triple Test where it no longer decides much and removed it where it would have decided most. The relationship between the successor provision and the test, set out above, is what makes that split hard to defend. The dissenting view, that the reference was unnecessary and the test required no interference, is the more coherent reading of a workforce that has moved into private employment since 1978 and needs an expansive definition more, not less. It now falls to courts and tribunals to ensure that a change of statute is not read as a change of intent, without the anchor that would have made that straightforward.

    “[2024, GS3, 15 marks] Discuss the merits and demerits of the four ‘Labour Codes’ in the context of labour market reforms in India. What has been the progress so far in this regard?”


  • Chipflation: Electronics see years of price hikes replicated in 6 mths

    Why in the News

    Consumer Price Index (CPI) data from the Ministry of Statistics and Programme Implementation (MoSPI) shows prices of a range of consumer electronics goods in July 2026 up 3 to 5 per cent against January 2026. The global artificial intelligence (AI) investment boom has created an acute shortage of the memory chips used in the manufacture of everyday consumer electronics. Manufacturers have raised the rates they charge to the point where price increases that took years for products such as smartphones and televisions have occurred in just six months of 2026. The movement in 2025 was far more sedate over the identical January to July window. The shortage runs in the opposite direction to the decades-long decline in memory chip prices that made consumer electronics steadily cheaper.

    What is chipflation?

    1. The term and its origin: Analysts at the American investment bank Morgan Stanley coined the term in June 2026. It describes how AI’s appetite for memory chips is boosting the cost of everything from data centres to smartphones, with consequences that may reach far beyond the technology industry.
    2. The chip at the centre of it: DRAM, or Dynamic Random Access Memory, is the working memory used in refrigerators, washing machines, air conditioners, smartphones, laptops, televisions and earphones. It is being displaced in fabrication capacity by the more advanced chips data centres demand.
    3. How a chip shortage becomes a retail price: Manufacturers facing a supply shortage of an essential component raise the rates they charge. Those increases pass into the retail price indices that MoSPI compiles.

    How much have Indian consumer electronics prices actually moved?

    1. The headline movement: Prices of a variety of consumer electronics goods in July 2026 were up 3 to 5 per cent against January 2026. The comparable movement over January to July 2025 was far smaller.
    2. Mobile handsets: The CPI price index for mobile handsets rose 4 per cent from January 2026 to July 2026. Over the same months of 2025 it declined by 0.7 per cent.
    3. Air conditioners: Air conditioner prices rose 4.8 per cent between January and July 2026 against 1.1 per cent over the same period of 2025. Air conditioners normally do see higher prices in the summer months.
    4. Televisions and the four-and-a-half year comparison: The CPI index of televisions is up 3.5 per cent since January 2026. Counting back from December 2025, matching that magnitude of increase took 54 months.
    5. The same comparison across five more categories: The number of months needed to match the 2026 increase was 46 for air conditioners, 45 for refrigerators and 41 for mobile phones. It was 32 for washing machines and 31 for computers and laptops.
    6. The series break behind the comparison: Increases over 2026 are calculated on the new CPI series with 2024 as the base year, and the earlier period on the old series with 2012 as the base year. Only consumer electronic items present in both baskets have been compared.

    Why has an AI investment boom raised the price of a refrigerator?

    1. Capacity has been redirected: Key chipmakers including TSMC, Samsung and SK Hynix are making the more in-demand advanced chips used in data centres. Those data centres are being built across the world at speed.
    2. What is being sacrificed: DRAM and other chips used in everyday electronics goods are what that redirection displaces. The result is a supply shortage of the chips essential to consumer electronics.
    3. Capacity cannot be added quickly: New memory capacity takes years to build, qualify and ramp up. Supply relief is a process rather than a switch, in the assessment of the Head of Morgan Stanley’s Europe and Asia Technology Team.
    4. A two-tier market has formed: Large AI and cloud buyers can sign long-term agreements, prepay and secure priority access to output. Traditional buyers, including personal computer makers, smartphone makers and industrial hardware companies, must compete for what remains.
    5. The scale of the projected shortfall: The shortfall in memory chips in 2027 is equivalent to what is needed to make 134 million phones. That estimate comes from the same Morgan Stanley technology team.

    Why is this a reversal rather than an ordinary price cycle?

    1. The historical direction of travel: DRAM prices fell 90 per cent every five years over the second half of the twentieth century and the first twenty or so years of the twenty-first. Falling component costs are what made each generation of consumer electronics cheaper than the last.
    2. What drove that decline: The fall was driven by Moore’s Law, the observation that the number of transistors on a chip doubles at regular intervals, so cost per unit of computing capacity falls steadily. Manufacturing scale converted that into lower prices for finished goods.
    3. The size of the reversal: DRAM prices will have risen more than 400 per cent from the start of 2024 to the end of 2026, on the estimate of JPMorgan Global Research. That is a price path with no precedent in the preceding five decades.
    4. Why the reversal is structural rather than seasonal: The demand shifting capacity is investment in AI data centre buildout, not a cyclical swing in consumer demand. It persists for as long as that buildout continues.

    What has the price rise done to demand?

    1. Global shipments have fallen: Global smartphone exports were down 11 per cent in the April to June quarter of 2026. That is their second-lowest level since 2013, on Counterpoint Research data.
    2. Indian sales have turned: Smartphone sales in India fell for three weeks in a row after the online promotional events of July 2026. The fall followed rather than preceded the promotional window.
    3. Consumers have become promotion-dependent: Rising device prices are making consumers increasingly value-conscious and more dependent on promotional offers, in the assessment of a Senior Analyst at Counterpoint Research. That trend has become more visible over the past few months.
    4. The pass-through is not optional for buyers: Memory is a non-substitutable component in every one of the affected categories. A household deferring a purchase is the only demand-side response available.

    Challenges to containing chipflation in India

    1. Import dependence in memory: India assembles consumer electronics without domestic fabrication capacity in memory chips, so the input price is set entirely offshore. Eg. Domestic smartphone assemblers competing for residual DRAM supply have no alternative source. Fix. Sequence the Semicon India Programme toward a memory fabrication line rather than only packaging and testing units.
    2. The measurement gap in a series break: Comparing 2026 movements against earlier years requires bridging two CPI series with different base years and baskets. Eg. Only items present in both the 2012-base and 2024-base baskets could be compared for this exercise. Fix. Publish an official back-cast series on the 2024 base so long-run comparisons do not depend on ad hoc bridging.
    3. Imported inflation escapes domestic policy tools: Interest rate changes cannot address a price rise originating in a global component shortage. Eg. Core inflation excluding food and energy is the segment monetary policy influences, and this shock sits inside it. Fix. Use tariff and input duty rationalisation on electronic components as the responsive instrument in place of rate action.
    4. Concentration among a handful of suppliers: A small group of firms controls advanced memory output, which gives buyers no bargaining position. Eg. TSMC, Samsung and SK Hynix set the allocation between data centre chips and consumer memory. Fix. Build long-term supply agreements through government-to-government channels, as the four-day commerce ministry delegation to Japan on semiconductors is designed to do.
    5. Downstream employment exposure: Falling handset volumes hit assembly and retail employment before they hit manufacturer margins. Eg. Three consecutive weeks of falling Indian smartphone sales followed the July promotional events. Fix. Link production-linked incentive disbursement to sustained volume rather than to value alone, so assemblers are not penalised for a component price shock.

    Conclusion

    An investment boom in one segment of the chip industry has reset the price of an input that every consumer electronics category depends on, and Indian retail price data has registered the effect within six months. Increases that historically took between 31 and 54 months have occurred since January 2026 across six product categories. Capacity for memory chips takes years to build and qualify, so the shortage does not resolve on a policy timetable. Demand has already turned in both global shipments and Indian sales, and the next test is whether volumes recover once the 2027 shortfall estimate is either met or confirmed.

    “[2021] With reference to the Indian economy, demand-pull inflation can be caused or increased by which of the following:

    1.Expansionary policies

    2.Fiscal stimulus

    3.Inflation-indexing of wages

    4.Higher purchasing power

    5.Rising interest rates

    Select the correct answer using the code given below:

    (a) 1, 2, and 4 only

    (b) 3, 4, and 5 only

    (c) 1, 2, 3, and 5 only

    (d) 1, 2, 3, 4, and 5

  • Measuring manufacturing growth afresh: Three questions

    Why in the News

    The new Gross Domestic Product (GDP) series of the Ministry of Statistics and Programme Implementation (MoSPI) shows the manufacturing Gross Value Added (GVA) deflator recording negative growth for nine consecutive quarters between 2023 and 2025. The same series places the level of real manufacturing GVA in 2025-26 at no less than 15 percentage points above the Index of Industrial Production (IIP) for manufacturing. When the new series was announced, the Chief Economic Advisor and the Secretary, MoSPI stated that the estimates rested on a new methodology. That methodology was said to have solved the measurement problems that had bedevilled the old series, including in manufacturing. MoSPI has not yet released the detailed standard document explaining the new calculations. Three specific anomalies in the manufacturing numbers therefore cannot be tested against the stated method, and the plausibility of the series has to be assessed from the numbers themselves.

    What is the manufacturing Gross Value Added deflator?

    1. Gross Value Added, defined: GVA for a sector is the value of its output minus the value of its intermediate inputs. It measures what producers in that sector actually added, before taxes on products are added and subsidies subtracted.
    2. What the deflator does: The sector deflator is the price index that converts nominal GVA at current prices into real GVA at base year prices. Real GVA equals nominal GVA divided by that deflator.
    3. What its movement signals: A deflator growing negatively means the sector’s own price level is falling. Real growth then runs ahead of nominal growth by the size of that fall.

    Why does confidence in manufacturing data matter now?

    1. The China Squeeze: The Chinese manufacturing export machine has again moved across world markets and threatens lower-skill manufacturing in poorer countries. The pressure this creates on Indian producers is what the data is being asked to measure.
    2. Two decades of stated ambition: The Union government set major ambitions for the sector, beginning with the flagship Make in India programme in 2014. The production-linked incentive (PLI) scheme followed several years later.
    3. The PLI’s dual purpose: The scheme was in part a response to the opportunities opened by the China-plus-one shift in global sourcing. It was also a response to the challenge of aggressive Chinese competition.
    4. Conflicting signals elsewhere: The wider economy is sending contradictory signals at present. Understanding manufacturing performance is the route to lifting some of that confusion.
    5. A recognised prior problem: Problems in manufacturing sector data under the previous series were widely recognised. MoSPI made strenuous efforts to address them in the new series.

    Why has the manufacturing deflator shown falling prices for nine straight quarters?

    1. The anomaly itself: The manufacturing GVA deflator records negative growth, meaning falling price levels, for nine consecutive quarters between 2023 and 2025. No comparable stretch of deflation appears anywhere else in the price data for that period.
    2. The core inflation test: The core Consumer Price Index (CPI), which excludes food and energy-related products, shows no sign of deflation across those quarters. Core CPI through December 2025 rests on the 2011-12 series and the March 2026 reading on the 2024 series.
    3. The wholesale price defence, and its limit: The wholesale price index (WPI) was negative for some of this period. It was not negative for nine consecutive quarters.
    4. Why WPI is the wrong benchmark anyway: The GVA deflator should not move in line with the WPI. The WPI is overly driven by input prices, and a value added deflator must reflect output prices net of inputs.

    Why is real GVA growth almost twice IIP growth?

    1. The size of the gap: In 2025-26 the level of real manufacturing GVA exceeded the IIP by no less than 15 percentage points. Both series are measured on the 2022-23 base.
    2. The growth gap it implies: Annual average real growth of manufacturing between 2022-23 and 2025-26 measured by GVA is about twice that measured by the IIP. The two figures are about 11 per cent against about 6 per cent.
    3. The informal sector explanation, and why it fails: Real GVA includes the informal sector and the IIP excludes it, so faster informal growth could in principle open a gap. For the most recent two years informal sector performance has been proxied by formal sector data, which makes the explanation mechanically impossible.
    4. The volumes versus value added explanation: The IIP measures output volumes rather than value added. A widely held perception holds that real GVA can grow faster than real output when input prices fall.
    5. Why that perception is wrong: Real GVA is calculated at constant prices, not at changing prices, so falling input prices cannot lift it. Real value added can grow faster than output volumes only where productivity improves, that is where firms become more efficient in using intermediate inputs.

    Why has the link between the two series broken down?

    1. The pre-2011 benchmark: Before the 2011-12 methodology changes, GVA and IIP moved closely together. The correlation between their growth rates over June 2005 to that break was 0.8.
    2. The post-2011 divergence: The two series diverged after the 2011-12 methodology changes. That divergence has been exacerbated in the new series rather than corrected by it.
    3. The recent segment: Since September 2022 the two series move very differently. The comparison excludes the Covid quarters from June 2020 to March 2022.
    4. The character of the difference: The real GVA series bounces around a great deal across quarters. The IIP series over the same stretch is fairly stable.

    What do the three questions together say about the new series?

    1. None is individually decisive: No one of the three issues is dispositive about the quality of the new series. Each is an unexplained pattern rather than a demonstrated error.
    2. The missing document is the binding constraint: The detailed standard document explaining the new calculations has not been released. Independent researchers therefore cannot check the anomalies against the method that produced them.
    3. The methodology claim raises the bar, it does not lower it: The new series was presented as the fix for exactly the manufacturing measurement problems of the old series. Anomalies concentrated in manufacturing are the hardest place for that claim to sit unexplained.
    4. What plausible explanations would buy: Explanations would engender confidence in the new GDP figures. They would also allow an assessment of the state of Indian manufacturing and of the impact of recent government actions to revive it.

    Challenges to the new GDP series’ manufacturing estimates

    1. Deflator choice drives the real number: Real GDP requires choosing a deflator, and the production side deflator is heavily influenced by the WPI. Eg. In FY23 a global commodity price surge pushed the WPI into double digits, and the high deflator suppressed measured real growth. Fix. Complete the WPI base revision so the deflator basket reflects the current price structure.
    2. No producer price index exists: India deflates goods sectors with a wholesale index built for trade flows rather than for producer output. Eg. Services sectors are deflated using CPI components because no dedicated producer price series covers them. Fix. Introduce a Producer Price Index on the model used across advanced statistical systems and retire WPI-based deflation.
    3. Transparency lags the release: The estimates reach the public well before the sources and methods behind them. Eg. The new series arrived with a stated methodology claim and without the standard explanatory document. Fix. Publish the sources and methods volume alongside the series so verification is concurrent with release.
    4. Informal output is still partly extrapolated: Informal sector performance for recent years is proxied from formal sector data, which cannot capture divergence between the two. Eg. The old series extrapolated large-company filings to the whole informal economy and stayed blind to the sharper hit small firms took after demonetisation. Fix. Shorten the lag on the Annual Survey of Unincorporated Sector Enterprises so proxying is not required for two full years.
    5. Statistical independence has been questioned: Resignations from the National Statistical Commission and withheld survey results have raised concerns about the autonomy of official statistics. Eg. Two members of the Commission resigned in 2019 over the handling of employment data. Fix. Constitute an independent statistical commission with a statutory mandate, as recommended by the Rangarajan Commission in 2001.

    Conclusion

    The new GDP series was presented as the answer to the manufacturing measurement problems of the old one, and its manufacturing numbers now carry three patterns that the stated methodology does not obviously produce. A deflator falling for nine quarters, a 15 percentage point level gap against the IIP and a correlation that has weakened since 2005-2012 are each testable claims that cannot be tested without the sources and methods document. Releasing that document is the precondition for confidence in the figures. Whether and how Indian manufacturing has stood up to Chinese competition is a question only reliable data can answer.

    “[2021, GS3, 10 marks] Explain the difference between computing methodology of India’s Gross Domestic Product(GDP) before the year 2015 and after the year 2015.”