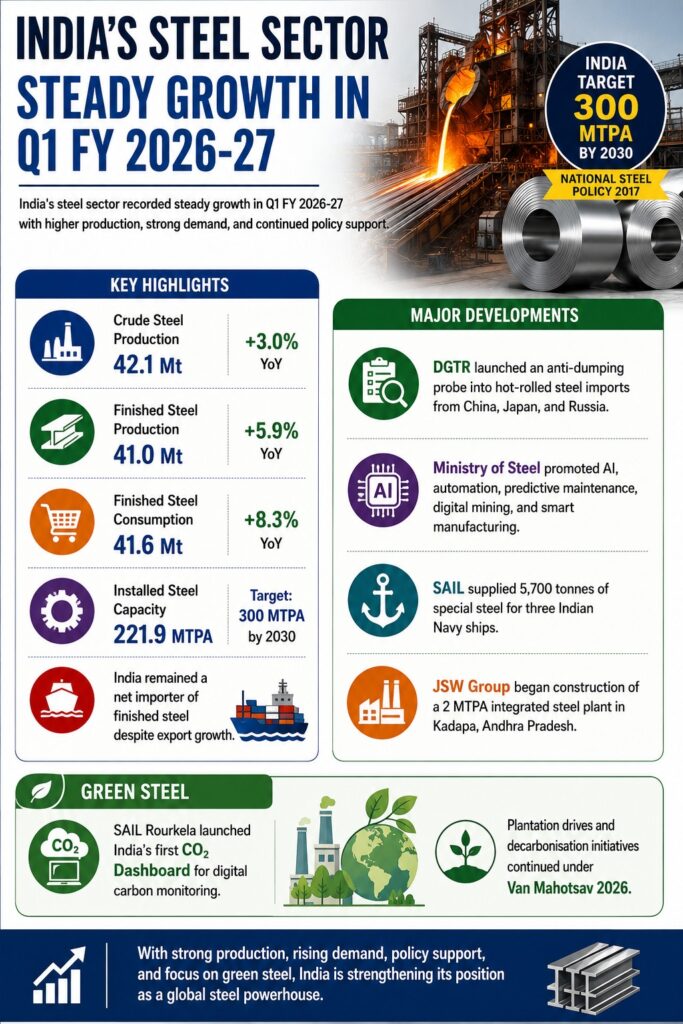
India’s steel sector recorded steady growth in Q1 FY 2026-27 with higher production, strong demand, and continued policy support.
Key Highlights
Crude steel production: 42.1 Mt (+3.0% YoY)
Finished steel production: 41.0 Mt (+5.9% YoY)
Finished steel consumption: 41.6 Mt (+8.3% YoY)
Installed steel capacity:221.9 MTPA (Target: 300 MTPA by 2030 under National Steel Policy 2017)
India remained a net importer of finished steel despite export growth.
Major Developments
DGTR launched an anti-dumping probe into hot-rolled steel imports from China, Japan, and Russia.
Ministry of Steel promoted AI, automation, predictive maintenance, digital mining, and smart manufacturing.
SAIL supplied 5,700 tonnes of special steel for three Indian Navy ships.
JSW Group began construction of a 2 MTPA integrated steel plant in Kadapa, Andhra Pradesh.
Green Steel
SAIL Rourkela launched India’s first CO₂ Dashboard for digital carbon monitoring.
Plantation drives and decarbonisation initiatives continued under Van Mahotsav 2026.
[2023]Consider the following heavy industries: 1. Fertilizer plants 2. Oil refineries 3. Steel plants Green hydrogen is expected to play a significant role in decarbonizing how many of the above industries?
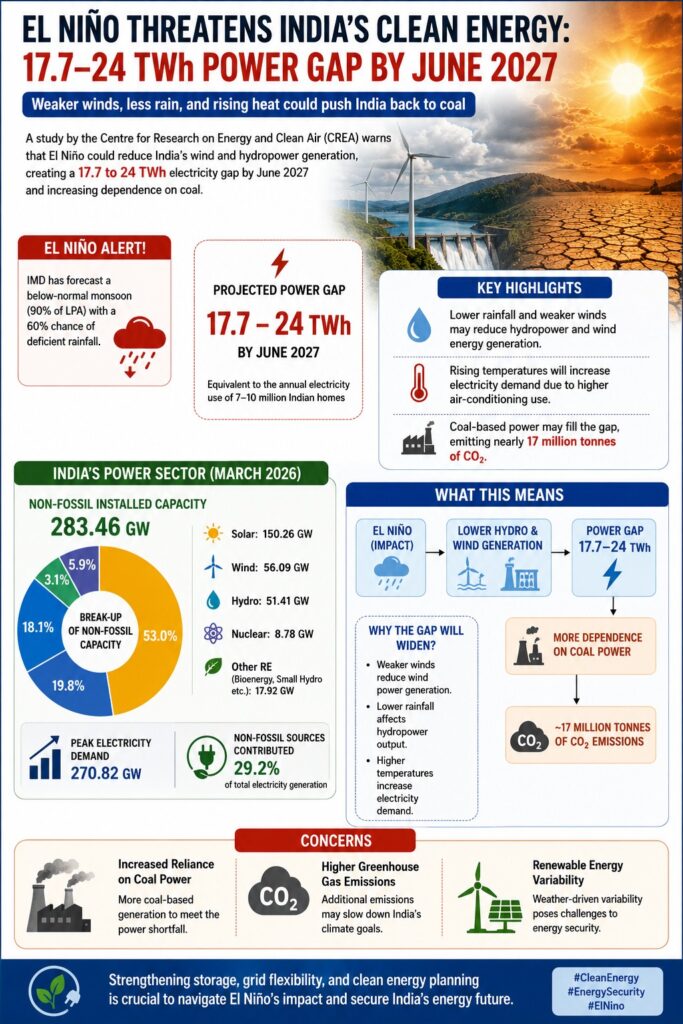
The Centre for Research on Energy and Clean Air (CREA) projects an 18 TWh clean-power shortfall for India by June 2027, driven by El Niño-linked weakness in wind and hydropower output and rising cooling demand. The finding exposes a gap between the record renewable capacity India has installed and the storage needed to actually deliver that capacity as power, forcing the shortfall to be filled by coal.
What has changed in India’s exposure to this El Niño cycle?
Monsoon deficit: June rainfall closed with an all-India deficit of about 40%, the fifth-lowest June since 1901, with the cumulative shortfall at 20% below normal by July 6.
IMD forecast: The India Meteorological Department has forecast below-normal southwest monsoon rainfall at 90% of the long-period average, with a 60% chance of a deficient season.
Generation gap: CREA projects a median shortfall of 17.7 TWh and a severe-case shortfall of 24 TWh, against India’s total 2025-26 generation of about 1,846 billion units.
Emissions cost: A coal-led response to the gap would release an estimated 17 million tonnes of additional carbon dioxide.
Is this a capacity shortfall or a utilisation shortfall?
Record capacity base: Non-fossil installed capacity reached 283.46 GW by March 31, including 150.26 GW of solar and 56.09 GW of wind.
Record additions: India added 44.6 GW of solar and 6 GW of wind capacity in 2025-26 alone.
Curtailment: Grid operators curtailed about 2.1 TWh of solar and wind generation last year to keep coal plants running.
Storage gap: CREA estimates roughly 10 GWh of battery storage could have averted this curtailment.
Why does the response default to coal rather than storage?
Coal’s continuing weight: Coal remains about 42% of installed capacity even as coal generation fell 3.69% over the year.
New coal pipeline: India is adding around 130 GW of new coal capacity to buffer peak demand, such as the 270.82 GW peak recorded on May 21.
Policy diagnosis: CREA director Nandikesh Sivalingam states India must move faster on batteries and grid upgrades to meet future demand surges.
Dispatch logic: Coal capacity can be dispatched on demand without storage investment, making it the default buffer despite its emissions cost.
Conclusion
India’s projected clean-power shortfall is a storage and grid-integration deficit, not a generation deficit. The 130 GW of new coal capacity being planned addresses the symptom of demand variability, not the missing battery and transmission investment needed to convert installed renewable capacity into reliable output. Without storage scaling alongside capacity addition, each future El Niño cycle will repeat the same coal fallback and its emissions cost.
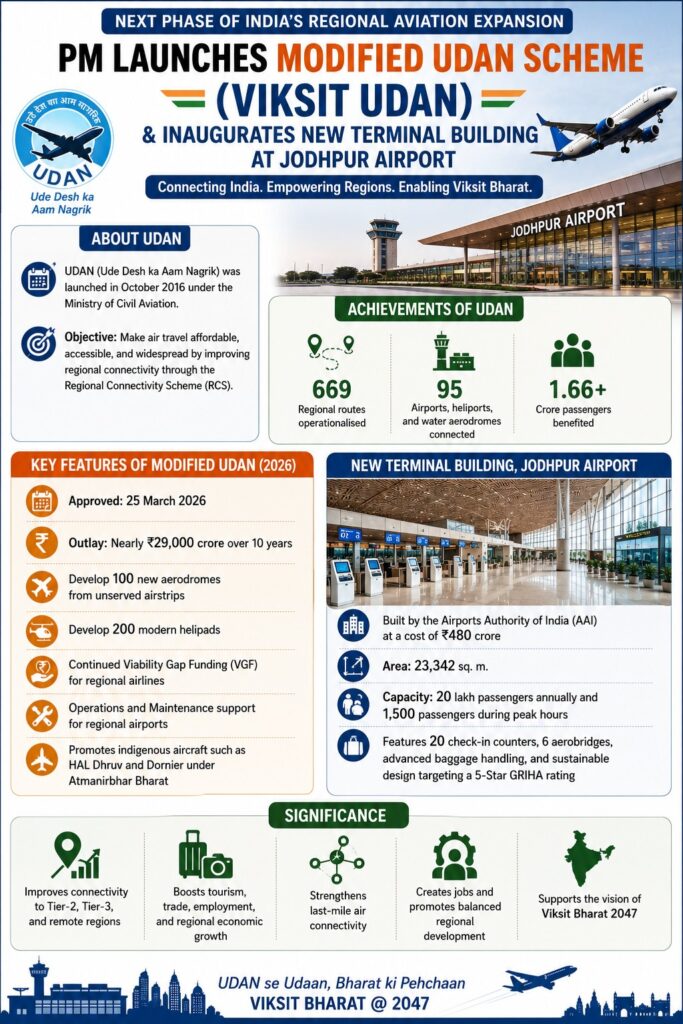
The Prime Minister launched the Modified UDAN Scheme (Viksit UDAN) and inaugurated the New Terminal Building at Jodhpur Airport, marking the next phase of India’s regional aviation expansion.
About UDAN
UDAN (Ude Desh ka Aam Nagrik) was launched in October 2016 under the Ministry of Civil Aviation.
Objective: Make air travel affordable, accessible, and widespread by improving regional connectivity through the Regional Connectivity Scheme (RCS).
Achievements of UDAN
669 regional routes operationalised.
95 airports, heliports, and water aerodromes connected.
Over 1.66 crore passengers benefited.
Key Features of Modified UDAN (2026)
Approved: 25 March 2026.
Outlay: Nearly ₹29,000 crore over 10 years.
Develop 100 new aerodromes from unserved airstrips.
Note: An aerodrome is any defined location on land or water used for the arrival, departure, and movement of aircraft
Develop 200 modern helipads.
Continued Viability Gap Funding (VGF) for regional airlines.
Operations and Maintenance support for regional airports.
Promotes indigenous aircraft such as HAL Dhruv and Dornier under Atmanirbhar Bharat.
New Terminal Building, Jodhpur Airport
Built by the Airports Authority of India (AAI) at a cost of ₹480 crore.
Area: 23,342 sq. m.
Capacity: 20 lakh passengers annually and 1,500 passengers during peak hours.
Features 20 check-in counters, 6 aerobridges, advanced baggage handling, and sustainable design targeting a 5-Star GRIHA rating.
Significance
Improves connectivity to Tier-2, Tier-3, and remote regions.
Boosts tourism, trade, employment, and regional economic growth.
Strengthens last-mile air connectivity.
Supports the vision of Viksit Bharat 2047.
[2024] Consider the following airports: 1. Donyi Polo Airport 2. Kushinagar International Airport 3. Vijayawada International Airport In the recent past, which of the above have been constructed as Greenfield project?
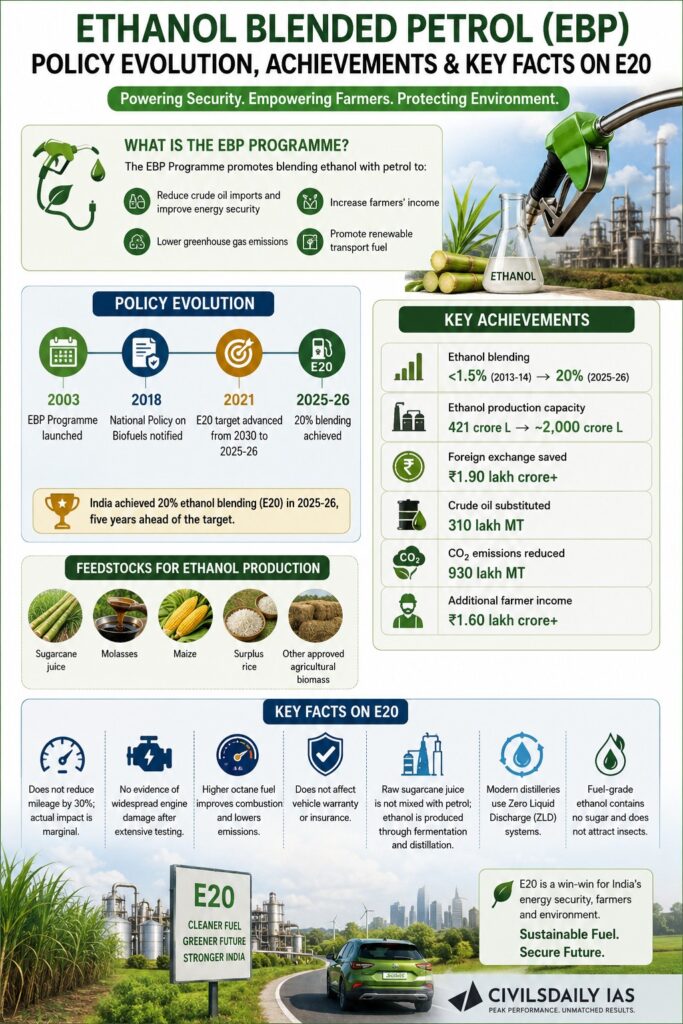
The Government highlighted the achievements of the Ethanol Blended Petrol (EBP) Programme, its policy evolution, and clarified common misconceptions regarding E20 fuel.
What is the EBP Programme?
The EBP Programme promotes blending ethanol with petrol to:
Reduce crude oil imports and improve energy security.
Lower greenhouse gas emissions.
Increase farmers’ income.
Promote renewable transport fuel.
India achieved 20% ethanol blending (E20) in 2025-26, five years ahead of the target.
Policy Evolution
2003: EBP Programme launched.
2018: National Policy on Biofuels notified.
2021: E20 target advanced from 2030 to 2025-26.
2025-26: 20% blending achieved.
Key Achievements
Ethanol blending: <1.5% (2013-14) → 20% (2025-26)
Ethanol production capacity: 421 crore L → ~2,000 crore L
Foreign exchange saved: ₹1.90 lakh crore+
Crude oil substituted: 310 lakh MT
CO₂ emissions reduced: 930 lakh MT
Additional farmer income: ₹1.60 lakh crore+
Feedstocks
Sugarcane juice, Molasses, Maize, Surplus rice, and Other approved agricultural biomass
Key Facts on E20
Does not reduce mileage by 30%; actual impact is marginal.
No evidence of widespread engine damage after extensive testing.
Higher octane fuel improves combustion and lowers emissions.
Does not affect vehicle warranty or insurance.
Raw sugarcane juice is not mixed with petrol; ethanol is produced through fermentation and distillation.
Modern distilleries use Zero Liquid Discharge (ZLD) systems.
Fuel-grade ethanol contains no sugar and does not attract insects.
[2025] Consider the following statements: Statement I: Of the two major ethanol producers in the world, i.e., Brazil and the United States of America, the former produces more ethanol than the latter. Statement II: Unlike in the United States of America where corn is the principal feedstock for ethanol production, sugarcane is the principal feedstock for ethanol production in Brazil. Which one of the following is correct in respect of the above statements?
[A] Both Statement I and Statement II are correct and Statement II explains Statement I
[B] Both Statement I and Statement II are correct but Statement II does not explain Statement I
[C] Statement I is correct but Statement II is not correct
[D] Statement I is not correct but Statement II is correct
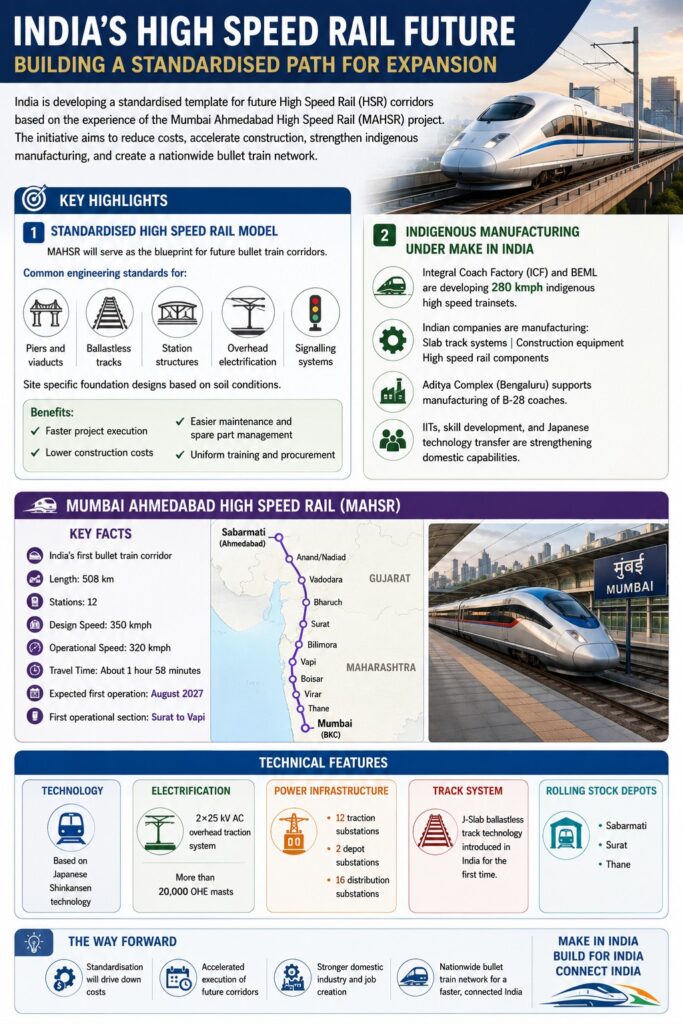
India is developing a standardised template for future High Speed Rail (HSR) corridors based on the experience of the Mumbai Ahmedabad High Speed Rail (MAHSR) project. The initiative aims to reduce costs, accelerate construction, strengthen indigenous manufacturing, and create a nationwide bullet train network.
Standardised High Speed Rail Model
MAHSR will serve as the blueprint for future bullet train corridors.
Common engineering standards for Piers and viaducts, Ballastless tracks, Station structures, Overhead electrification, and Signalling systems
Site specific foundation designs based on soil conditions.
Benefits:
Faster project execution
Lower construction costs
Easier maintenance and spare part management
Uniform training and procurement
Indigenous Manufacturing under Make in India
Integral Coach Factory (ICF) and BEML are developing 280 kmph indigenous high speed trainsets.
Indian companies are manufacturing Slab track systems, Construction equipment, and High speed rail components
Aditya Complex (Bengaluru) supports manufacturing of B-28 coaches.
IITs, skill development, and Japanese technology transfer are strengthening domestic capabilities.
Mumbai Ahmedabad High Speed Rail (MAHSR)
India’s first bullet train corridor, Length: 508 km, Stations: 12, Design Speed: 350 kmph, Operational Speed: 320 kmph, Travel Time: About 1 hour 58 minutes, Expected first operation: August 2027, and First operational section: Surat to Vapi
Technical Features
Technology: Based on Japanese Shinkansen technology
Electrification:2×25 kV AC overhead traction system. More than 20,000 OHE masts
Power Infrastructure:12 traction substations. 2 depot substations. 16 distribution substations
Track System: J-Slab ballastless track technology introduced in India for the first time.
Rolling Stock Depots: Sabarmati, Surat, and Thane
[2025] Consider the following statements: I. Indian Railways have prepared a National Rail Plan (NRP) to create a future ready railway system by 2028. II. Kavach’ is an Automatic Train Protection system, development in collaboration with Germany. III. ‘Kavach’ system consists of RFID tags fitted on track in station section. Which of the statements given above are not correct?
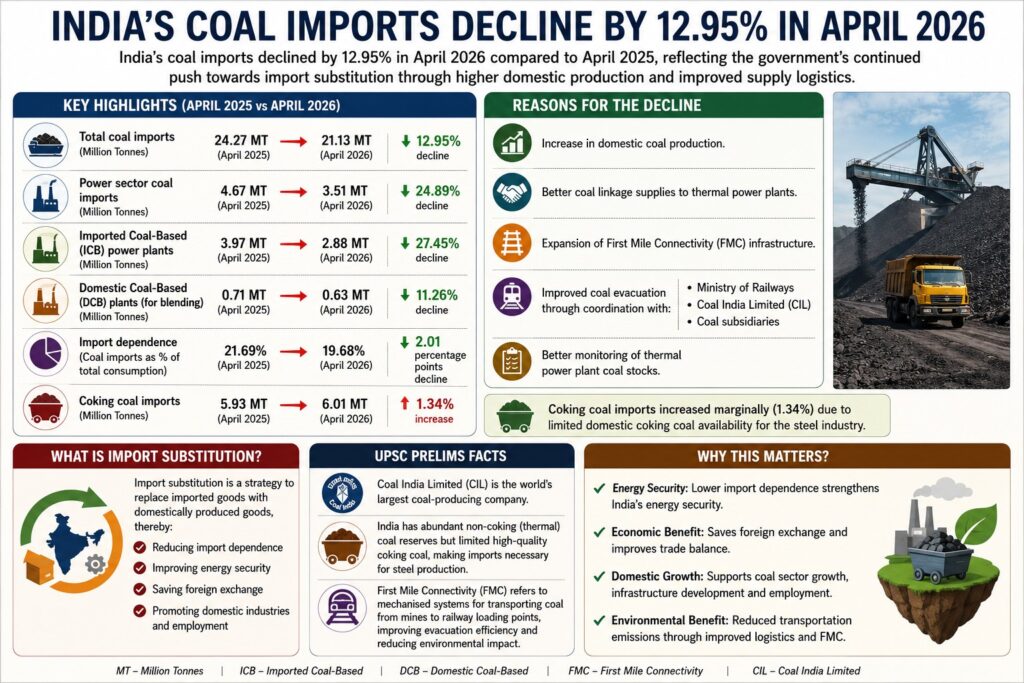
India’s coal imports declined by 12.95% in April 2026 compared to April 2025, reflecting the government’s continued push towards import substitution through higher domestic coal production and improved supply logistics.
Key Highlights
Total coal imports fell from 24.27 MT (April 2025) to 21.13 MT (April 2026), a decline of 12.95%.
Power sector coal imports declined by 24.89%, from 4.67 MT to 3.51 MT.
Imported Coal-Based (ICB) power plants recorded the steepest fall in imports: 3.97 MT → 2.88 MT (down 27.45%).
Domestic Coal-Based (DCB) plants importing coal for blending reduced imports by 11.26%: 0.71 MT → 0.63 MT.
Import dependence (coal imports as a share of total consumption) declined 21.69% → 19.68%.
Coking coal imports increased marginally by 1.34%: 5.93 MT → 6.01 MT, due to limited domestic coking coal availability for the steel industry.
Reasons for the Decline
Increase in domestic coal production.
Better coal linkage supplies to thermal power plants.
Expansion of First Mile Connectivity (FMC) infrastructure.
Improved coal evacuation through coordination with: Ministry of Railways, Coal India Limited (CIL), and Coal subsidiaries.
Better monitoring of thermal power plant coal stocks.
UPSC Prelims Facts
Coal India Limited (CIL) is the world’s largest coal-producing company.
India has abundant non-coking (thermal) coal reserves but limited high-quality coking coal, making imports necessary for steel production.
First Mile Connectivity (FMC) refers to mechanised systems for transporting coal from mines to railway loading points, improving evacuation efficiency and reducing environmental impact.
[2019] Consider the following statements: 1. Coal sector was nationalized by the Government of India under Indira Gandhi. 2. Now, coal blocks are allocated on lottery basis. 3. Till recently, India imported coal to meet the shortages of domestic supply, but now India is self-sufficient in coal product. Which of the statements given above is/are correct?
PYQ Relevance[UPSC 2022] Do you think India will meet 50 percent of its energy needs from renewable energy by 2030? Justify your answer. How will the shift of subsidies from fossil fuels to renewables help achieve the above objective? Explain. Linkage: The PYQ asks whether India can meet 50% renewable energy needs by 2030 and whether shifting subsidies from fossil fuels to renewables helps achieve it. The article shows that even with strong renewable capacity growth, meeting such targets depends on coordinating generation, transmission, storage and distribution, not subsidy shifts alone.
Mentor’s Comment
The Indian National Science Academy (INSA) released a policy brief in May 2026 proposing a unified, four-pillar national energy framework. As India’s energy mix diversifies, the binding challenge shifts from expanding capacity to coordinating generation, transmission, storage and distribution across a fragmented institutional landscape. India’s energy transition has moved from an input problem of building capacity to an output problem of coordinating a system it has deliberately diversified. The INSA’s four-pillar framework formalises this shift through institutional integration rather than further capacity expansion.
Why has India’s energy transition reached a point where coordination, not capacity, is the binding constraint?
Renewable capacity has scaled sharply: Installed renewable capacity grew from approximately 40 GW in 2015 to approximately 260 GW by 2025, a more than six-fold increase.
Import dependence persists despite expansion: Domestic energy production continues to grow, but India remains dependent on imports for a significant share of oil and natural gas requirements.
Demand growth adds to system complexity: Energy demand is expected to grow steadily as economic development, industrialisation and urbanisation continue.
Multiple objectives must be managed together: Energy security, affordability, sustainability and economic growth compete for priority, requiring coordinated planning across sectors and fuels.
Access foundations are already built: The Saubhagya Scheme and the Pradhan Mantri Ujjwala Yojana have delivered near-universal household electrification and clean cooking fuel access, shifting the policy problem from access to integration.
Two national targets set the horizon: India has committed to energy self-reliance by 2047 and net-zero emissions by 2070, both of which require an increasingly integrated approach to planning and governance.
What does the INSA’s four-pillar framework propose to structure this coordination?
Adequacy: Ensures reliable and diversified energy supply through a balanced portfolio of conventional and emerging sources, backed by modern infrastructure, storage and digital technologies.
Access: Builds on existing electrification and clean cooking gains to strengthen last-mile delivery, improve service quality and expand decentralised energy solutions.
Affordability: Relies on innovative financing mechanisms, efficient markets and consumer-focused safeguards to keep the transition economically viable for households, businesses and industries.
Appropriate sustainability: Rejects a one-size-fits-all model and aligns sustainability pathways with India’s developmental priorities, resource endowments, and social and regional context.
Cross-cutting enablers are named separately: Circular economy practices and Carbon Capture, Utilisation and Storage (CCUS) are identified as enablers that support renewable deployment and reduce industrial emissions.
How does the framework sequence implementation across time?
Near-term priorities are capacity-and-institution focused: Strengthening infrastructure, accelerating renewable deployment, supporting emerging technologies such as green hydrogen, and building institutional mechanisms for long-term coordination.
Long-term emphasis shifts toward integration: Over time, the focus moves toward deeper integration of low-carbon technologies, expanded use of bio-resources, and a more interconnected, resilient energy ecosystem.
The transition is treated as multi-decade, not single-cycle: The framework explicitly recognises that energy transitions occur over decades, avoiding premature closure on any single pathway.
Region-specific pathways are built into the design: The sustainability pillar supports local communities, workforce development and region-specific transition pathways rather than a uniform national template.
Can a single national framework unify a deliberately diversified and decentralised energy system?
Diversification was itself the policy achievement: India deliberately diversified its energy mix, growing renewable capacity six-fold while pursuing decentralised solutions under the access pillar.
The same brief now demands coordination across that diversity: As the energy ecosystem becomes more diverse, the brief argues that coordination among generation, transmission, storage, distribution and emerging technologies becomes increasingly necessary.
No single technology is assigned the transition: Coal, renewables, biomass, natural gas, waste-to-energy systems and emerging clean technologies are each given a continuing role, ruling out any single-pathway solution.
The framework unifies without standardising: The appropriate sustainability pillar explicitly rejects a one-size-fits-all approach, meaning a “unified” framework must accommodate region-specific and sector-specific variation rather than remove it.
Institutional authority remains unspecified: The brief calls for developing institutional mechanisms to facilitate long-term coordination but does not identify which entity holds authority when the four pillars’ objectives conflict across sectors.
Conclusion
India’s energy transition problem has shifted from expanding capacity to coordinating a system it has deliberately diversified. The INSA’s four-pillar framework formalises adequacy, access, affordability and sustainability as national objectives, but leaves unresolved which institutional mechanism will adjudicate conflicts between diversification and unification as the transition deepens. Coordination, not capacity, is now the binding constraint on India’s energy security by 2047 and its net-zero target by 2070.
The closure of the Strait of Hormuz in 2026 disrupted India’s crude oil and LPG supply chains, testing the country’s energy security architecture in real time. India’s refineries absorbed the crude shock through rapid sourcing diversification, but the same crisis exposed that LPG dependence is structurally different and cannot be diversified the same way, pushing coal based DME production onto the national agenda.
How did India’s refining sector convert two decades of indigenous investment into crisis resilience during the 2026 Hormuz disruption?
Diversified supplier base: India’s crude supplier base nearly tripled over two decades, forcing refineries to build capability to process multiple crude specifications rather than a single feedstock.
Indigenous technical capability: Investments in indigenous research, metallurgy, process innovation, and workforce training gave refineries the ability to process feedstock across a broad range of specifications.
Speed of the pivot: Within weeks of the Hormuz closure, non-Hormuz sourcing rose from 55% to 70% of India’s crude intake.
LPG production surge: Under the LPG control order, domestic LPG production rose from 35 Thousand Metric Tonnes (TMT) per day to 54 TMT per day within five days. Engineers achieved this by adjusting fractionation and cracking units in real time.
Engineering, not accounting: The production increase was an outcome of technical capability, not a redirection of existing supply.
Did refinery flexibility solve India’s LPG vulnerability, or did it only manage the immediate crisis?
Different nature of the two problems: Refinery flexibility solved the problem of keeping crude flowing through a fixed set of plants. It did not solve the deeper problem of LPG import concentration.
Crude diversification is engineerable: A refinery can be engineered to process crude from 40 different countries.
LPG diversification is not engineerable: LPG cannot be sourced from 40 different geographies. The molecule is drawn overwhelmingly from a handful of Gulf and Atlantic Basin producers.
Refining efficiency is not the solution: Processing the same imported molecule more efficiently does not reduce the underlying dependence.
The real solution is substitution: The long-term fix requires producing a domestic molecule that serves the same function as LPG.
What is Dimethyl Ether (DME), and how does India propose to substitute a domestic molecule for imported LPG?
Definition: DME is a clean-burning gas chemically similar to LPG. It blends directly into existing cylinders and pipelines, so it requires no new distribution infrastructure.
Production route: DME is produced through coal gasification. Coal gasification converts coal into syngas, and syngas is then converted into DME.
Resource base: India possesses some of the world’s largest coal reserves, giving it abundant raw material for DME production.
Regulatory approval: The Bureau of Indian Standards has approved blending up to 20% DME with LPG.
Quantified impact: A 20% blend sourced from coal gasification could displace roughly 6.3 million tonnes of LPG imports annually, saving nearly ₹34,000 crore in foreign exchange each year.
Origin of the technology: Scientists at CSIR’s National Chemical Laboratory developed the indigenous technology for converting methanol into DME years before the crisis.
Is India’s coal gasification ambition backed by matching execution capacity?
Policy commitment: The Union Cabinet approved a ₹37,500 crore scheme to promote surface coal and lignite gasification, citing the West Asia crisis as part of its rationale.
Scale of ambition: The scheme targets 100 million tonnes of coal gasification annually by 2030.
Investment incentive: The scheme provides an incentive of up to 20% of plant and machinery costs.
Tenure certainty: The scheme extends coal linkage tenure to 30 years. Capital-intensive projects need this horizon before committing investment.
Fast-tracked approval: The Centre for High Technology under the Ministry of Petroleum and Natural Gas approved scaling up the indigenous DME pilot technology within the crisis window, without the delay typical of technology-to-deployment transitions.
Feedstock gap: India’s coal has a higher ash content than the cleaner coal that underpinned China’s coal-to-chemicals industry.
Capacity gap: Domestic gasification capacity remains far below the scheme’s stated ambition.
Nature of the remaining challenge: Closing this gap is a question of industrial discipline and investment. Policy intent has already been settled.
Conclusion
India’s refinery flexibility during the Hormuz crisis proved that indigenous technical capability, once built, can absorb supply shocks. This capability did not solve India’s LPG dependence. LPG is sourced from a handful of Gulf and Atlantic Basin producers and cannot be diversified the way crude oil can. Coal-based DME production is the domestic substitute for the imported molecule. Policy commitment for it is now in place through the coal gasification scheme. What remains is execution: closing the ash-content gap and scaling gasification capacity to the technical depth China has spent two decades building.
Value Addition
What is Coal Chemistry?
Coal chemistry refers to the conversion of coal into high-value chemicals, fuels and industrial feedstocks through physical and chemical processes instead of burning it directly for power generation.
It enables coal to produce cleaner fuels, fertilizers, petrochemicals and specialty chemicals, thereby improving the economic value of domestic coal resources.
Major Products of Coal Chemistry
Process
Output
Coal Gasification
Syngas (CO + H₂)
Syngas Conversion
Methanol
Methanol Conversion
Dimethyl Ether (DME)
Fischer-Tropsch Process
Synthetic Diesel
Coal-to-Chemicals
Ammonia, Urea, Olefins, Hydrogen
What is Coal Gasification?
Coal gasification is the process of converting coal into synthesis gas (syngas) by reacting coal with oxygen, steam and controlled heat under high pressure.
Instead of burning coal directly, it transforms coal into a cleaner intermediate fuel that can be further processed into Hydrogen, Methanol, Dimethyl Ether (DME), Synthetic Natural Gas (SNG), Fertilisers, and Petrochemicals
What is Dimethyl Ether (DME)?
Dimethyl Ether (DME) is a clean-burning gaseous fuel produced from methanol derived through coal gasification.
Key Features
Chemically similar to LPG
Can be blended with LPG
Compatible with existing LPG cylinders and pipelines
Produces lower particulate emissions
Reduces dependence on imported LPG
Can also serve as a clean industrial and transport fuel
PYQ Relevance
[UPSC 2017] Access to affordable, reliable, sustainable and modern energy is the sine qua non to achieve Sustainable Development Goals (SDGs). Comment on the progress made in India in this regard
Linkage: The PYQ tests India’s strategy to achieve energy security through indigenous energy resources, cleaner technologies, and sustainable industrial development. The article highlights coal gasification and coal chemistry as indigenous clean-coal technologies that can reduce LPG imports, strengthen energy security, and support India’s transition towards reliable and sustainable energy systems.
Union Minister Sarbananda Sonowal highlighted V. O. Chidambaranar Port Authority as a model for sustainable maritime development, releasing its first Sustainability Report and launching several green and digital initiatives.
Key Highlights
Net carbon emissions reduced by 45%.
Renewable energy offsets nearly 94% of the port’s energy consumption equivalent.
Carbon intensity per tonne of cargo reduced by nearly 50% over the last four years.
Recognized as a Scope-2 Emission Free Port for its transition to clean energy.
Green Hydrogen Initiative
Hosts India’s first Green Hydrogen pilot project at a major port.
Featured in an Indian Institute of Management Calcutta case study titled “The Hydrogen Pivot”.
Education & Innovation
Kendriya Vidyalaya, VOC Port commenced academic activities for the 2026-27 session.
MoU signed with Gati Shakti Vishwavidyalaya for Maritime logistics research, Skill development, Sustainable port operations, and Centre of Excellence in Maritime Logistics & Port Management.
Digital Transformation
Launched PortGPT, making VOC Port the first major port in India to introduce an enterprise-grade generative AI mobile application for Operational efficiency, Knowledge management, and Data-driven decision-making.
Scope-2 Emissions
Indirect greenhouse gas emissions from purchased electricity, steam, heating, or cooling consumed by an organization.
Defined under the Greenhouse Gas (GHG) Protocol.
Green Hydrogen
Produced through electrolysis of water using renewable energy.
Emits zero carbon dioxide during production.
Key pillar of India’s National Green Hydrogen Mission.
[2023] Consider the following pairs : Port—–Well known as 1.Kamarajar Port—-First major port in India registered as a company 2.Mundra Port—–Largest privately owned port in India 3.Visakhapatnam—-Largest container port in India