Mains Ready By December. Smash Mains & Smash PYQ Admissions Open

Search results for: “”

  • Safety in Delhi needs a regulatory reset

    Why in the News

    A building collapse in Satya Niketan has reopened the question of who is answerable for building safety in Delhi. Comparable failures have occurred at Saidulajab, Hauz Rani, Tughlakabad Extension, Palam and Vivek Vihar. Delhi already runs an online single window system for building proposals, built on Automated Development Control Regulations (Auto DCR) software, and that system reached none of these structures. The contest is between a regulator that examines the plans submitted to it and a city where the dangerous construction is precisely the construction that submits no plan.

    How does Delhi’s single window building approval system work?

    1. Online filing and document verification: Building proposals are submitted online. The Auto DCR software and the Building Plan Approval Management System verify the mandatory documents.
    2. Fee and site visit: The system issues a scrutiny fee challan for online payment. It then sends an SMS to the building inspector and the architect carrying the details of the site visit.
    3. Automated reading of the drawing: Auto DCR creates entities such as plots, building layouts and roads from the submitted drawings, using layers, geometrical mapping and reports.
    4. Rule checking and status: AutoCAD and allied software analyse the plans against the development control regulations and the building bye-laws, and the compliance status is available online before the plans are examined for approval.

    Which laws does illegal construction breach?

    1. Planning and municipal law: Illegal construction violates the Master Plan for Delhi, the Unified Building Byelaws, the Delhi Development Act and the Delhi Municipal Corporation Act, 1957.
    2. Fire law: It also violates the Delhi Fire Service Act, 2007, which is the source of the fire safety clearance a building is required to hold.
    3. The city absorbs the cost: Unapproved construction adds load to transport, services and civic amenities that were planned for a lower density.
    4. The failures are recurrent: Frequent fire incidents and structural failures in illegal constructions have endangered lives.

    Why is Delhi’s exposure larger than the collapses suggest?

    1. Seismic exposure: Delhi falls in Seismic Zone IV, where earthquakes may be severe, so unengineered construction carries a citywide risk rather than a single owner’s risk.
    2. Two cities with one problem: Planned development coexists with informal growth in slums and unauthorised colonies. Both are plagued by building violations along with a lack of oversight and enforcement.
    3. Safety is not conditional on tenure: The city cannot afford unsafe buildings irrespective of the type of development, the land ownership or the land use.

    Why has repeated official attention changed so little?

    1. The findings already exist: Courts, the commissions headed by G T Nanavati and by Baleshwar Prasad, and the high level committee headed by Tejendra Khanna have all underlined building safety, with very little impact.
    2. Monitoring is the weak link: Haphazard development and weak monitoring systems produce inefficiencies, delays and a loss of accountability.
    3. Non-compliance carries no standing consequence: Every building without a structural and fire safety certificate should be sealed and should display a safety related warning, and no such automatic consequence operates today.

    Why does approving plans not produce safe buildings?

    1. The department sees only what is filed: Building departments mainly deal with the plans they receive, so massive illegal and risky constructions are left out of the process altogether.
    2. The digital reform did not widen the net: The single window system improved the handling of submitted proposals. It brought no unauthorised construction into any approval or inspection stream, which is why the reform has not been successful.
    3. The software trails the city it regulates: The system needs updating to handle redevelopment, green buildings, transit oriented development and approvals under mixed land use.

    What would demunicipalising building regulation mean?

    1. Separating the regulator from the political apparatus: The proposal is to make the regulatory function for buildings independent of the municipal and political structure that currently houses it.
    2. One structure performs two conflicting roles: The same municipal apparatus both sanctions construction and polices it, so enforcement competes with local political interest.
    3. Bringing in the settlements now left out: Radical reform is required so that structures in informal settlements, urban villages and resettlement colonies receive regulatory attention.

    What can technology detect that inspection does not?

    1. Remote detection of new construction: Geospatial artificial intelligence, using high resolution satellite imagery and LiDAR (laser based remote sensing that measures distances to build a three dimensional model of a surface), can monitor and detect unauthorised construction.
    2. Continuous tracking in place of periodic visits: Spatial data driven Real-Time Morphological Tracking can change how building and layout plans are approved, and improve compliance with the building bye-laws, the Fire Services Act and land use stipulations.
    3. Less discretion, less rent: Automated detection reduces the human interface in approval and enforcement, and reduces the corruption that discretion creates.

    Challenges to an independent building regulator for Delhi

    1. Authority over building control is already split: Sanction and enforcement are divided among the Municipal Corporation of Delhi, the New Delhi Municipal Council, the Delhi Development Authority and the Delhi Cantonment Board, so a new regulator adds a layer unless it absorbs theirs. Eg. The Delhi Development Authority prepares the Master Plan, and the municipal bodies sanction individual building plans under it.
      The Fix: Vest building safety certification in one statutory authority for the whole National Capital Territory, with the municipal bodies acting as its field arms.
    2. Unauthorised construction carries statutory protection: Punitive action against unauthorised colonies has repeatedly been suspended by law, so a regulator inherits a built stock it cannot act against. Eg. Successive National Capital Territory of Delhi Laws (Special Provisions) Acts have protected specified categories of unauthorised construction from demolition and sealing.
      The Fix: Convert that protection into a time bound retrofitting and certification requirement, so regularisation buys structural safety rather than immunity alone.
    3. Detection is not structural assessment: Satellite imagery and LiDAR identify a new or altered footprint, and they cannot read load bearing capacity, foundation integrity or the quality of materials. Eg. A failure triggered by excavation under an existing building leaves no external signature beforehand.
      The Fix: Pair remote detection with a mandatory structural audit by empanelled engineers for every building above a defined height or age.
    4. Certification capacity does not exist at that scale: Sealing every building without a structural and fire safety certificate presumes a supply of qualified structural engineers and fire auditors the city does not have. Eg. Fire safety clearance is required only above a prescribed building height, and even that stock is audited irregularly.
      The Fix: Licence and empanel private structural auditors under statutory personal liability, with random state verification of the certificates they issue.

    Conclusion

    Building regulation in Delhi is organised around a transaction, the filing of a plan, and the buildings that kill people are the ones that never generate that transaction. Better software and further audit requirements leave that structure untouched. The reform with any prospect of changing outcomes starts from the built stock rather than from the file, detects change on the ground, and carries the authority to act on what it finds without asking an elected municipal body first. Whether the proposal for a regulator of that kind moves past commentary is the thing to watch.

    Urban Governance in India

    1. Cities carry the economy: Cities house about 37 per cent of the population and generate close to 70 per cent of India’s Gross Domestic Product (GDP).
    2. The urban share keeps rising: Urban India is projected to reach about 60 crore people, or 40 per cent of the population, by 2036.
    3. Authority is fragmented by design: Municipal functions are split across urban local bodies, development authorities and parastatal agencies, so no single body answers for a city.
    4. Cities raise almost nothing of their own: Urban local bodies raise under 0.6 per cent of GDP as own revenue, of which property tax accounts for about 0.15 per cent.

    Constitutional Framework Governing Urban Governance

    1. Part IXA, Articles 243P to 243ZG: Inserted by the Constitution (Seventy-fourth Amendment) Act, 1992, it gives municipalities constitutional status and fixes their composition, duration and elections.
    2. Twelfth Schedule: Lists 18 functions a State may devolve to municipalities, including urban planning, regulation of land use and construction of buildings, and fire services.
    3. Article 243W: Empowers State legislatures to confer powers and responsibilities on municipalities as institutions of self government and for the Twelfth Schedule functions.
    4. Article 243Y: Requires the State Finance Commission to review municipal finances and recommend the sharing of State taxes with municipalities.

    Laws and Rules Governing Urban Development

    1. National Building Code of India, 2016: A model code issued by the Bureau of Indian Standards setting requirements for structural safety, fire and life safety and building services. States give it force through their own bye-laws.
    2. Model Building Bye-Laws, 2016: A template issued by the Ministry of Housing and Urban Affairs for State and municipal bye-laws, covering sanction procedure, setbacks, parking and fire safety.
    3. Real Estate (Regulation and Development) Act, 2016: Requires registration of projects and agents with a State regulatory authority, and fixes promoter liability for structural defects for five years from possession.
    4. Disaster Management Act, 2005: Provides the statutory basis for disaster management plans and for safety and retrofitting norms in hazard prone areas.

    Challenges in Urban Governance

    1. Devolution under the Seventy-fourth Amendment is incomplete: Many States have not transferred the listed functions or empowered mayors, so the body closest to a building is not the body that controls it. Eg. Urban planning and land use regulation sit with State owned development authorities in most large cities.
      The Fix: Complete activity mapping for the Twelfth Schedule functions and provide for directly elected mayors with a fixed tenure.
    2. Municipal finances cannot fund enforcement: Weak own revenue leaves cities without the technical staff to inspect, audit or prosecute. Eg. Successive Finance Commissions have tied municipal grants to property tax reform and audited municipal accounts.
      The Fix: Shift property tax to capital value with periodic revision, and make audited accounts a condition for central mission funds.
    3. Most urban land is not planned at all: Only about 30 per cent of urban land is properly planned, so the majority of growth happens outside any development control regime. Eg. Census towns cross the urban thresholds without having any urban local body.
      The Fix: Extend statutory planning coverage to census towns and peri urban areas before they are built out.
    4. Urban disaster risk is outrunning municipal capacity: Flooding, fire and heat concentrate on the least regulated built stock and on the poorest occupants. Eg. The Disaster Management (Amendment) Act, 2025 provides for Urban Disaster Management Authorities in large cities.
      The Fix: Make the city disaster authority the owner of building safety audits, with the power to seal non compliant structures.

    Matching Previous Year Question

    “[2023, GS2, 10.0 marks] “The states in India seem reluctant to empower urban local bodies both functionally as well as financially.” Comment.”

  • Reclaiming universities through trust, student voice

    Why in the News

    The Supreme Court has stayed the Bar Council of India (BCI)’s order against the graduating batch of the National Academy of Legal Studies and Research (NALSAR), Hyderabad. The same intervention quashed all first information reports (FIRs) against the protesting students. It declared that the BCI has no disciplinary control over students. It also reduced the three year practice condition for writing the judicial services examination to one year. The order follows a protest by law students seeking a say in their own convocation, widely attributed to an oral remark by the Chief Justice of India that was quickly clarified. The contest is over whether campus unrest is a failure of student discipline or a failure of a governance model that leaves students out of the decisions binding them.

    What is academic freedom?

    1. The freedom to teach, research and question: Academic freedom is the entitlement of those engaged in scholarly teaching and research to decide what to study, what to teach and what to challenge, without direction from the government or the university administration.
    2. No express Indian guarantee: The Constitution of India does not mention academic freedom. Article 5(3) of the German Basic Law guarantees scientific freedom (Wissenschaftsfreiheit) as a right of everyone engaged in scholarly teaching and research.
    3. A recognised right elsewhere: The Constitutions of Japan, South Africa, Portugal and Spain contain a comparable freedom. Article 137 of the Basic Law of Hong Kong provides that educational institutions may retain autonomy and enjoy academic freedom.
    4. Its limit is conduct, not speech: The freedom carries no right to defame or to engage in anti-national activity. Where an academic activity involves conduct rather than speech, the state is entitled to regulate that conduct.

    Why is curriculum the sharp edge of the dispute?

    1. Curriculum is set without the people it binds: University curriculum should be decided by the stakeholders, including students. Eg. Delhi University dropped a paper on the Delhi Sultanate along with some other papers.
    2. Students read such changes as political: Curriculum changes of this kind are seen as having ideological reasons rather than academic ones, which turns an academic decision into a governance grievance.
    3. The direction of restraint runs both ways: Government is not to dictate to universities what to teach, how to teach and what not to teach. Universities owe the same freedom to their departments and faculties.
    4. The campus exists for the contested question: Universities are meant to be a special place for reflection, inquiry and discussion, which is the function a closed curriculum process removes.

    What do experiences abroad show about academic freedom under pressure?

    1. The United States has used funding as leverage: Federal funding has been weaponised to reshape campus culture. Diversity programmes have been dismantled and research funding in areas such as climate change has been reduced.
    2. Permitting protest has itself invited pressure: Universities have faced pressure for allowing student protests, including those over Gaza.
    3. Neither ideological side is exempt: Right wing and left wing regimes have both, at times, sought to control universities.
    4. The pattern is old: Arnold Toynbee resigned from King’s College London in 1924 over his writings on the Greek army’s atrocities. Professors were persecuted during the McCarthy era.
    5. Funders now shape the research agenda: Declining public funding has left research agendas increasingly influenced by funders, corporations and pharmaceutical companies.

    What is the control model of university governance?

    1. Authority sits in one office: Most universities remain Vice-Chancellor centric. Students, who are the reason universities exist, have little say in their governance.
    2. Grievances have no route upward: Vice-Chancellors rarely hold open houses and are often inaccessible to ordinary students. Unaddressed grievances leave students feeling ignored, and some then take extreme steps.
    3. Control substitutes for dialogue: Administrations adopted the control model as governments increasingly sought to control universities. A community of highly educated faculty and young people requires dialogue, trust and openness rather than surveillance.
    4. Knowledge creation needs the opposite conditions: Universities exist to innovate and create knowledge, which requires the freedom to question everything and challenge existing ideas.

    How does under-investment compound the control problem?

    1. The policy target has not been met: The National Education Policy 2020 promises public investment of 6 per cent of Gross Domestic Product (GDP) in education. Public investment has steadily declined and hovers around 4 to 4.1 per cent.
    2. Higher education gets the smallest share: Within that spending, higher education receives the smallest allocation, so the system is over-regulated and grossly underfunded at the same time.
    3. Autonomy is not alien to the system: The ancient Gurukul system was entirely autonomous, and the present arrangement regulates far more and funds far less.
    4. The shortfall is visible on campus: Public university infrastructure has deteriorated and hostels are in acute shortage, which produced the recent deaths in New Delhi. Faculty positions remain vacant and guest faculty are poorly paid.
    5. Teaching and examinations both fail the student: Poor teaching frustrates students. Repeated examination paper leaks add to their stress.

    What do Vice-Chancellor appointments reveal?

    1. Natural justice is overlooked: In one case a Vice-Chancellor changed the composition of the selection committee, chaired it and voted in the selection of his wife. She was appointed as Vice-Chancellor.
    2. The courts did not correct it: The judiciary declined to follow its own precedents of quashing such appointments.
    3. An adverse record is not a bar: Individuals with questionable records and adverse Central Vigilance Commission (CVC) reports have been appointed, and some State universities face allegations of bribery.
    4. Recruitment rewards leaning over merit: Faculty recruitment over-emphasises ideological leanings rather than merit. Ideological governments may prefer candidates with particular leanings, and merit should not be completely undermined on that account.
    5. Examination integrity follows appointment integrity: No examination system can be foolproof where paper setters, moderators or testing officials are appointed for reasons other than absolute merit and integrity.

    Who actually absorbs the blame for campus unrest?

    1. The anger travels past the administration: Student frustration erupts against the government rather than against university administrations. The government received the criticism for the actions of the Vice-Chancellor in the appointment case.
    2. Much of it is avoidable on campus: The backlash could largely be avoided where administrations engage students in meaningful dialogue and provide timely relief.
    3. The government is not a bystander either: Administrations adopted the control model because governments sought control of universities, so the incentive that produced the model is a governmental one.

    What does the liberty model change?

    1. Trust is the operative mechanism: The liberty model of governance was implemented across three universities over 16 years. Students who are trusted act more responsibly in turn.
    2. Access without gatekeeping: Students met the Vice-Chancellor without appointments and raised personal concerns and difficulties. That access made frank conversations possible when difficult or unpopular decisions had to be taken.
    3. Unpopular ideas are protected: The model treats the university as a space where even the most unpopular ideas can be freely debated, which is the opposite of the top-down model.
    4. Students sit inside the decisions: Students are given a meaningful role in academic, administrative and financial decisions, including faculty appointments, procurement, curriculum design and the drafting of university regulations.
    5. A statutory precedent already exists: Students at Aligarh Muslim University have a statutory role in selecting the Vice-Chancellor.

    Challenges to the liberty model of university governance

    1. Participation rights can be captured by party politics: Campus unions aligned to national parties can convert a participation right into a channel for external political control. Eg. Delhi University Students’ Union elections are contested by the student wings of national parties.
      The Fix: Tie student participation to reserved seats on academic and finance bodies with fixed terms, so it runs through statutory channels rather than street mobilisation.
    2. A Vice-Chancellor cannot devolve powers that are not his: Faculty appointments and university finances are governed by University Grants Commission (UGC) regulations and State legislation, so student participation in them rests on the incumbent’s discretion. Eg. The Vice-Chancellor is himself selected by the Chancellor or Visitor from a search committee panel.
      The Fix: Amend university statutes to create student membership on selection and finance committees, so participation has a legal basis rather than a personal one.
    3. The model lapses with the person who ran it: A governance style adopted by one Vice-Chancellor ends when that office changes hands, since nothing in the statute compels a successor to continue it. Eg. Open house access is an administrative practice and not a rule.
      The Fix: Write grievance redressal timelines and open house frequency into university ordinances so the practice survives a change of office.
    4. Trust cannot supply what money supplies: Dialogue does not create hostel seats, permanent faculty or laboratory funding, which are the material grounds of much campus unrest. Eg. Sanctioned faculty posts in central and State universities stay vacant regardless of the governance style adopted.
      The Fix: Link central grants to filled sanctioned posts and audited hostel capacity, so funding follows the deficits that generate protest.

    Conclusion

    The Supreme Court’s order settles who may discipline a law student. It does not settle who governs a campus. Curriculum decisions, convocation arrangements and appointments all turn on whether students hold any formal seat in university decision making, and at present they hold almost none. The measure worth watching is whether university statutes are amended to give students standing on academic and selection bodies, since a governance practice resting on the person in office leaves with that person.

    Higher Education in India

    1. Second largest system in the world: Total enrolment is estimated at 4.65 crore in 2026, up from 3.42 crore in 2014-15.
    2. Institutional spread: India hosts over 1,168 universities and 45,473 colleges, against 760 universities in 2014-15.
    3. Participation is short of the target: The Gross Enrolment Ratio in higher education, meaning enrolment at that stage as a share of the population in the corresponding age group, stands at 28.4 per cent against the National Education Policy 2020 target of 50 per cent by 2035.
    4. Women now enrol marginally more than men: The Gender Parity Index stands at 1.01, indicating slightly higher female than male participation for the first time.

    Constitutional Framework Governing Higher Education

    1. Entry 25, List III: Education, including technical and medical education and universities, is a Concurrent List subject after the Constitution (Forty-second Amendment) Act, 1976.
    2. Entry 66, List I: Coordination and determination of standards in institutions of higher education and research is reserved to the Union.
    3. Entry 63, List I: Banaras Hindu University, Aligarh Muslim University and Delhi University are institutions of national importance under Union competence, along with any other so declared by Parliament.
    4. Article 30(1): Religious and linguistic minorities have the right to establish and administer educational institutions of their choice.
    5. Article 19(1)(a): Free speech on campus is protected, subject only to the restrictions Article 19(2) itself permits.

    Laws and Rules Governing Higher Education

    1. University Grants Commission Act, 1956: Establishes the UGC to coordinate and determine standards in university education and to disburse grants to universities and colleges.
    2. All India Council for Technical Education Act, 1987: Creates the statutory regulator for technical education, covering planning, norms and approval of technical institutions.
    3. National Council for Teacher Education Act, 1993: Creates the regulator for teacher education programmes and the institutions that run them.
    4. Anusandhan National Research Foundation Act, 2023: Establishes the National Research Foundation to seed and fund research across higher educational institutions, including State universities.

    Government Initiatives for Higher Education

    1. National Education Policy 2020: Replaces the National Policy on Education, 1986, and is built on access, equity, quality, affordability and accountability.
    2. Academic Bank of Credits: A digital repository holding course credits, which enables multiple entry and exit within a degree programme.
    3. Automated Permanent Academic Account Registry (APAAR): A single student identifier linking academic records, skills and transfers in one portal.
    4. Prime Minister’s Research Fellowship: Doctoral fellowships for research scholars, expanded to award 10,000 new fellowships.

    Challenges in Higher Education Governance

    1. Fragmented regulatory structure: Multiple bodies issue overlapping and sometimes conflicting guidelines to the same institution, which delays academic decisions. Eg. A technical department inside a university answers to the All India Council for Technical Education and the UGC at the same time.
      The Fix: Consolidate approvals under a single higher education regulator with separate verticals for funding, standard setting and accreditation.
    2. Quality is unmeasured across much of the system: Over 30 per cent of Indian higher educational institutions remain unaccredited as of early 2026. Eg. Accreditation by the National Assessment and Accreditation Council is not a precondition for most colleges to award degrees.
      The Fix: Make one completed accreditation cycle a condition for degree granting status and for central grants.
    3. Research spending is stagnant: Research and development expenditure stands at 0.64 per cent of GDP, against about 2.4 per cent in China and 3.4 per cent in the United States. Eg. India contributes under 5 per cent of global research publications.
      The Fix: Route National Research Foundation funding towards State universities, which carry most enrolment and almost none of the research grant.
    4. Employability does not follow the degree: Curricula are not aligned to hiring requirements, so enrolment growth does not convert into work. Eg. Only about 4 per cent of higher education carries formal skill training.
      The Fix: Embed apprenticeship credits inside degree programmes under the National Credit Framework.

    Back2Basics: Bar Council of India

    1. A statutory body under the Advocates Act, 1961: It regulates the legal profession and legal education in India.
    2. Standard setting: It lays down standards of professional conduct and etiquette for advocates, and prescribes the conditions on which a law degree is recognised for enrolment.
    3. Composition: Its members are elected by the State Bar Councils, with the Attorney General of India and the Solicitor General of India as ex officio members.

    Matching Previous Year Question

    “[2014, GS2, 12.5 marks] Should the premier institutes like IITs/IIMs be allowed to retain premier status, allowed more academic independence in designing courses and also decide mode/criteria of selection of students. Discuss in light of the growing challenges.”

  • PAC flags failure to transfer Rs 9,222 cr. in cess collections

    Why in the News

    The Public Accounts Committee (PAC) has flagged the failure to transfer Rs 9,222 crore of cess and levy collections to their designated reserve funds. Members questioned the Union Finance Ministry’s explanation on the issue. The committee reiterated its earlier recommendation that such collections be used only for the purposes for which they were raised. It had made that recommendation once already, in its 69th report tabled in August 2023, and the stated position of the chairperson is that ignoring the directions of a parliamentary standing committee amounts to an insult to Parliament. The tension is that a cess is justified to the taxpayer by an earmarked purpose. Its proceeds can still remain unmoved and available for ordinary expenditure.

    What is the Public Accounts Committee?

    1. A parliamentary financial committee: The PAC examines the appropriation accounts and the finance accounts of the Union government, along with the audit reports of the Comptroller and Auditor General (CAG).
    2. Its composition: It has 22 members, 15 elected by the Lok Sabha and 7 by the Rajya Sabha, each serving a one-year term. Ministers cannot be members.
    3. Chaired from the Opposition: By convention followed since 1967, the chairperson is drawn from the Opposition benches.
    4. It works after the money is spent: The committee scrutinises expenditure already incurred, so its function is post-facto accountability rather than approval of spending.

    What did the audit find?

    1. Collections that never reached their funds: An audit examination for 2024-25 found that money collected through various cesses and levies was not transferred to four designated reserve funds during the year.
    2. Where the finding is recorded: The finding forms part of Paragraph 3.3.1 of the CAG’s Report No. 6 of 2026.
    3. The explanation was not accepted: Members of the committee questioned the Finance Ministry’s account of why the transfers did not happen.

    What had the committee already recommended?

    1. Assess the amount and the duration: The 69th report called for scientific assessments of how much a cess should raise and for how long it should run.
    2. Review whether the purpose was served: It called for periodic reviews to evaluate whether the objectives a cess was raised for had actually been achieved.
    3. Credit the proceeds regularly: It called for regular crediting of cess proceeds to the reserve funds created to hold them.

    Why does the non-transfer matter?

    1. Purpose is the entire justification: The committee’s position is that cess collections must go to the purposes for which they were raised, and not toward financing the government’s budgetary deficit.
    2. The burden falls on everyone: A cess is collected from the whole population, whether or not a person pays income tax, and reaches the middle class and the poor alike.
    3. An unfunded fund is a fund in name only: A reserve fund that exists on paper but is never credited cannot finance the programme it was created for, so the earmarking becomes a description rather than a constraint.

    Conclusion

    A cess earns its political acceptance from a named purpose, and that acceptance is spent at the moment of collection whether or not the money ever reaches the fund. The committee can record the lapse and can repeat itself, but it cannot compel a transfer, which is why the same paragraph returns to it audit cycle after audit cycle. The current status is a recommendation standing reiterated and unimplemented for a third year. The next test is whether the Finance Ministry files an action taken note committing to a crediting timetable, rather than one restating the accounting position that produced the audit finding.

    Back2Basics: Cess

    1. What it is: A cess is a tax imposed on top of an existing tax, levied for a specific stated purpose rather than for general revenue.
    2. It stays outside the divisible pool: Article 270 keeps cesses and surcharges out of the pool of central taxes shared with the States, so a State receives no share of the collections.
    3. How the earmarking is meant to work: Proceeds are credited to the Consolidated Fund of India and are then to be transferred to a designated reserve fund from which the stated purpose is financed.
    4. Examples in force: The Health and Education Cess, the Road and Infrastructure Cess and the Goods and Services Tax Compensation Cess.

    Matching Previous Year Question

    “[2013] Consider the following statements : The Parliamentary Committe on Public Accounts 1. Consists of not more than 25 members of the Lok Sabha 2. Scrutinizes appropriation and finance accounts of the Government 3. examines the report of the Comptroller and Auditor General of India Which of the statements given above is/are correct? (a) 1 only (b) 2 and 3 only (c) 3 only (d) 1, 2 and 3 ANSWER: (b)”

  • Punjab stand on judge sets disturbing precedent

    Why in the News

    Justice Ashwani Kumar Mishra has taken oath as Chief Justice of the Punjab and Haryana High Court, with the front-row chair reserved for the Punjab Chief Minister left empty. A day earlier the State Cabinet had asked the Punjab Governor to hold off the oath-taking. Its stated ground was that the Centre notified the appointment without the State’s consent, in breach of the Memorandum of Procedure (MoP) that governs judicial appointments. The Supreme Court Collegium had recommended Justice Mishra and three other judges as chief justices of four High Courts on 6 August, and the Centre notified the appointment on 5 September. The contest is between a State’s right to be consulted on a High Court appointment and a consultative process that fixes no deadline for the State to answer.

    What is the Memorandum of Procedure?

    1. The rulebook for judicial appointments: The MoP sets out the sequence by which judges of the higher judiciary are recommended, consulted upon and appointed.
    2. It requires the States to be consulted: Before a High Court appointment is notified, the Centre must consult the State concerned.
    3. It fixes no time limit on the State: The document sets no deadline for a State to send its response.
    4. It is an executive document, not a statute: The MoP is settled between the Centre and the judiciary, and a revised version sought after the National Judicial Appointments Commission was struck down in 2015 remains unfinished.

    What is Punjab’s case?

    1. Consent was not obtained: The Cabinet’s position is that the Centre notified the appointment without the State’s concurrence, which it treats as a breach of the MoP.
    2. No deadline binds the State: Punjab is correct that the MoP prescribes no deadline for a State’s response, so a delayed reply violates nothing on the document’s own terms.
    3. The flexibility has a purpose: That absence of a deadline exists because judicial appointment is designed as a consultative process rather than a clearance queue.

    Why does the case not hold?

    1. Weeks were available and went unused: If the State government had reservations about Justice Mishra, it had weeks in which to put them on file, where they could have been examined on their merits.
    2. The silence blocked three other courts: The delay in Punjab’s response held up all four chief justice appointments recommended in the same Collegium resolution.
    3. The court had recently ruled against the State: As Acting Chief Justice, Justice Mishra’s bench pulled up Punjab in August for withholding dearness allowance dues and for finding ample money for advertising. His court also heard a Mohali case in which allegations were made against the Chief Minister’s wife, which the ruling party has described as politically motivated.

    Is this an isolated episode?

    1. The same move was attempted in Delhi: The Aam Aadmi Party earlier sought to have Justice Swarana Kanta Sharma taken off the appeal in the excise policy case in which its leaders are arraigned as accused.
    2. The precedent this sets: Treating an adverse order as a personal affront converts a judicial outcome into a ground for obstructing an appointment, which is a template no political party should be able to rely on.

    What reform does the episode point to?

    1. Defined timelines belong in the MoP: The episode makes the case for writing fixed response periods into a document that currently has none.
    2. A benchmark already exists on the other side: The Supreme Court has set the Centre a benchmark of three to four weeks for clearing names reiterated by the Collegium.
    3. Deemed consent closes the gap: A comparable window for State responses, after which consent is treated as given, would remove the ambiguity this episode exposed.

    Conclusion

    Disagreement between the Centre and a State over an appointment is ordinary constitutional business, and nothing about it is improper. Withholding a reply is not disagreement; it is the absence of one, and it quietly converts a consultative step into a veto that no rule ever granted. A written objection with reasons can be examined and answered; silence can only be waited out. What remains unresolved is whether the duty to consult carries a corresponding duty to respond, and the present arrangement supplies no answer either way.

    Back2Basics: The Collegium

    1. What it is: The Collegium is the body of senior judges that recommends appointments and transfers in the higher judiciary. It finds no mention in the text of the Constitution.
    2. Its composition: For Supreme Court appointments it consists of the Chief Justice of India and the four seniormost judges of the Supreme Court.
    3. Where it came from: It emerged from the Second Judges Case (1993), which read “consultation” in Articles 124 and 217 as concurrence, and was expanded by the Third Judges Case (1998).
    4. Its binding force: The government may return a recommendation once, but a name reiterated by the Collegium is binding on it.

    Matching Previous Year Question

    “[2025, GS2, 15.0 marks] Discuss the evolution of collegium system in India. Critically examine the advantages and disadvantages of the system on appointment of the Judges of the Supreme Court of India and that of the USA.”

  • 2,843 km, 400-plus trains: Corridors cut time and cost, offer last-mile link

    Why in the News

    The last three sections of the Western Dedicated Freight Corridor (WDFC) have been inaugurated at Vadodara, completing India’s dedicated freight rail network. The three sections cover 326 kilometres and were developed at a cost of over Rs 20,700 crore. Their commissioning closes the 1,506-km western corridor, and with the 1,337-km Eastern Dedicated Freight Corridor (EDFC) already commissioned in October 2023, the network now runs to 2,843 km. The corridors were built to relieve trunk routes whose line capacity utilisation had reached between 115 and 150 per cent. The open question is whether separate freight track alone can lift rail’s share of national freight from about 27 per cent to the 45 per cent the National Rail Plan targets.

    What are the Dedicated Freight Corridors?

    1. Freight-only railway lines: The Dedicated Freight Corridors (DFCs) are high-speed railway lines built to carry goods traffic alone, physically separated from the passenger network.
    2. Two routes, east and west: The project comprises an eastern corridor and a western corridor, together among the largest infrastructure works ever undertaken by the Railways.
    3. A dedicated executing entity: The Dedicated Freight Corridor Corporation of India Limited (DFCCIL), a special purpose vehicle, was set up for the construction, operation and maintenance of the corridors.

    Why were separate freight lines needed at all?

    1. Trunk routes were saturated: The Howrah-Delhi route on the east and the Mumbai-Delhi route on the west were running at line capacity utilisation of between 115 and 150 per cent, and the Railways saw a dip in freight traffic as a result.
    2. The load shifted to road: The National Highways running along these corridors make up 0.5 per cent of the road network yet account for almost 40 per cent of total road freight.
    3. Freight earnings carry the system: Freight services account for over 65 per cent of the Railways’ total earnings, and that revenue subsidises passenger travel.

    What does each corridor cover?

    1. The western corridor: The WDFC runs 1,506 km from the Jawaharlal Nehru Port Trust (JNPT) in Navi Mumbai to Dadri near Noida in Uttar Pradesh. Its final three sections are New Sanand (N)-New Makarpura, New Umbergaon-New Saphale, and New Saphale-New JNPT.
    2. The last stretch reaches the port: The Vaitarna (Saphale) to JNPT stretch in Maharashtra is now operational, and freight loading is expected to rise further on the strength of that direct port connectivity.
    3. The eastern corridor: The EDFC runs 1,337 km from Ludhiana in Punjab to Sonnagar in Bihar and was fully commissioned in October 2023.
    4. Two segments of differing capacity: The EDFC has an electrified double-line segment of 936 km between Sonnagar and Dadri, and an electrified single-track segment of 401 km between Sahnewal in Punjab and Khurja in Uttar Pradesh.
    5. The alignment avoids towns: The EDFC detours around densely populated towns including Mirzapur, Allahabad, Kanpur, Etawah, Firozabad, Tundla, Hathras, Aligarh, Hapur, Meerut, Muzaffarnagar, Ambala, Rajpura, Sirhind, Doraha and Sahnewal.

    What traffic do the corridors actually carry?

    1. Containers dominate the west: Western corridor traffic mainly comprises ISO containers from JNPT and Mumbai Port in Maharashtra and from Pipavav, Mundra and Kandla ports in Gujarat. These move to Inland Container Depots (ICDs) in north India, mostly at Tughlakabad in Delhi, Dadri in Uttar Pradesh, Dhandari Kalan in Punjab and Khatuwas in Rajasthan.
    2. Bulk cargo is expected to follow: The western corridor is also expected to carry fertilisers, foodgrain, salt, coal, iron, steel and cement.
    3. Minerals dominate the east: The EDFC caters mostly to coal and mineral traffic originating in eastern India.

    What operational gain do the corridors deliver?

    1. Volume of movement: About 426 freight trains run daily across both corridors.
    2. Speed roughly doubles: The average speed of trains on the DFCs was over 50 kmph, double the average speed of freight trains on the non-DFC network.
    3. The recorded monthly figures: In April and May the average speed was 44.9 kmph and 44.7 kmph on the EDFC, and 53.6 kmph and 52.3 kmph on the WDFC.
    4. Three stated benefits: Separation from the passenger network gives the corridors reduced transit time, lower cost, and last-mile connectivity at certain locations.

    How were the corridors financed, and what comes next?

    1. A bilateral origin: The DFC project was first discussed at a Japan-India meeting in April 2005 and was included in the declaration of cooperation signed between the two sides. A feasibility study report followed in October 2007.
    2. Concessional debt carried most of the cost: Funding came through debt from the World Bank of Rs 14,900 crore and from the Japan International Cooperation Agency (JICA) of Rs 38,722 crore, with gross budgetary support meeting the remainder.
    3. A third corridor is planned: This year’s Budget announced a corridor connecting Dankuni in West Bengal to Surat in Gujarat, and its detailed project report is under preparation.

    Where does rail freight stand against its own target?

    1. The current modal share: Rail carries around 27 per cent of national freight traffic.
    2. The stated target: The National Rail Plan envisages raising that share to 45 per cent by 2030, which works out to 3,000 million tonnes.
    3. The present base: The Railways recorded its highest ever loading of 1,670 million tonnes in the 2025-26 financial year.

    Conclusion

    Completing the corridors changes what the network is capable of carrying; it does not by itself change what a shipper chooses. Rail wins cargo only where door-to-door cost and delivery reliability beat road, and both are decided at terminals, first-mile handling and pricing rather than on line-haul track. The gap between the current modal share and the National Rail Plan target is therefore a terminal and tariff problem now, not a track problem. The marker to watch is whether the next corridor is planned together with its feeder terminals rather than after them.

    Back2Basics: PM Gati Shakti National Master Plan

    1. What it is: A national master plan for multimodal connectivity, launched in October 2021, intended to end siloed infrastructure planning across ministries.
    2. How it works: It runs as a Geographic Information System based digital platform on which ministries and States map their projects on common layers, so alignments and utilities are visible to every planning agency at once.
    3. Who runs it: It is anchored in the Department for Promotion of Industry and Internal Trade under the Ministry of Commerce and Industry.
    4. What it is paired with: The National Logistics Policy, 2022 supplies the services and regulatory side of the same objective, which is lowering logistics cost as a share of output.

    Matching Previous Year Question

    “[2021, GS3, 15.0 marks] “Investment in infrastructure is essential for more rapid and inclusive economic growth.”Discuss in the light of India’s experience”

  • ‘Surprised by furore over GDP; methods, data already public’

    Why in the News

    The Ministry of Statistics and Programme Implementation (MoSPI) has defended the new Gross Domestic Product (GDP) series against charges of overestimation and of undisclosed methodology. Its stated position is that the downward revision of earlier years reflects better data rather than a systematic bias. The defence answers criticism that followed the release of first quarter 2026-27 GDP data, which put growth at 7.8 per cent, well above what most economists had anticipated. A former Finance Secretary argued that this print was possible only because the year-ago GDP data had been reduced, and that real growth was close to zero. The contest is over what a base revision is allowed to imply: whether lowering past output is better measurement or an admission that the old series had flattered growth.

    What is the new GDP series?

    1. A base revision of the national accounts: The series replaces the earlier 2011-12 based estimates, which had themselves replaced the 2004-05 series. It was released in February 2026.
    2. Built on a wider evidence base: The new series rests on a wider set of indicators and surveys than its predecessors, which is the ministry’s ground for calling it the best so far.
    3. Direct measurement of the informal sector: The old series estimated informal sector output through proxies. The new series uses direct, empirical annual surveys instead.

    Where did the dispute begin?

    1. An unexpected growth print: GDP data for the first quarter of 2026-27 showed growth of 7.8 per cent, and the ministry’s own reading is that this higher-than-expected number is what provoked the criticism.
    2. A challenge to the nominal numbers: A former Finance Secretary held that nominal GDP growth in April-June should have been 2.6 per cent and not 10.3 per cent, with real growth close to zero. Those figures were arrived at by comparing data from the old and the new GDP series.
    3. A data adequacy charge: A former Chief Economic Adviser held that the ministry lacks good and timely data on the informal economy.
    4. The timing is itself contested: The series has been in the public domain since February 2026, and the ministry’s position is that a controversy arriving six months later is surprising.

    What is the ministry’s defence?

    1. Estimation is not overestimation: The stated position is that calling the old numbers overestimates implies a systematic bias. GDP is an estimation made on the best data available at the time, and each successive series improves on the indicators the previous one used.
    2. Cross-series comparison is unwarranted: The ministry holds that any comparison between the old series and the new series is unwarranted, since the two rest on different indicator sets.
    3. The revision traces to one change: The primary reason for the downward revision in nominal GDP of previous years is the shift from proxy-based estimates for the informal sector to direct annual surveys.
    4. Survey figures, not proxies: Figures from the Annual Survey of Unincorporated Sector Enterprises (ASUSE, an annual enterprise survey covering informal, non-corporate businesses) and the Periodic Labour Force Survey (PLFS) are used even for quarterly GDP estimates.

    Which new data sources underpin the series?

    1. Sources that did not exist at the last revision: The Goods and Services Tax (GST) network, PLFS, ASUSE and the Public Financial Management System (PFMS) were unavailable when the earlier series was framed.
    2. Administrative digital data: Digital records such as e-Vahan, the national vehicle registration database, are now part of the input set.
    3. The gain is unlikely to repeat: The last ten years produced numerous new data sources, and the ministry’s assessment is that the next base revision, roughly five years away, will not see a comparable expansion.

    Has the methodology already been published?

    1. Three technical reports in February: Sub-committees of the Advisory Committee on National Accounts Statistics released reports on ‘Methodological Improvement for the Base Revision of GDP’, ‘Constant Price Estimates’, and ‘Incorporation of New Data Sources, Rates and Ratios’.
    2. Supporting series through the year: The new Index of Industrial Production (IIP) series was released in May, and output Producer Price Index (PPI) data starting 2022-23 was made public in June.
    3. The awaited document adds nothing new: The ministry’s position is that the ‘Sources and Methods’ document will only be a compilation of material already disclosed.

    Why is rapid growth said not to be felt on the ground?

    1. GDP is one indicator among several: Other factors, uncertainties and the global situation shape how an individual experiences the economy, so a single aggregate cannot settle the question.
    2. Aggregation hides dispersion: How a household sees prices differs from prices aggregated across the country and across regions, in the same way that felt inflation diverges from the measured rate.
    3. High-frequency indicators are offered as corroboration: Monthly consumption and production indicators for steel, cement, electricity and automobiles are cited as independent evidence of the pace of activity.

    Conclusion

    The argument is not really about arithmetic; it is about what a statistical revision is permitted to signal. A revision that lowers past output can be read as sharper measurement or as evidence that the earlier picture was inflated, and no amount of technical documentation adjudicates between those two readings. What would adjudicate is a published back-series placing old and new estimates on a consistent basis, so users can compare periods without splicing two incompatible sets themselves. Until that exists, every quarterly print will be argued twice, once on the number and once on the series it came from.

    Matching Previous Year Question

    “[2021, GS3, 10.0 marks] Explain the difference between computing methodology of India’s Gross Domestic Product(GDP) before the year 2015 and after the year 2015.”

  • [8th September 2026] The Hindu OpED: India can cut steel emissions before coal plants lock them in

    [8th September 2026] The Hindu OpED: India can cut steel emissions before coal plants lock them in

    Question (2025): “Write a review on India’s climate commitments under the Paris Agreement (2015) and mention how these have been further strengthened in COP26 (2021). In this direction, how has the first Nationally Determined Contribution (NDC) intended by India been updated in 2022?
    Linkage: Since steelmaking alone accounts for roughly 12% of India’s national greenhouse gas emissions, the investment choices made during this relining cycle will decide whether India can successfully honor its updated NDCs and progress toward its long-term Net-Zero targets

    Mentor Comment

    Indian steelmakers are approaching a replacement cycle in which more than 43 million tonnes per annum of blast furnace capacity falls due for relining before 2030. Relining is a capital intensive overhaul carried out roughly every two decades that extends a plant’s working life by another 15 to 20 years. A study published in Nature Climate Change finds that avoiding new blast furnaces, declining to reline young ones, and redirecting that money to electric arc furnaces could almost halve globally committed steel emissions. India’s steelmaking emissions are about 32% above the global average and account for nearly 12% of national greenhouse gas emissions. The tension is that the decision is not a technology problem but a timing problem: the furnaces chosen in this cycle fix the sector’s emissions until the 2040s, well before any of the promised hydrogen supply exists.

    How is steel made, and where do the emissions come from?

    1. The blast furnace and basic oxygen furnace route: Coking coal is burned in a blast furnace to smelt iron ore and strip its oxygen, producing a carbon rich liquid iron. That liquid is then blown with pure oxygen in a basic oxygen furnace to burn off impurities and yield steel.
    2. Why that route is carbon intensive: Coal here is not only the heat source but the chemical agent that removes oxygen from the ore, so the carbon dioxide is produced by the chemistry itself and not merely by combustion.
    3. The scrap and electric arc furnace route: An electric arc furnace melts steel scrap using electricity, skipping the ore reduction step entirely. Its emissions intensity is less than half that of the coal route.
    4. The direct reduced iron route: Direct reduced iron (DRI) strips oxygen from ore using a gas rather than coal, and the resulting solid iron is then melted in an electric furnace. Run on natural gas it emits around 1.2 tonnes of carbon dioxide per tonne of steel, and run on green hydrogen it is close to zero.

    How large is India’s steel emissions problem?

    1. Intensity above the world: India’s steelmaking emissions are roughly 32% higher than the global average, meaning each tonne produced here carries more carbon than a tonne produced elsewhere.
    2. Share of national emissions: The sector accounts for nearly 12% of India’s total greenhouse gas emissions.
    3. Scale and growth: India produced around 160 million tonnes of crude steel in FY 2025-26, the second highest in the world after China. Demand is driven by infrastructure development, construction and automotive manufacturing.
    4. Scrap scarcity limits the easy route: A developing economy that has not yet accumulated a large stock of old steel cannot recycle its way to lower emissions, because there is little scrap to feed electric arc furnaces.

    What does the National Mission on Green Steel actually promise?

    1. The intensity target: The Mission aims to bring steelmaking emissions intensity down from the current 2.55 to 2.65 tonnes of carbon dioxide equivalent (tCO2e) per tonne of crude steel to 2.2 tCO2e by 2029-30.
    2. The money behind it: A Rs 5,000 crore scheme to accelerate steel sector decarbonisation was announced last year and is set to launch in the coming months.
    3. The certification threshold: A certification scheme launched under the Mission in 2024 treats any steel made below 2.2 tCO2e as green, with the greenest band extending up to 1.6 tCO2e.
    4. The threshold sits above the world average: Global steelmaking averages around 1.85 tCO2e, so steel certified as India’s greenest can still be more carbon intensive than the world’s ordinary output.

    What does India’s furnace mix look like, and where is it headed?

    1. The current split: 43% of India’s crude steel comes from blast furnace and basic oxygen furnace plants, 22% from electric arc furnaces and 35% from electric induction furnaces, which use electromagnetic fields to process small batches of scrap or direct reduced iron.
    2. The projected drift: Blast furnace capacity is projected to rise to 56% of the mix by 2030 on the strength of planned new plants.
    3. The global picture: 70.4% of world steelmaking still uses the coal based route, with the remainder on electric arc furnaces.
    4. India’s mix is unusually heterogeneous: More than half of Indian output already comes from electricity based furnaces, which is a starting position most large producers do not have.

    Why does the relining decision lock in emissions for decades?

    1. Relining resets the clock: A blast furnace overhauled today keeps operating on coal for another 15 to 20 years, and more than 43 million tonnes per annum of capacity falls due for that overhaul before 2030.
    2. The plants are still on paper: The majority of new basic oxygen furnace plants planned in India have not broken ground, so switching them to direct reduced iron and electric arc furnace designs is a redirection of committed money rather than a fresh demand for capital.
    3. Sunk cost makes reversal politically hard: Once large sums are invested in a coal based asset, closing it early becomes a fight over stranded value rather than an engineering decision.
    4. The abatement is cheap only now: Emissions avoided at the investment stage cost far less than emissions removed later through bioenergy with carbon capture and storage or carbon dioxide removal technologies.

    What do the modelled transition pathways show?

    1. What was modelled: Two global steel sector pathways consistent with 1.5 degrees Celsius of warming by the end of the century, allowing an overshoot of up to 1.7 degrees Celsius.
    2. Who drives the outcome: China and India dominate the dynamics of the fast transition scenario, because their near term coal based investments far exceed those of every other region.
    3. The cost of moving slowly: In the slow transition scenario young blast furnaces are relined and announced plants are built as planned, which forces heavier reliance on carbon dioxide removal technologies that remain immature, plus deeper cuts in other sectors.
    4. The fuel sequence India would follow: The model has India running direct reduced iron and electric arc furnace plants mainly on natural gas until 2040 to 2045, switching to hydrogen once it becomes cost competitive.
    5. The reframing: Steel is described less as a hard to abate sector than as a sector facing a hard to abate investment barrier, since the technology already exists and only the green premium stands in the way.

    Is India’s certified green steel actually green?

    1. The brackets are wide: The certification bands are broad enough that steel qualifying as green can still be more carbon intensive than ordinary steel made elsewhere, which weakens the label as a signal.
    2. India defined the term first: No other country has set out a formal definition of green steel, so the taxonomy itself is an initiative rather than a copy.
    3. The demand side was never built: Certification creates a supply of labelled steel without creating any buyer obliged to prefer it, so the premium has no market to be recovered in.
    4. Uptake so far: ArcelorMittal Nippon Steel India became the first integrated steel producer to receive green steel certification in February this year, and 89 steel units held the certification as of 31 March, covering 12.34 million tonnes of production.

    What is pushing steelmakers to move now?

    1. The export penalty: The European Union’s Carbon Border Adjustment Mechanism came into effect in January, imposing steep penalties on carbon intensive imports including India’s high emission steel.
    2. The commercial response: India has been seeking alternative markets and boosting domestic consumption, while compliance obligations push producers to reconsider which furnace technology to invest in.
    3. Public money for hydrogen: The Union Ministry of New and Renewable Energy funded three pilot green hydrogen projects in March totalling more than Rs 400 crore, to validate the technical feasibility of using 100% green hydrogen in furnaces.
    4. The first commercial link: JSW Energy commissioned India’s largest commercial scale green hydrogen plant at Vijayanagar in Karnataka last year to supply 100% green hydrogen to the adjoining JSW Steel direct reduced iron unit.

    Challenges to steel decarbonisation in India

    1. The bridge fuel carries its own lock in: Natural gas based direct reduction substitutes an imported fuel for a domestic one, exposing the sector to supply shortages, price shocks and gas infrastructure that is stranded once hydrogen arrives. Eg. India imports roughly half its natural gas, and delivered prices swung sharply through the European supply crisis.
    2. The thermal power precedent: Once heavy capital sits in a coal asset, the owner resists closure in order to recover the investment, which is how India acquired thermal plants that are uneconomic yet politically impossible to retire. Eg. Several state generating stations continue running below viable plant load factors rather than shutting down.
    3. Electricity based steel is only as clean as the grid: An electric arc furnace shifts emissions from the furnace to the power station, so in a coal heavy grid the accounting gain outruns the physical one. Eg. Coal still supplies the majority of India’s generation, so an induction furnace running at night draws largely thermal power.
    4. Green hydrogen is not yet affordable at steel scale: Running a direct reduction plant on hydrogen today costs far more than running it on gas, and a steel plant needs hydrogen in volumes no pilot has demonstrated. Eg. Existing Indian projects supply a single adjoining unit rather than a cluster of plants.
    5. Iron ore quality constrains the switch: Direct reduction needs high grade iron ore or pellets, and much of India’s ore is not of that grade, so the route requires beneficiation capacity that does not yet exist. Eg. Indian producers rely on lower grade ore fines that suit blast furnaces but not shaft furnaces.

    Way Forward

    1. Make gas based DRI hydrogen ready: Design gas based direct reduction plants as hydrogen ready at the outset, so the shaft furnace does not need replacing at the point of switching.
    2. Plan for coal asset retirement: Attach a stated retirement date and a transition financing package to every new coal based approval, so the exit is priced when the asset is sanctioned.
    3. Link steel decarbonisation with clean electricity: Tie decarbonisation scheme support to a round the clock renewable supply contract for the plant rather than to the furnace type alone.
    4. Aggregate green hydrogen demand: Aggregate demand across neighbouring plants into a single hydrogen offtake contract, so an electrolyser project can be financed against assured volume.
    5. Build beneficiation and pelletisation capacity: Include ore beneficiation and pelletisation capacity within the decarbonisation scheme’s eligible expenditure, not only the furnace itself.

    Conclusion

    The steel sector’s emissions are being decided by a maintenance schedule rather than by a climate policy. Every furnace relined in this cycle removes a plant from the reachable set for two decades, and every plant still on paper can be redirected at no extra cost. The unresolved tension is that India has defined green steel and funded the technology without creating a single buyer obliged to pay for it, so the supply side moves while the demand side does not. The measurable thing to watch is how much of the 43 million tonnes per annum falling due before 2030 is relined rather than replaced.

    Back2Basics: Carbon Border Adjustment Mechanism

    1. What it is: A levy charged by an importing jurisdiction on the greenhouse gases embedded in an imported good, set at the carbon price the importing jurisdiction’s own producers already pay.
    2. Why it exists: It is intended to prevent carbon leakage, meaning the shifting of production to countries with weaker climate rules rather than an actual reduction in emissions.
    3. What it covers: The European Union’s version applies to iron and steel, aluminium, cement, fertilisers, electricity and hydrogen, the goods with the highest embedded emissions per unit of trade value.
    4. How it is contested: Developing country exporters argue the levy shifts the cost of the importing country’s climate policy onto producers who bear no comparable historical responsibility.
  • In a first, alternative fuel vehicles outsell petrol cars in India

    In a first, alternative fuel vehicles outsell petrol cars in India

    Why in the News

    Alternative fuel vehicles outsold petrol cars in India’s passenger vehicle market for the first time in August 2026. Compressed natural gas (CNG), hybrid and electric vehicles together accounted for 41.95 percent of passenger vehicle retail sales against petrol’s 40.85 percent. The month also set a volume record across every segment, with 24,23,201 units retailed in all. The crossover was reported in the monthly retail registration data of the Federation of Automobile Dealers Associations (FADA). Petrol remains the largest single fuel in the market, so the crossover is three powertrains adding up rather than one substitute displacing petrol.

    What does the August 2026 retail data show across segments?

    1. A record month by volume: Total retail sales reached 24,23,201 units, a rise of 17.51 percent year on year. Two wheelers, passenger vehicles, commercial vehicles, tractors and three wheelers each set a fresh August record.
    2. Growth was uneven across segments: Wheeled construction equipment grew 31.45 percent, two wheelers 19.69 percent, passenger vehicles 16.14 percent and commercial vehicles 14.45 percent. Three wheelers grew 8.64 percent and tractor sales were effectively flat at 0.84 percent.
    3. Segment volumes set new marks: Two wheelers retailed 17,14,610 units, the best August since 2018. Passenger vehicles crossed the four lakh mark in an August for the first time at 4,02,398 units, and commercial vehicles came in at 90,769 units.
    4. The lighter commercial categories led: Light commercial vehicles grew 15.32 percent year on year, heavy commercial vehicles 13.98 percent and medium commercial vehicles 10.38 percent. Dealers attribute the demand to infrastructure execution, mining and logistics linked to e-commerce, alongside steady financing.
    5. Sales fell against the previous month: Retails were 6.48 percent lower than in July 2026. The seasonal monsoon lull and a festival calendar that shifted Ganesh Chaturthi and pushed Onam linked buying into September account for the fall.
    6. Dealer stock is building: Passenger vehicle inventory rose by a further five days over the end of July to about 38 to 40 days, against the 21 day benchmark the dealers’ body recommends. Higher stock than the previous month was reported by 56 percent of passenger vehicle dealers.

    Why does the change in fuel mix matter more than the volume record?

    1. The alternative fuel share is three distinct powertrains: CNG vehicles accounted for 25.28 percent of passenger vehicle sales, hybrids 9.04 percent and electric vehicles 7.63 percent. CNG alone is more than three times the electric share.
    2. No single alternative fuel has replaced petrol: Petrol is still the largest individual fuel in the segment. The threshold crossed is a share of the market held collectively, not a substitution of one fuel by another.
    3. Running cost is the stated driver: Dealers attribute the movement of petrol buyers towards CNG, hybrids and electric vehicles to running cost economics rather than to purchase price.
    4. Ethanol blending has become a demand factor: Continuing consumer hesitation around the E20 transition, the shift to petrol blended with 20 percent ethanol, is nudging buyers away from petrol. Part of the shift is avoidance of an uncertain fuel rather than preference for a new powertrain.

    How far has electrification moved beyond passenger cars?

    1. Electric two wheelers crossed a tenth of their market: Their share reached 10.68 percent against 7.66 percent a year earlier. It was the first time the 10 percent mark was crossed in a non festival month.
    2. Electric commercial vehicles hit a record share: Their share rose to an all time high of 5.18 percent from 2.06 percent a year earlier, with monthly volumes setting a fresh record.
    3. Three wheelers are already structurally electric: Electric penetration in the three wheeler segment stands at 65.30 percent. Electrification there has stopped being a transition and become the default.

    Challenges to the shift to alternative fuel vehicles

    1. Charging access lags electric vehicle sales: Public charging remains concentrated in large cities and on a few highway corridors, so buyers without private parking carry the highest switching cost. Eg. The PM Electric Drive Revolution in Innovative Vehicle Enhancement (PM E-DRIVE) scheme, notified in 2024, set aside about Rs 2,000 crore of its outlay specifically for public charging infrastructure.
    2. CNG supply is geographically uneven: The fuel is dense in a few city gas distribution areas and thin elsewhere, which caps how far its cost advantage can travel. Eg. Delhi and Gujarat hold a large share of India’s CNG stations while much of eastern India remains sparsely covered.
    3. Hybrid incentives vary by State: Hybrids sit outside most electric vehicle subsidy schemes, so their running cost advantage depends on where the vehicle is registered. Eg. Uttar Pradesh waived the registration tax on strong hybrid vehicles in 2024, a concession most States do not offer.
    4. Battery manufacture depends on imported inputs: Cell manufacturing and the lithium, cobalt and graphite feeding it are largely imported, so electric vehicle prices track external supply. Eg. The National Critical Mineral Mission, launched in 2025, was created to secure exactly these inputs.
    5. A share built on hesitation can reverse: Buyers moving away from petrol over blending concerns can move back once those concerns are answered. Eg. E20 petrol was rolled out across the country by 2025 amid disputes over fuel efficiency and engine compatibility in vehicles built for lower blends.

    Way Forward

    1. Expand public charging infrastructure: Tie charging point rollout targets to electricity distribution licence areas, so coverage follows the grid rather than following sales volumes.
    2. Ensure wider CNG availability: Make station rollout milestones an enforceable condition of every city gas distribution licence rather than a projected commitment.
    3. Create uniform hybrid incentives: Settle one national treatment of hybrids in the motor vehicle tax structure so the segment is not priced by State discretion.
    4. Strengthen domestic battery value chains: Link production linked incentive disbursal for cells to domestic value addition milestones rather than to assembly volumes.
    5. Build evidence based consumer confidence: Publish independent test results on efficiency loss and material compatibility by vehicle vintage, so the choice rests on evidence rather than uncertainty.

    Conclusion

    The fuel mix has moved ahead of the infrastructure that has to support it. The festival quarter is the next test, when discounting and volume peak together and dealer stock is either absorbed or deepens. The second marker is whether the alternative fuel share holds once the ethanol blending question is settled, because a share built partly on avoidance is not the same as a share built on preference.

    Back2Basics: Federation of Automobile Dealers Associations (FADA)

    1. What it is: FADA is the apex national body of automobile retail dealers in India, representing dealerships across vehicle segments.
    2. What its data measures: It compiles retail sales from vehicle registration records at regional transport offices. Its figures therefore track vehicles sold to customers, not vehicles dispatched from factories to dealerships.
    3. Why the distinction matters: Manufacturer dispatch numbers can rise while retail sales stall, with the difference sitting as unsold stock at dealerships. FADA’s monthly inventory reading is what exposes that gap.

    [2025] Consider the following types of vehicles:

    I. Full battery electric vehicles

    II. Hydrogen fuel cell vehicles

    III. Fuel cell electric hybrid vehicles

    How many of the above are considered as alternative (powertrain) vehicles?

    (a) Only one

    (b) Only two

    (c) All the three

    (d) None

  • Defence Acquisition Council clears capital acquisition proposals worth about ₹1.10 lakh crore

    Defence Acquisition Council clears capital acquisition proposals worth about ₹1.10 lakh crore

    Why in the News

    The Defence Acquisition Council (DAC), chaired by Defence Minister Rajnath Singh, has accorded Acceptance of Necessity (AoN) for defence acquisition proposals worth around ₹1.10 lakh crore.

    • About 98% of the approved procurements are planned from Indian industry, reinforcing the government’s focus on defence indigenisation and self reliance.

    What is the DAC?

    • Defence Acquisition Council (DAC) is the highest decision-making body in the Ministry of Defence for defence procurement.
    • It was constituted in 2001 following the recommendations of the Group of Ministers after the Kargil War.
    • Chairperson: Union Defence Minister.
    • It deals with major decisions related to acquisition of capital assets for the Armed Forces.

    What has the DAC approved?

    Indian Army

    • CBRN reconnaissance vehicles: Detect, identify, monitor and mark areas contaminated by chemical, biological, radiological and nuclear agents.
    • High Mobility Vehicles (HMVs): Improve operational mobility and logistics in difficult terrain.
    • Self Propelled Mechanical Mine Layers (MMLs): Provide faster mine laying capability.
    • Advanced Light Helicopters (ALHs): Support operations across diverse terrains.
    • Trawl tanks: Facilitate movement through mine contaminated areas.
    • Sarvatra Bridge System: Provides rapid bridging and crossing capability during military operations.

    Indian Navy

    • Arudhra radars: To replace existing air route surveillance radars at naval air stations.
    • Marine Gas Turbines (MGTs): Indigenous design, development and procurement for warship propulsion, reducing dependence on foreign vendors.

    Indian Air Force and Defence Forces

    • Proposals to enhance capabilities of fighter aircraft, transport aircraft and helicopters.
    • Ground Based Multi Purpose Jammers (GBMPJ): Provide jamming capability against adversary radars.
    • Defence Forces Secure Access Card (DEFSAC): Replace paper based identity cards, passes and permits with interoperable RFID based smart cards.

    Why is Defence Indigenisation Important?

    • Strategic autonomy: Reduces dependence on foreign suppliers for critical military systems.
    • Operational security: Minimises vulnerabilities arising from dependence on external vendors.
    • Domestic manufacturing: Creates demand for Indian defence companies and strengthens the defence industrial base.
    • Technology development: Encourages indigenous R&D and advanced defence technologies.
    • Economic benefits: Generates skilled employment and strengthens domestic supply chains.

    Prelims Pointers

    • Total value: Around ₹1.10 lakh crore.
    • DAC: Defence Acquisition Council, chaired by the Defence Minister.
    • AoN: Acceptance of Necessity, the initial approval for a defence procurement proposal.
    • CBRN: Chemical, Biological, Radiological and Nuclear.
    • ALH: Advanced Light Helicopter.
    • MGT: Marine Gas Turbine.
    • DEFSAC: Defence Forces Secure Access Card.
    • 98%: Approximately 98% of the approved procurement value is planned to be sourced from Indian industry.

    [2026] Which of the following items of defence hardware is/are manufactured in India?
    1.Su-30 MKT Fighter Jects
    2.T-90 MKI-III Tanks
    3.Akula Class Submarine
    Select the answer using the code given below:

    [A] 1 and 2

    [B] 1 and 3

    [C] 1 only

    [D] 2 only

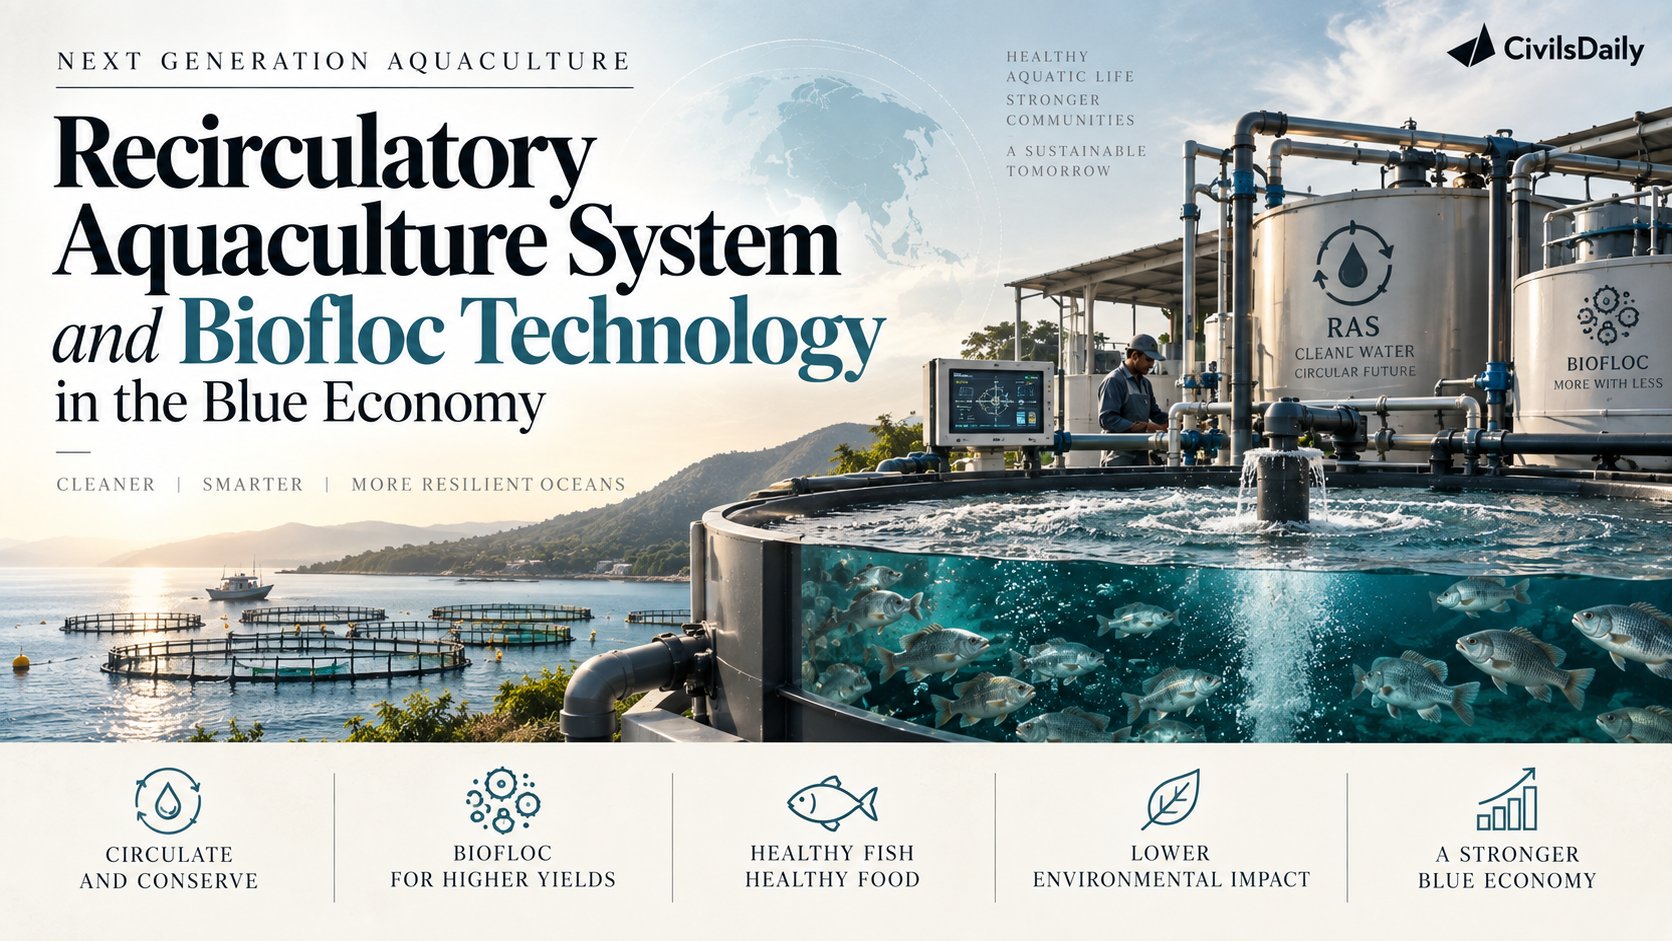
  • Next generation aquaculture: Recirculatory Aquaculture System and Biofloc technology in the Blue Economy

    Next generation aquaculture: Recirculatory Aquaculture System and Biofloc technology in the Blue Economy

    Why in the News

    India is the world’s second-largest fish producer and second-largest aquaculture producer. India is also the largest producer and exporter of shrimp. The fisheries sector supports the livelihoods of nearly 3 crore fishers and fish farmers. Government initiatives are promoting Recirculatory Aquaculture Systems (RAS) and Biofloc technology under PM Matsya Sampada Yojana (PMMSY).

    Growth of India’s Fisheries Sector

    • Annual fish production increased from 95.79 lakh tonnes in 2013-14 to 198 lakh tonnes in 2024-25.
    • Inland fisheries and aquaculture production increased by 147%, from 61.36 lakh tonnes to 151.60 lakh tonnes.
    • Seafood exports increased from ₹30,213 crore in 2013-14 to ₹73,890 crore in 2025-26.
    • Since 2015, cumulative government investments exceeding ₹39,272 crore have supported the fisheries sector.

    Recirculatory Aquaculture System (RAS)

    • RAS is an intensive fish farming system based on water treatment and recirculation.
    • Water is continuously treated and reused to maintain suitable conditions for fish growth.
    • It can recycle up to 90-95% of water.
    • Enables fish farming in areas where conventional aquaculture may not be feasible.
    • Allows production units to be located closer to urban markets and export hubs.
    • Supports year-round fish production, better biosecurity and controlled farming conditions.

    Biofloc Technology

    • Biofloc is an intensive aquaculture technique that uses beneficial microorganisms.
    • Microorganisms help improve water quality by utilising organic wastes and nutrients.
    • The microbial biomass forms flocs, which can also provide nutritional benefits to cultured fish.
    • Enables intensive production with efficient use of water and nutrients.
    • Particularly useful where land and water availability are limited.

    Government Support under PMMSY

    • 9,467 RAS units have been approved.
    • 4,573 Biofloc units have been approved.
    • Around ₹4,120 crore has been invested under PMMSY for these technologies.
    • These systems are helping shift aquaculture towards intensive, commercially viable and resource-efficient production.

    Importance for Blue Economy

    • Resource efficiency: Reduces water consumption and improves waste utilisation.
    • Higher productivity: Facilitates intensive and year-round fish farming.
    • Geographical expansion: Allows aquaculture in diverse agro-climatic conditions.
    • Export competitiveness: Improves quality, traceability and biosecurity.
    • Employment: Creates opportunities across production, processing, marketing and exports.
    • High-value aquaculture: Supports species such as shrimp, trout, seabass, tilapia, murrel and pangasius.
    • Entrepreneurship: Promotes specialised activities such as ornamental fish farming.

    Geographical Applications

    • Controlled systems: Ornamental fish and other specialised aquaculture activities.
    • Jammu & Kashmir, Ladakh, Uttarakhand and Himachal Pradesh: Cold-water aquaculture, particularly trout.
    • Saline and brackish-water areas: Export-oriented shrimp farming.

    [2023] With reference to the role of biofilters in Recirculating Aquaculture System, consider the following statements:

    1. Biofilters provide waste treatment by removing uneaten fish feed.

    2. Biofilters convert ammonia present in fish waste to nitrate.

    3. Biofilters increase phosphorus as nutrient for fish in water.

    How many of the statements given above are correct?

    (a) Only one

    (b) Only two

    (c) All three

    (d) None.