Mains Ready By December. Smash Mains & Smash PYQ Admissions Open

GS Paper: GS3-18.Conservation, Environmental Pollution and Degradation, Environmental Impact Assessment.

  • Cost of convenience, health hazards a a side effect of using digital tools

    Introduction

    India’s embrace of the digital revolution has been rapid and transformative. From smartphones to smart homes, electronics have become integral to urban living. However, this transformation carries a dark underbelly: the mounting crisis of e-waste. In 2025, India generated 2.2 million tonnes of e-waste, becoming the third-largest generator globally, after China and the United States. Despite having a formal recycling capacity of over 2.2 million MT, more than half of India’s e-waste is still processed informally, exposing millions to toxic substances. The issue is not just environmental but also a public health catastrophe, disproportionately affecting the poor and marginalised.

    Why is e-waste in the news?

    India’s e-waste problem is no longer a distant warning but an immediate crisis. The country has seen a 150% surge in e-waste since 2017–18 (0.71 MT to 2.2 MT in 2025), with projections of doubling by 2030. Cities like Seelampur (Delhi), Moradabad (UP), and Bhiwandi (Maharashtra) have emerged as hotspots of informal recycling, where toxic fumes and crude dismantling methods poison both workers and residents. Despite 322 formal recycling units, informal handlers dominate the sector, creating one of the sharpest contrasts between policy design and ground reality.

    The Escalating Burden of E-Waste

    1. Third-largest generator: India stands only behind China and the U.S., producing 2.2 MT of e-waste in 2025.
    2. Rapid growth: A 150% surge in seven years, expected to double by 2030.
    3. Urban hotspots: Over 60% of e-waste originates from just 65 cities; major hubs include Seelampur, Mustafabad, Moradabad, and Bhiwandi.

    Why informal recycling is a ticking time bomb

    1. Crude methods: Manual dismantling, open burning, and acid leaching without protective equipment.
    2. Toxic substances: Release of over 1,000 hazardous chemicals, including heavy metals (lead, cadmium, mercury, chromium), POPs (dioxins, furans), and fine particulate matter (PM₂.₅ and PM₁₀).
    3. Alarming air quality: PM₂.₅ levels in Seelampur exceed 300 µg/m³ — over 12 times higher than WHO’s safe limit of 25 µg/m³.

    How does e-waste impact human health?

    1. Respiratory illnesses: Workers show 76–80% prevalence of chronic bronchitis, asthma, persistent coughing (MDPI Applied Sciences, 2025).
    2. Neurological damage: Lead exposure linked to cognitive impairment, reduced IQ, attention deficits. WHO warns millions of children are at risk.
    3. Skin & ocular disorders: Rashes, burns, dermatitis; in Guiyu (China), exposure linked to miscarriages and preterm births.
    4. Genetic and systemic effects: DNA damage, oxidative stress, altered immune functions; children show higher vulnerability.
    5. Syndemic environment: E-waste risks compound poverty, malnutrition, and unsafe housing, worsening outcomes for urban poor.

    Policy response: Progress and gaps

    1. E-Waste (Management) Rules, 2022: Strengthened Extended Producer Responsibility (EPR), mandatory registration, incentives for formalisation.
    2. Weak enforcement: As of 2023–24, only 43% of e-waste was officially processed.
    3. Legal hurdles: Capping of EPR credit prices led to legal disputes with manufacturers.
    4. Gap: Informal handlers still dominate, undermining scientific recycling capacity.

    The Way Forward

    1. Formalise the informal: Integrate kabadiwalas through skill certification, PPE provision, healthcare, social security.
    2. Strengthen enforcement: Empower Pollution Control Boards, mandate digital tracking & audits.
    3. Expand medical surveillance: Health camps and long-term studies, especially on children in hotspots.
    4. Foster innovation: Promote local recycling technologies, decentralised treatment hubs.
    5. Raise awareness: Mass campaigns and school-level education on e-waste.

    Conclusion

    India’s digital empowerment cannot come at the cost of environmental collapse and human suffering. The e-waste crisis is not only a question of waste management but also of justice and public health. Unless India formalises its informal sector, strengthens enforcement, invests in technology, and raises awareness, the cost of convenience will continue to erode both ecosystems and human dignity.

    PYQ Relevance

    [UPSC 2018] What are the impediments in disposing the huge quantities of discarded solid wastes which are continuously being generated? How do we remove safely the toxic wastes that have been accumulating in our habitable environment?

    Linkage: The article on e-waste directly links to this PYQ as it highlights impediments like dominance of informal recycling, weak enforcement of E-Waste Rules, and lack of awareness, while also suggesting safe disposal measures such as formalisation, digital tracking, PPE use, decentralised hubs, and scientific recycling methods.
  • Geoengineering Proposals for Polar Regions found flawed

    Why in the News?

    A University of Exeter study found five major polar geoengineering methods ineffective and risky, failing criteria for responsible climate intervention.

    Geoengineering in Polar Regions: Study Findings

    Method Description Intended Benefit Key Findings & Limitations
    Stratospheric Aerosol Injection (SAI) Artificially releasing aerosols (SO₂, sulphur particles, TiO₂, CaCO₃) into the stratosphere to reflect sunlight. Reduce surface temperatures by blocking solar radiation.
    • Ineffective in polar winters (no sunlight) and of limited use in summers (ice already highly reflective).
    • Sudden termination can cause “termination shock” with rapid global warming.
    • Potential to disrupt global weather cycles, harming food and water security.
    • No global governance on costs or liability. Estimated cost: $55M/year per country (if 30 nations share).
    Sea Curtains / Sea Walls Massive buoyant barriers anchored to seafloor to block warm currents from reaching ice sheets. Slow melting of glaciers by insulating them from warm water.
    • Technically near-impossible in remote seas like Amundsen (Antarctica).
    • Extremely high costs — >$1 billion/km.
    • Threatens marine circulation, fish migration, and nutrient cycles.
    • Installation in harsh polar seas only possible for few months a year; requires custom-built ships.
    • Risk of toxic materials leaching into ocean.
    Sea Ice Management (Microbeads) Sprinkling glass microbeads over sea ice to increase albedo (reflectivity) and thicken ice. Preserve summer ice, slow down warming.
    • Requires 360M tonnes of beads annually — equal to world’s plastic production.
    • Major logistical and emissions challenges.
    • Beads dissolve quickly, reducing effectiveness.
    • Some studies show beads absorb sunlight, causing net warming.
    • Costly: $500B/year for Arctic deployment; requires 100M pumps, huge energy draw.
    Basal Water Removal Pumping subglacial meltwater from under Antarctic glaciers. Reduce glacier sliding, thus slowing sea-level rise.
    • Flawed logic: subglacial water is constantly replenished by frictional/geothermal heating.
    • Highly emissions-intensive and energy-consuming.
    • Requires continuous monitoring, maintenance, and heavy infrastructure.
    • Long-term sustainability questioned.
    Ocean Fertilisation Adding nutrients (e.g., iron) to stimulate phytoplankton growth, enhancing CO₂ absorption. Sequester more carbon in oceans.
    • No control over which phytoplankton species dominate, creating food chain imbalances. 
    • Could harm marine biodiversity and alter global nutrient cycles.
    • Needs deployment at massive, impractical scale.
    • Risk of side-effects outweighs uncertain benefits.


    [UPSC 2020] Consider the following activities:

    1. Spreading finely ground basalt rock extensively on farmlands

    2. Increasing the alkalinity of oceans by adding lime

    3. Capturing carbon dioxide released by various industries and pumping it into abandoned subterranean mines in the form of carbonated waters

    How many of the above activities are often considered and discussed for carbon capture and sequestration?

    Options: (a) Only one (b) Only two (c) All three* (d) None


  • Bihar adds 2 more Wetlands to Ramsar List

    Why in the News?

    India has added two new wetlands in Bihar, Gokul Jalashay (Buxar district) and Udaipur Jheel (West Champaran district), to the global Ramsar list of Wetlands of International Importance.

    Important Facts:

    • With this, India’s Ramsar sites rise to 93, consolidating its top rank in Asia and third in the world, after the UK (176) and Mexico (144).
      • Bolivia has the largest Ramsar wetland area (Llanos de Moxos wetlands – 6.9 million ha).
    • India’s Ramsar sites have expanded from 26 in 2012 to 93 in 2025, covering 13.6 lakh hectares, with 51 sites added since 2020.
    • Globally, there are 2,544 Ramsar sites.

    Facts about the two Wetlands:

    1. Gokul Jalashay (Buxar District):

      • Oxbow lake spread over 448 hectares on the southern edge of the Ganga River.
      • Acts as a flood buffer during high water events.
      • Supports 50+ bird species and provides livelihoods through fishing, farming, and irrigation.
    2. Udaipur Jheel (West Champaran District):

      • Oxbow lake covering 319 hectares, part of the Udaipur Wildlife Sanctuary ecosystem, formed by the Gandaki River.
      • Enhances ecological connectivity and supports the Central Asian Flyway for migratory birds.

    About the Ramsar Convention:

    • Establishment: Signed on 2 February 1971 in Ramsar, Iran.
    • Objective: Provide a framework for conservation and wise use of wetlands and their resources.
    • Functions:
      • Identify and designate wetlands of international importance.
      • Promote effective management of wetlands.
      • Foster international cooperation for conservation.
    • Members: 173 countries (as of 2025).
    • India and Ramsar:
      • India joined in 1982.
      • First Ramsar site: Chilika Lake, Odisha (1981).
      • Current total: 93 sites (Sept 2025), covering 13,60,718 hectares.
      • Growth: From 26 sites in 2012 to 93 in 2025 (51 added since 2020).
      • State-wise: Tamil Nadu has the highest (20), followed by Uttar Pradesh (10).
      • About 10% of India’s total wetland area is under Ramsar listing.
    • Montreux Record: List of Ramsar sites under threat of ecological change.
      • 48 sites globally (2025).
      • 2 Indian sites included: Keoladeo National Park (Rajasthan) and Loktak Lake (Manipur).
    • World Wetlands Day: Celebrated on February 2nd every year.
      • 2025 Theme: “Protecting Wetlands for Our Common Future”.

    Criteria for Declaration (9 Criteria):

    A wetland can be declared a Ramsar site if it meets at least one of these:

    1. Has unique, rare, or representative wetland types.
    2. Supports vulnerable, endangered, or endemic species.
    3. Provides critical habitat for waterfowl, especially during migration.
    4. Contains significant ecological, botanical, zoological, limnological, or hydrological features.
    5. Supports biodiversity conservation and scientific research.
    6. Provides ecosystem services like flood control, groundwater recharge, and water purification.
    7. Has cultural, spiritual, or recreational importance.
    8. Ensures sustainable livelihoods for local communities.
    9. Faces threats requiring international cooperation for conservation.
    [UPSC 2022] Consider the following pairs:

    Wetland/Lake Location

    1. Hokera Wetland — Punjab 2. Renuka Wetland — Himachal Pradesh

    3. Rudrasagar Lake — Tripura 4. Sasthamkotta Lake — Tamil Nadu

    How many pairs given above are correctly matched?

    Options: (a) Only one pair (b) Only two pairs* (c) Only three pairs (d) All four pairs


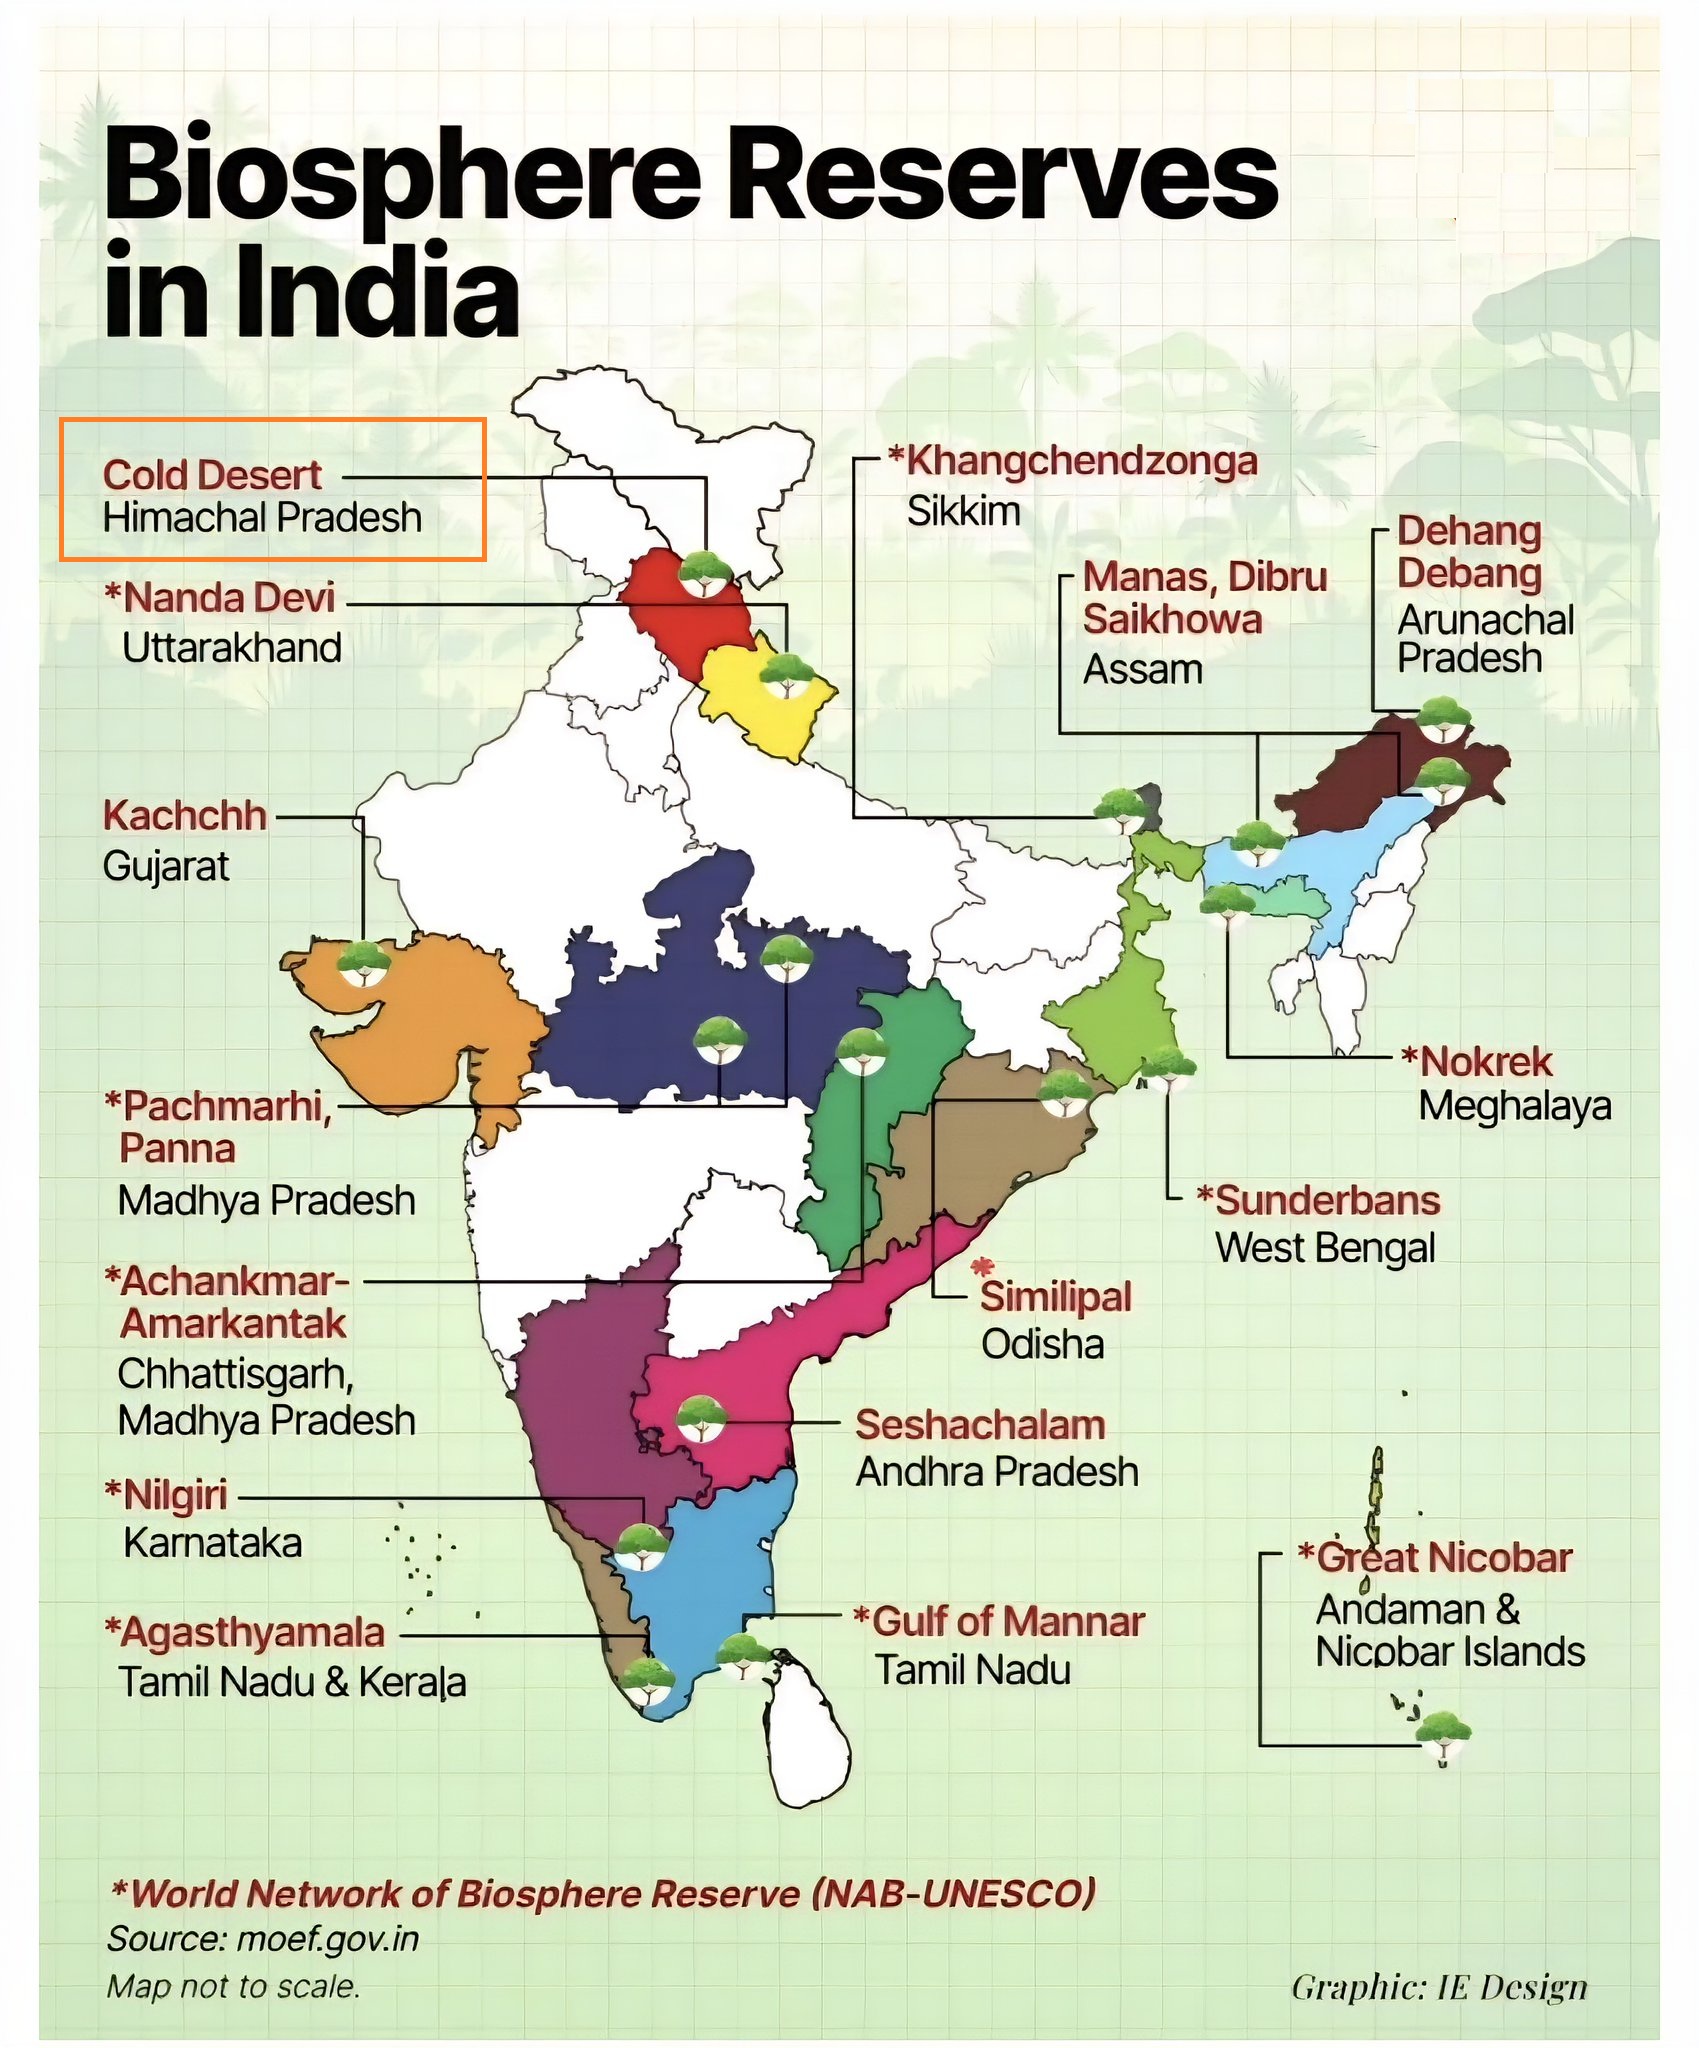
  • Cold Desert named India’s 13th UNESCO Biosphere Reserve

    Why in the News?

    UNESCO added India’s Cold Desert Biosphere Reserve (CDBR) to the World Network of Biosphere Reserves (WNBR) under the Man and the Biosphere (MAB) programme.

    With this, India now has 13 UNESCO-recognized biosphere reserves out of 18 designated nationally.

    What are UNESCO Biosphere Reserves?

    • Overview: Sites integrating biodiversity conservation + cultural heritage + sustainable development.
    • Programme: MAB (1971).
    • Designation Criteria:
      • Must include a protected core zone.
      • Must represent a unique biogeographical unit.
      • Involve local communities in conservation.
      • Potential to preserve traditional lifestyles.
    • Functions: Conservation, Development, Logistic Support.
    • Global Network (WNBR): 785 sites, 142 countries (2025); 7.4 million sq. km (~5% Earth’s surface); home to 275 million people.

    About Cold Desert Biosphere Reserve (CDBR):

    • Location: Lahaul–Spiti (Himachal Pradesh), part of Trans-Himalayan biogeographic province.
    • Constituents: Includes Pin Valley National Park, Kibber Wildlife Sanctuary, Chandratal Wetland, Sarchu Plains.
    • Biodiversity:
      • Flora:  732 vascular plants, incl. 30 endemic, 47 medicinal plants (Amchi / Sowa Rigpa).
      • Fauna: Snow leopard (flagship), Tibetan wolf, Himalayan ibex, blue sheep (800+ in Spiti), Himalayan snowcock, golden eagle, bearded vulture.
    • Communities: ~12,000 people; practice yak & goat herding, barley/pea farming, Tibetan herbal medicine, Buddhist monastic councils.
    • Significance: Boosts eco-tourism, climate research, community-led conservation, sustainable livelihoods. Supports climate-resilient development in fragile ecosystems.

    cold desert biosphere reserve

    Biosphere Reserves in India:

    • Total: 18 designated, of which 13 in UNESCO-WNBR (as of 2025).
    • First: Nilgiri BR (1986); Largest: Gulf of Kachchh (Gujarat); Smallest: Dibru-Saikhowa (Assam).
    • Scheme: Launched 1986; implemented by MoEFCC under MAB Programme.
    • Three zones: Each biosphere reserve is organised into-
      1. Core zone (strictly protected),
      2. Buffer zone (limited human activity such as research, grazing, and tourism permitted), and
      3. Transition zone (sustainable human settlements and economic activities allowed).
    • Funding: 90:10 (NE & Himalayan states); 60:40 (others).
    [UPSC 2019] Which of the following are in Agasthyamala Biosphere Reserve?

    Options: (a) Neyyar, Peppara and Shendurney Wildlife Sanctuaries; and Kalakad Mundanthurai Tiger Reserve*

    (b) Mudumalai, Sathyamangalam and Wayanad Wildlife Sanctuaries; and Silent Valley National Park

    (c) Kaundinya, Gundla Brahmeswaram and Papikonda Wildlife Sanctuaries; and Mukurthi National Park

    (d) Kawal and Sri Venkateswara Wildlife Sanctuaries; and Nagarjunasagar-Srisailam Tiger Reserve


  • What are ‘Planetary Boundaries’?

    Why in the News?

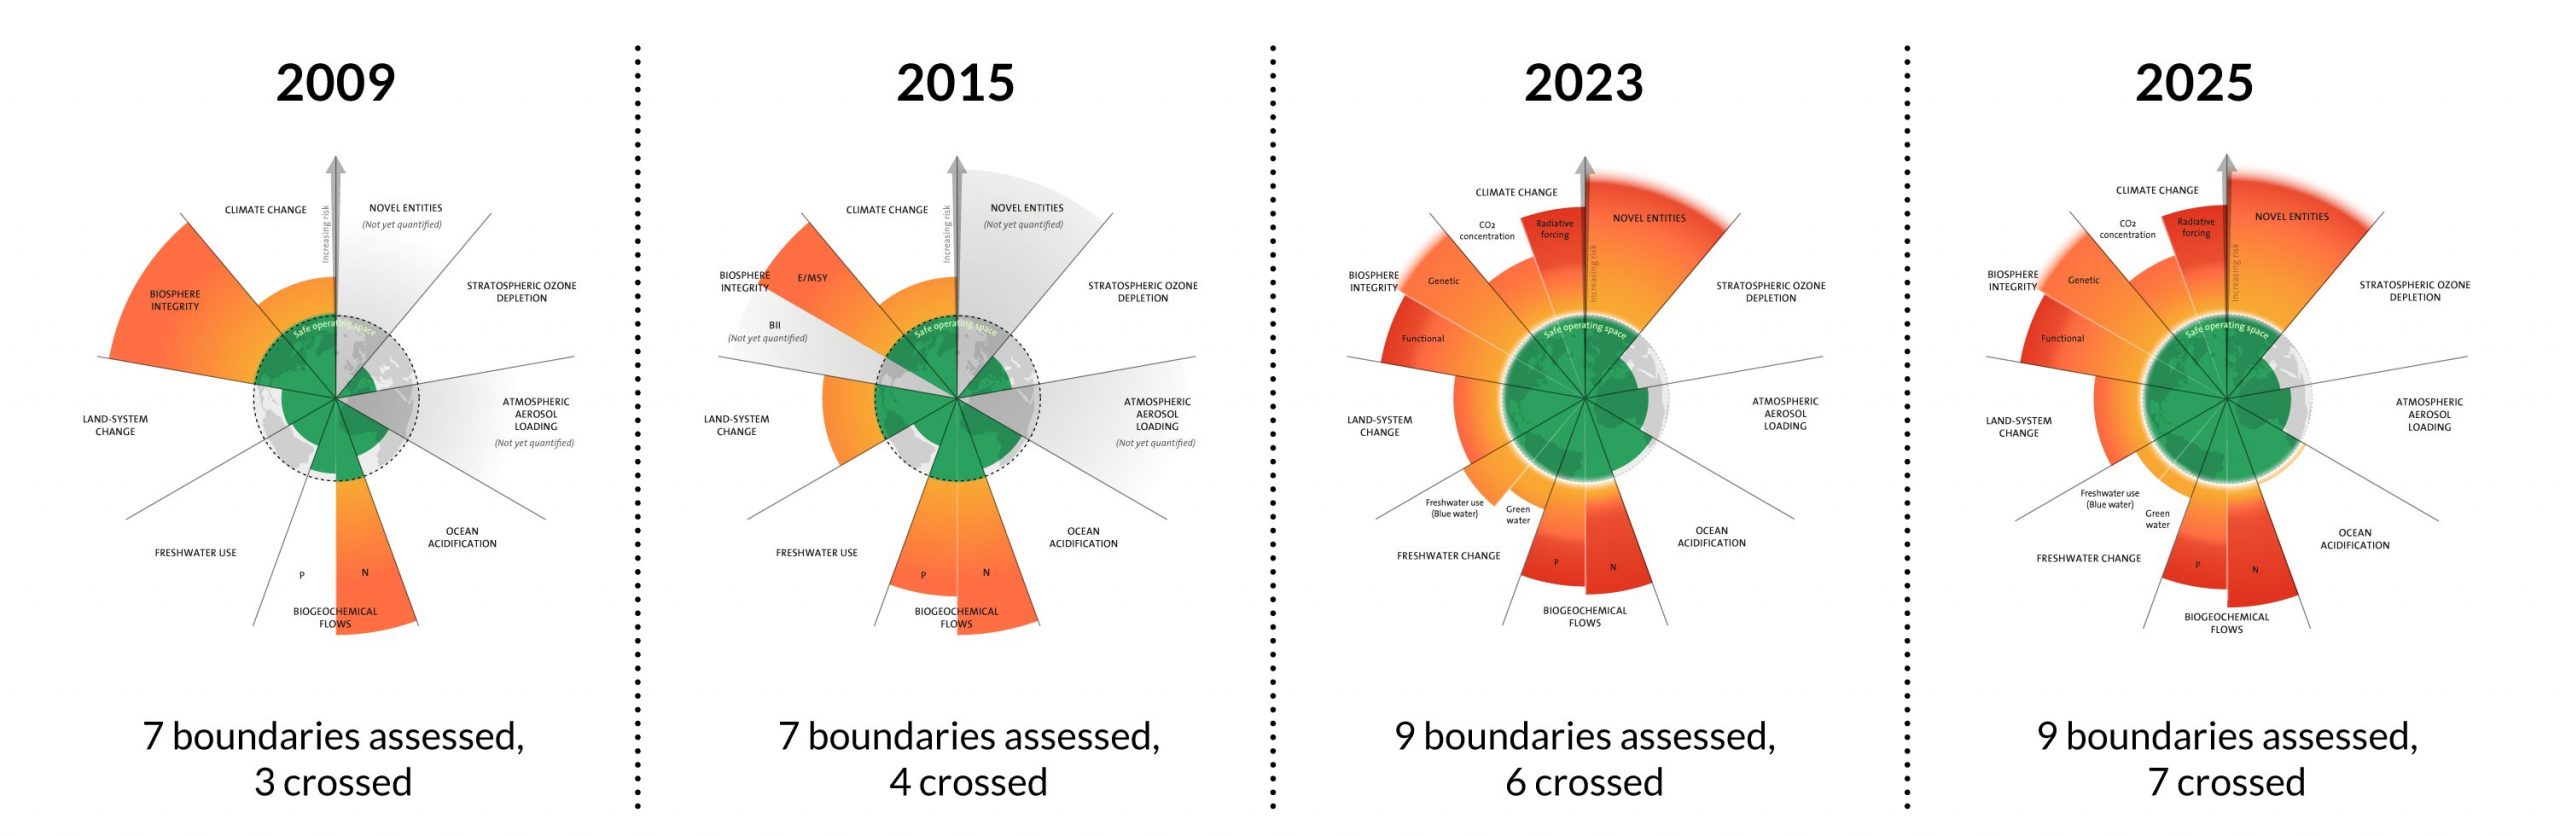
    The Planetary Health Check (PHC) 2025 has warned that 7 of 9 planetary boundaries have now been breached.

    About Planetary Health Check (PHC):

    • The PHC is a global scientific assessment of Earth system health, tracking ecological thresholds that keep the planet habitable.
    • The 2025 report warns that 7 of 9 planetary boundaries have now been breached, with ocean acidification crossing the safe zone for the first time.
    • It highlights how human activities — fossil fuel combustion, deforestation, unsustainable agriculture, and industrial waste — are driving Earth beyond its safe operating space for the first time in 11,000 years.

    What are ‘Planetary Boundaries’?

    What are Planetary Boundaries?

    • Proposition: Coined in 2009 by scientists led by Johan Rockstrom.
    • What are they: Defines safe operating space for humanity by setting ecological thresholds that regulate Earth system stability and resilience.
    • Basis: Based on Holocene conditions (last ~11,000 years) that enabled human civilisation to thrive.
    • Significance: Crossing boundaries risks irreversible environmental collapse.
    • Nine Planetary Boundaries (PBs):

      1. Climate Change (CO₂ Concentration & Radiative Forcing): Safe atmospheric Carbon Dioxide (CO₂) level: 350 parts per million (ppm). Current: 423 ppm (2025); radiative forcing at +2.97 Watts per square meter (W/m²) (safe: +1.5 W/m²).
      2. Biosphere Integrity (Biodiversity Loss / Extinction Rate): Extinction rate at 100 extinctions per million species years (E/MSY) vs safe 10 E/MSY; severe biodiversity decline continues.
      3. Land System Change (Deforestation / Ecosystem Conversion): Global forest cover reduced to 59% (safe: 75%). All major terrestrial biomes breached.
      4. Freshwater Change (Streamflow & Soil Moisture Deviations): Over 20% of global land shows significant streamflow (22.6%) and soil moisture (22%) deviations beyond thresholds. Indo-Gangetic Plain & North China basins most at risk.
      5. Biogeochemical Flows (Nitrogen & Phosphorus Cycles): Excessive use of Nitrogen (N) and Phosphorus (P) in agriculture, worsening dead zones and eutrophication in water bodies.
      6. Novel Entities (Synthetic Pollutants & Plastics): Release of plastics, synthetic chemicals, and untested compounds exceeds the safe zero-threshold for environmental introduction.
      7. Ocean Acidification (Aragonite Saturation State): Surface ocean acidity has increased by 30–40% since the industrial era. Aragonite saturation state (Aragonite) at 2.84 (safe: 2.86). Threatens corals, molluscs, and plankton.
      8. Atmospheric Aerosol Loading (Aerosol Optical Depth – AOD) [Currently Safe]: Interhemispheric Aerosol Optical Depth (AOD) difference: 0.063, below safe threshold 0.10. Still harmful for health despite planetary stability.
      9. Stratospheric Ozone Depletion (Ozone Concentration in Dobson Units – DU) [Currently Safe]: Global ozone concentration stable at 285–286 Dobson Units (DU) (safe: 277 DU). Ozone hole recovery continues, though new threats flagged from rocket launches and satellite debris.
    [UPSC 2018] The term “sixth mass extinction/sixth extinction” is often mentioned in the news in the context of the discussion of:

    (a) Widespread monoculture practices in agriculture and large-scale commercial farming with indiscriminate use of chemicals.

    (b) Fears of a possible collision of a meteorite with the Earth.

    (c) Large scale cultivation of genetically modified crops.

    (d) Mankind’s over-exploitation/misuse of natural resources, fragmentation/loss of natural habitats, destruction of ecosystems, pollution and global climate change.


  • Corporate Average Fuel Efficiency (CAFE) Norms

    Why in the News?

    The Bureau of Energy Efficiency (BEE) under the Ministry of Power has issued draft CAFE-3 and CAFE-4 norms, applicable from April 2027 to March 2037.

    About Corporate Average Fuel Efficiency (CAFE) Norms:

    • What is it: Standards that mandate automakers to maintain a sales-weighted fleet average of fuel efficiency and CO₂ emissions across all passenger vehicles.
    • Origin:
      • First introduced in the United States in 1975 after the Arab Oil Embargo, aimed at lowering oil dependency.
      • In India, first notified in 2017 under the Energy Conservation Act, 2001, framed by the Bureau of Energy Efficiency (BEE), Ministry of Power.
    • Objective:
      • Reduce CO₂ emissions and oil imports, improve energy security.
      • Push adoption of EVs, hybrids, flex-fuels, and fuel-efficient technologies.
    • Applicability: Passenger vehicles (< 3,500 kg gross vehicle weight) across petrol, diesel, LPG, CNG, hybrid, and electric categories.
    • Phased Implementation in India:
      • CAFE I (2017–2022) → CO₂ emission limit of 130 g/km.
      • CAFE II (2022–2027) → stricter limit of 113 g/km.
      • CAFE III (Draft, 2027–2032) → 91.7 g/km CO₂ limit, aligned with WLTP (World Harmonised Light Vehicle Test Procedure).
      • CAFE IV (Draft, 2032–2037) → 70 g/km CO₂ limit (most stringent stage yet).
    • Recent Updates (Draft CAFE-3 & CAFE-4, Sept 2025):
      • Automakers allowed to form pools of up to 3 manufacturers.
      • Pooling treated as one fleet for compliance; pool manager bears penalty if limits breached.
      • A manufacturer can join only one pool per year but can switch in later years.
      • Special relief for small cars (under 4m, <909 kg, <1200 cc): eligible for up to 9 g/km CO₂ relief.
      • Incentives for flex-fuel vehicles (ethanol-petrol blends) and strong hybrids alongside EVs.
      • Aim: Balance decarbonisation with consumer affordability and revive the small car segment (which saw 71% sales decline in 6 years).
    • Compliance & Penalties:
      • Exceeding CO₂ limits: Regulatory fines under the Energy Conservation Act, 2001.
      • CAFE credits may be earned, traded, or carried forward to offset temporary lapses.
    • Green Impact:
      • Complements India’s Net Zero 2070 goals.
      • Encourages fuel-efficient models, biofuels, and EV adoption.

    How are CAFE Norms different from Bharat Stage (BS) Norms?

    CAFE Norms Bharat Stage (BS) Norms
    Full Form Corporate Average Fuel Efficiency Bharat Stage Emission Standards
    Primary Focus Fleet-wide fuel efficiency & CO₂ emissions Individual vehicle toxic exhaust pollutants (NOx, PM, CO, HC, SOx)
    Objective Reduce oil imports, improve energy efficiency, cut CO₂ Reduce air pollution & public health risks
    Regulating Authority BEE, Ministry of Power (Energy Conservation Act, 2001) MoEFCC & CPCB
    Scope Passenger vehicles (<3,500 kg GVW; petrol, diesel, LPG, CNG, hybrids, EVs) Mainly ICE vehicles; tailpipe pollutants from petrol & diesel
    Parameters Measured Fleet average CO₂ (g/km) Pollutants: NOx, CO, PM, HC, SOx
    Basis of Measurement Sales-weighted fleet average across all models Individual vehicle emissions tested
    Phases in India CAFE I (2017–22: 130 g/km) → CAFE II (2022–27: 113 g/km) → Draft CAFE III (2027–32: 91.7 g/km) → Draft CAFE IV (2032–37: 70 g/km) BS-I (2000) → BS-II (2005) → BS-III (2010) → BS-IV (2017) → BS-VI (2020; leapfrogged BS-V)
    Testing Standard Fuel efficiency & CO₂ per km (lab-tested, WLTP cycle for future) Pollutant emissions measured under regulated driving cycles
    Impact on Industry Forces OEMs to balance fleet mix (e.g., SUVs offset by EVs/hybrids) Forces OEMs to adopt clean fuel & emission-control tech (e.g., DPF, SCR)
    Penalties Heavy fines for fleet CO₂ non-compliance; penalties apply to pool manager in pooled fleets Non-compliant vehicles cannot be sold; penalties & recalls
    Global Parallel U.S. CAFE norms (1975) Euro emission standards


    [UPSC 2020] Which of the following are the reasons/factors for exposure to benzene pollution?

    1. Automobile exhaust 2. Tobacco smoke 3. Wood burning 4. Using varnished wooden furniture 5. Using products made of polyurethane

    Select the correct answer using the code given below:

    Options: (a) 1, 2 and 3 only * (b) 2 and 4 only (c) 1, 3 and 4 only (d) 1, 2, 3, 4 and 5


  • New species of finless Snake Eel named after Kanniyakumari

    Why in the News?

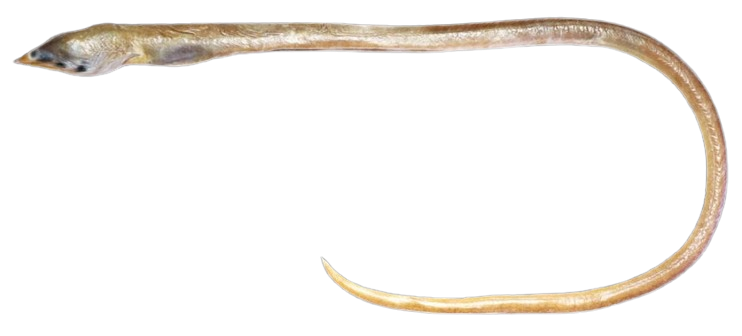
    ICAR- National Bureau of Fish Genetic Resources (NBFGR) researchers in Kochi have discovered a new finless snake eel species, Apterichtus kanniyakumari, named after Kanniyakumari district.

    New species of finless Snake Eel named after Kanniyakumari

    About Finless Snake Eel (Apterichtus kanniyakumari):

    • Location: Discovered off the Colachel coast, Kanniyakumari (Tamil Nadu), at ~100 m depth during deep-sea trawling.
    • Etymology: Named kanniyakumari in honour of the district’s cultural, linguistic, historical, and geographical heritage.
    • Taxonomy: Belongs to the genus Apterichtus, family Ophichthidae, commonly known as finless snake eels.
    • Morphological traits: Golden-yellow body, pale white ventral head with yellow jaw lines, three black blotches (behind eyes, at rictus, behind rictus origin), conical uniserial teeth, 3 preopercular & 9 supratemporal pores.
    • Molecular confirmation: Mitochondrial CO1 gene analysis shows it as a distinct clade, closely related to Apterichtus nanjilnaduensis.
    • Significance: Marks the 16th new species described from the Indian coast by NBFGR; adds to India’s marine biodiversity records.
    [UPSC 2016] Recently, our scientists have discovered a new and distinct species of banana plant which attains a height of about 11 meters and has orange coloured fruit pulp. In which part of India has it been discovered?

    (a) Andaman Islands *

    (b) Anaimalai Forests

    (c) Maikala Hills

    (d) Tropical rain forests of northeast


  • Pollution in Indian Rivers: CPCB Report, 2023

    Why in the News?

    The Central Pollution Control Board (CPCB) released its latest assessment (2022–23) on the health of Indian rivers.

    About Central Pollution Control Board (CPCB): 

    • Overview: Statutory body set up in September 1974 under the Water (Prevention and Control of Pollution) Act, 1974.
    • Expanded mandate: Later entrusted with powers under the Air (Prevention and Control of Pollution) Act, 1981.
    • Umbrella role: Serves as the technical arm of the Ministry of Environment, Forest & Climate Change (MoEFCC), implementing provisions of the Environment (Protection) Act, 1986.
    • Principal Functions:

      1. Water pollution control: Promote cleanliness of streams and wells across states by preventing, controlling, and abating pollution; Oversee the National Water Quality Monitoring Program to collect, collate, and disseminate data.
      2. Air pollution control: Improve air quality and control emissions; Run the National Air Monitoring Programme (NAMP) to determine current status and trends. Regulate industrial pollution, provide baseline data for industrial siting and town planning.
      3. Data Management: Collects, collates, and disseminates technical and statistical data on air and water pollution.
    • Key Initiatives and Programs:

      • NAMP: Monitors air quality and pollution trends.
      • NAQI (National Air Quality Index): Offers real-time air quality data.
      • GRAP (Graded Response Action Plan): Measures graded interventions based on severity of pollution.
      • Clean Air Campaign: Awareness and enforcement measures for pollution reduction.

    CPCB Assessment of Pollution in Indian Rivers:

    Parameters & Definitions:

    • Biological Oxygen Demand (BOD): It is the amount of dissolved oxygen needed by microbes to break down organic matter.
      • Healthy river: BOD <3 mg/L.
      • Unfit for bathing: BOD >3 mg/L.
    • Polluted River Stretch (PRS): When two or more consecutive locations in a river exceed bathing criteria (BOD >3 mg/L).
    • Priority Classification (BOD levels):
      1. Priority 1: >30 mg/L → Most polluted, urgent remediation.
      2. Priority 2: 20–30 mg/L.
      3. Priority 3: 10–20 mg/L.
      4. Priority 4: 6–10 mg/L.
      5. Priority 5: 3–6 mg/L → least polluted category but still polluted.

    Key Findings of the Report: 

    • Unfit bathing locations: 807 (2023) vs 815 (2022), shows marginal dip.
    • Polluted River Stretches (PRS): 296 stretches/locations across 271 rivers in 2023 vs 311 stretches in 279 rivers in 2022.
    • State-wise PRS (2023):
      1. Maharashtra: 54 (highest).
      2. Kerala: 31.
      3. Madhya Pradesh: 18.
      4. Manipur: 18.
      5. Karnataka: 14.
    • Most polluted states by Priority 1 (2023): Tamil Nadu, Uttar Pradesh, Uttarakhand (5 each).
    • Most polluted states by Priority 1 (2022): Gujarat and Uttar Pradesh (6 each).
    [UPSC 2017] Biological Oxygen Demand (BOD) is a standard criterion for:

    Options: (a) Measuring oxygen levels in blood

    (b) Computing oxygen levels in forest ecosystems

    (c) Pollution assay in aquatic ecosystems *

    (d) Assessing oxygen levels in high altitude regions


  • ‘Smog-eating’ photocatalytic coatings on roads to curb pollution

    Why in the News?

    Delhi government has announced a feasibility study to test photocatalytic coatings on roads, pavements, and public spaces to bring visible improvements in air quality.

    About Smog:

    • Overview: Combination of smoke and fog, forming smoky fog with soot, gases, and moisture.
    • Components: Includes soot particulates, sulphur dioxide (SO₂), nitrogen dioxide (NO₂), hydrocarbons, carbon monoxide (CO), and ozone (O₃).
    • Types:

      1. Sulfurous Smog (London Smog) – Caused by burning coal and sulphur-bearing fuels; worsened by dampness and particulates.
      2. Photochemical Smog (Los Angeles Smog) – Produced when NOₓ and hydrocarbons react under sunlight, forming ozone; appears as a brownish haze with respiratory effects.
    • Pollutants:

      1. Primary pollutants: Directly emitted (NO₂, SO₂, hydrocarbons).
      2. Secondary pollutants:  Formed via reactions (ozone, acid rain).
    • Haze vs. Smog: Haze = dry particles reducing visibility; Smog = pollutants with condensation.
    • Effects: Respiratory distress, eye irritation, plant damage, reduced visibility, carcinogenic risk, worsened by inversion layers and low rainfall.

    What are “Smog-Eating” Coatings?

    • Technology: Photocatalytic coatings using titanium dioxide (TiO₂) on roads, pavements, and public surfaces.
    • Function: Under sunlight, TiO₂ breaks down pollutants like NO₂ and hydrocarbons into less harmful compounds.
    • Advantages: Low-cost, stable, compatible with traditional materials, effective in depollution and creating self-cleaning surfaces.

    Delhi Government Plan

    • Plan: If viable, Cabinet proposal for citywide rollout at busy corridors, markets, and public spaces.
    • Evaluation: Study to assess cost-effectiveness, safety, and sustainability while shortlisting suppliers.
    • Strategic Context: Part of a 24×7, year-round environmental action plan using technology-driven interventions.
    [UPSC 2013] Photochemical smog is a resultant of the reaction among-

    (a) NO₂, O₃ and peroxyacetyl nitrate in the prescence of sunlight *

    (b) CO₂, O₂, and peroxyacetyl nitrate in the presence of sunlight

    (c) CO, CO₂, and NO₂ at low temperature

    (d) high concentration of NO₂, O₃ and CO in the evening


  • A climate-health vision with lessons from India

    Introduction

    At the Global Conference on Climate and Health (July 2025, Brazil), 90 countries shaped the Belém Health Action Plan, which will guide the climate-health agenda at COP30 (Nov 2025). Ironically, India, despite having some of the most instructive welfare experiences linking climate and health, was not officially represented, a missed opportunity to emerge as a global exemplar.

    India’s non-health interventions like the Pradhan Mantri Poshan Shakti Nirman (PM POSHAN), Swachh Bharat Abhiyan, Mahatma Gandhi National Rural Employment Guarantee Act (MNREGA), and Pradhan Mantri Ujjwala Yojana (PMUY) offer rich lessons for operationalising an integrated climate-health framework. They reveal that intentional, intersectoral action can yield multiple dividends: improved nutrition, reduced pollution, restored ecosystems, and healthier communities.

    Why is this news significant?

    India’s absence at Belém stands out because for the first time a global platform is drafting a climate-health action plan. While India has often been viewed through the prism of its energy transition challenges, this moment presented a chance to highlight its homegrown welfare successes with global resonance. The paradox is striking: even without designing policies as “climate policies,” India has reaped climate-health co-benefits, unlike many countries still struggling to integrate the two. Yet, persistent failures like high LPG refill costs in PMUY and siloed governance highlight the scale of unfinished work.

    What is the Belém Health Action Plan (BHAP)?

    • The BHAP is a strategic framework being finalized ahead of COP30 (Nov 2025, Belém, Brazil) intended to integrate health into climate change adaptation.
    • It emphasizes health equity, climate justice, and social participation alongside strengthening health systems to be resilient in face of climate change.

    Key Features / Action Lines

    Some of its priority action lines include:

    • Surveillance & Monitoring:
      • Linking climate/environmental data with health surveillance, early warning systems (for heatwaves, epidemics, etc.).
      • Real-time data, local / community-level monitoring.
    • Evidence-Based Policy Strategy & Capacity Building:
      • Training health workforce, integrating mental health & psychosocial support measures.
      • Gender-responsive, inclusive policies, recognizing most vulnerable groups (women, Indigenous people, persons with disabilities).
    • Innovation & Production:
      • Resilient infrastructure and services (e.g. climate-adapted health facilities), sustainable supply chains.
      • Focus on blended financing and mobilizing investments to make health systems adaptive and equitable.
    • Cross-cutting priorities:
      • Health equity & climate justice: ensuring that adaptation efforts do not further marginalize vulnerable groups.
      • Leadership & governance: accountability, social participation from civil society, clear institutional roles.

    What lessons do India’s welfare programmes offer for climate-health synergy?

    1. PM POSHAN: Covers 11 crore children in 11 lakh schools, linking nutrition, agriculture, and education. Promotion of millets strengthens climate-resilient food systems.
    2. Swachh Bharat Abhiyan: Improved sanitation, public health, and environmental sustainability, while embedding dignity and cultural symbolism via Gandhi’s vision.
    3. MNREGA: Enhanced livelihood security while simultaneously restoring degraded ecosystems through water conservation and afforestation.
    4. PM Ujjwala Yojana (PMUY): Transition to clean cooking fuel cut household air pollution — a leading cause of respiratory illness — while reducing carbon emissions.

    How has leadership and community engagement shaped outcomes?

    1. Political leadership: Direct involvement of the Prime Minister gave Swachh Bharat and PMUY inter-ministerial traction and public legitimacy.
    2. Community engagement: PM POSHAN leveraged parent-teacher committees, Swachh Bharat invoked cultural pride in cleanliness, ensuring local ownership.
    3. Cultural anchoring: Climate action framed as health protection resonates more deeply than carbon metrics.

    What structural challenges persist in implementation?

    1. Administrative silos: Divergent sectoral mandates limit integrated outcomes.
    2. High refill costs in PMUY: Oil marketing interests often outweigh beneficiary affordability.
    3. Social barriers: Gender norms and cultural practices limit uptake of clean fuel and sanitation.
    4. Output vs. outcome gap: Programmes measure immediate coverage but not long-term health-climate impact.

    What framework does India’s experience suggest for climate-health governance?

    1. Strategic prioritisation: Frame climate action as immediate health security, not distant environmental risk.
    2. Procedural integration: Embed health impact assessments into energy, transport, and urban policies.
    3. Participatory implementation: Leverage ASHA workers, SHGs, Panchayats as health-climate advocates.

    Why is this vision critical for the future?

    1. High stakes: Delinking climate and health crises leads to fragmented solutions with escalating costs.
    2. Transformative potential: An intersectoral, whole-of-society approach could position India as a global leader in climate-health governance.
    3. Clear choice: Continue piecemeal efforts or pioneer a bold model aligning welfare with planetary health.

    Conclusion

    India’s welfare architecture has shown that policies designed for social welfare can unintentionally become climate-health interventions. The challenge now is to make this synergy intentional and institutionalised, with robust political framing, procedural integration, and community mobilisation. At a time when the world is drafting a global climate-health action plan, India’s absence from the table is a wake-up call: to convert scattered lessons into a coherent model of governance that others can emulate.

    Value Addition

    Key Concepts

    1. Climate-Health Nexus: Environmental policies often have unintended health impacts; health policies also influence climate outcomes.
    2. Co-Benefits Approach: One intervention (e.g., PMUY for clean cooking fuel) yields multiple dividends (better health, women’s empowerment, reduced emissions).
    3. Whole-of-Society Approach: Intersectoral coordination between ministries, communities, and local bodies ensures impact.
    4. Output vs Outcome Gap: Many Indian schemes achieve outputs (LPG connections, toilets built) but outcomes (sustained use, cleaner air, health equity) remain weak.

    Important Data / Reports

    1. WHO Report (2021): Air pollution causes 7 million premature deaths annually worldwide.
    2. Lancet Countdown on Health and Climate Change (2022): South Asia faces one of the highest global burdens of climate-related health risks.
    3. India’s National Family Health Survey (NFHS-5, 2021): Despite welfare schemes, 35.5% of children under 5 are stunted and 32.1% are underweight, showing links between nutrition, climate resilience, and health.
    4. UNDP (2023): Every $1 invested in resilience and adaptation yields $4 in avoided losses.
    5. Global Conference on Climate & Health (Belém Plan, 2025): First global blueprint on climate-health integration.

    PYQ Linkage:

    [UPSC 2017] ‘Climate Change’ is a global problem. How India will be affected by climate change? How Himalayan and coastal states of India will be affected by climate change?

    Linkage: India’s welfare schemes like PM POSHAN, PMUY, Swachh Bharat and MNREGA demonstrate that non-health interventions can mitigate climate impacts while improving public health. The Himalayan and coastal states, most vulnerable to warming, floods, and sea-level rise, can benefit from such intersectoral, resilience-building models. Thus, India’s climate-health vision provides practical pathways to address both regional vulnerabilities and national climate commitments.