Growth in India’s Index of Industrial Production (IIP) quickened to 8% in August 2026, the second fastest pace in the new series. The strong run since the start of the financial year sets the economy up well for the festive season.
What is the IIP, and why does the new series matter?
What it is: The IIP is a monthly index of the volume of output from mines, factories and power plants. It works like a monthly pulse check on industry.
Better measurement: The new IIP series has an updated base year, more data sources and an improved methodology, so it gives as accurate a picture of industrial growth as official data can.
Short history: The new series has growth data only from April 2024, so comparisons reach back no further.
The takeaway: Because the new series is more reliable, the current growth spurt can be read as genuine industrial momentum.
How strong has industrial growth been?
Peak month: The fastest growth in the new series, 8.8%, came in June 2026.
Five-month run: IIP growth for April to August stood at 6.8%, faster than the same period in each of the previous two years.
Manufacturing surge:Manufacturing grew by nearly 9% in August and averaged 7.6% over April to August 2026.
Year-on-year jump: That compares with about 4.2% manufacturing growth in the first five months of the previous financial year.
Input pressures: Producers achieved this growth even as they faced several pressures on their inputs.
Do the IIP and the core index now agree?
Index of Core Industries (ICI): The ICI, the other official gauge of industry, now largely tracks the IIP, apart from a few divergences.
Electricity: The IIP shows electricity growth quickening to 12.3% in August, against 11.6% in the ICI.
Construction goods:Construction goods grew a relatively strong 6.4% in August, slower than 8% in July.
Cement: In step, the ICI shows cement growing a robust 12.5% in August, slightly slower than 12.7% in July.
End of contrary signals: The older series of both indices often pointed in opposite directions, so this alignment strengthens confidence in the data.
Is domestic demand now driving manufacturing?
From exports to home demand: Early in 2026, manufacturing growth was driven by exports. August data show it is now supplemented by a recovery in domestic consumption.
Consumer goods:Consumer durables output rose 11.1% in August, and consumer non-durables returned to growth of a little over 2% after contracting in July.
Festive expectations: The boost from the Goods and Services Tax (GST) rate cuts of September 2025 should have faded by now. Higher durables output therefore signals that producers expect a strong festive season.
Third quarter test: The third quarter of the financial year will be crucial, and the groundwork for a relatively good one is in place.
Challenges
Seasonal demand: A festive-season boost is seasonal, so strong output before the festivals need not mean lasting consumer demand.
Export exposure: Export-led manufacturing stays exposed to global demand and trade barriers abroad.
Short data history: The new series has only a short growth record, so it cannot yet show long-term trends.
Modest non-durables recovery: Everyday consumer goods grew only modestly after a contraction, so the consumption recovery is uneven.
Way Forward
Linked back series: The Ministry of Statistics and Programme Implementation (MoSPI) should publish a linked back series so the new IIP can be compared with earlier years.
Input cost relief: The Centre should review duties on industrial inputs that raise manufacturers’ costs.
Income-led demand: The Union and States should support jobs and household incomes so demand outlasts the festive season.
Export diversification: The Ministry of Commerce and Industry should use trade agreements to widen export markets for manufacturers.
Conclusion
Indian industry now draws strength from both exports and home demand, and the official indices finally agree on it. October to December output will show whether consumer demand holds once the festive and tax-cut effects fade.
Back2Basics: Index of Core Industries (ICI)
What it measures: Monthly output of eight core industries: coal, crude oil, natural gas, refinery products, fertilisers, steel, cement and electricity.
Compiled by: The Office of the Economic Adviser, Department for Promotion of Industry and Internal Trade (DPIIT), Ministry of Commerce and Industry.
Link with the IIP: The eight core industries are also part of the IIP, so the two indices should broadly move together.
Matching Previous Year Question
“[2025, GS3, 15 marks] Discuss the rationale of the Production Linked Incentive (PLI) scheme. What are its achievements? In what way can the functioning and outcomes of the scheme be improved?”
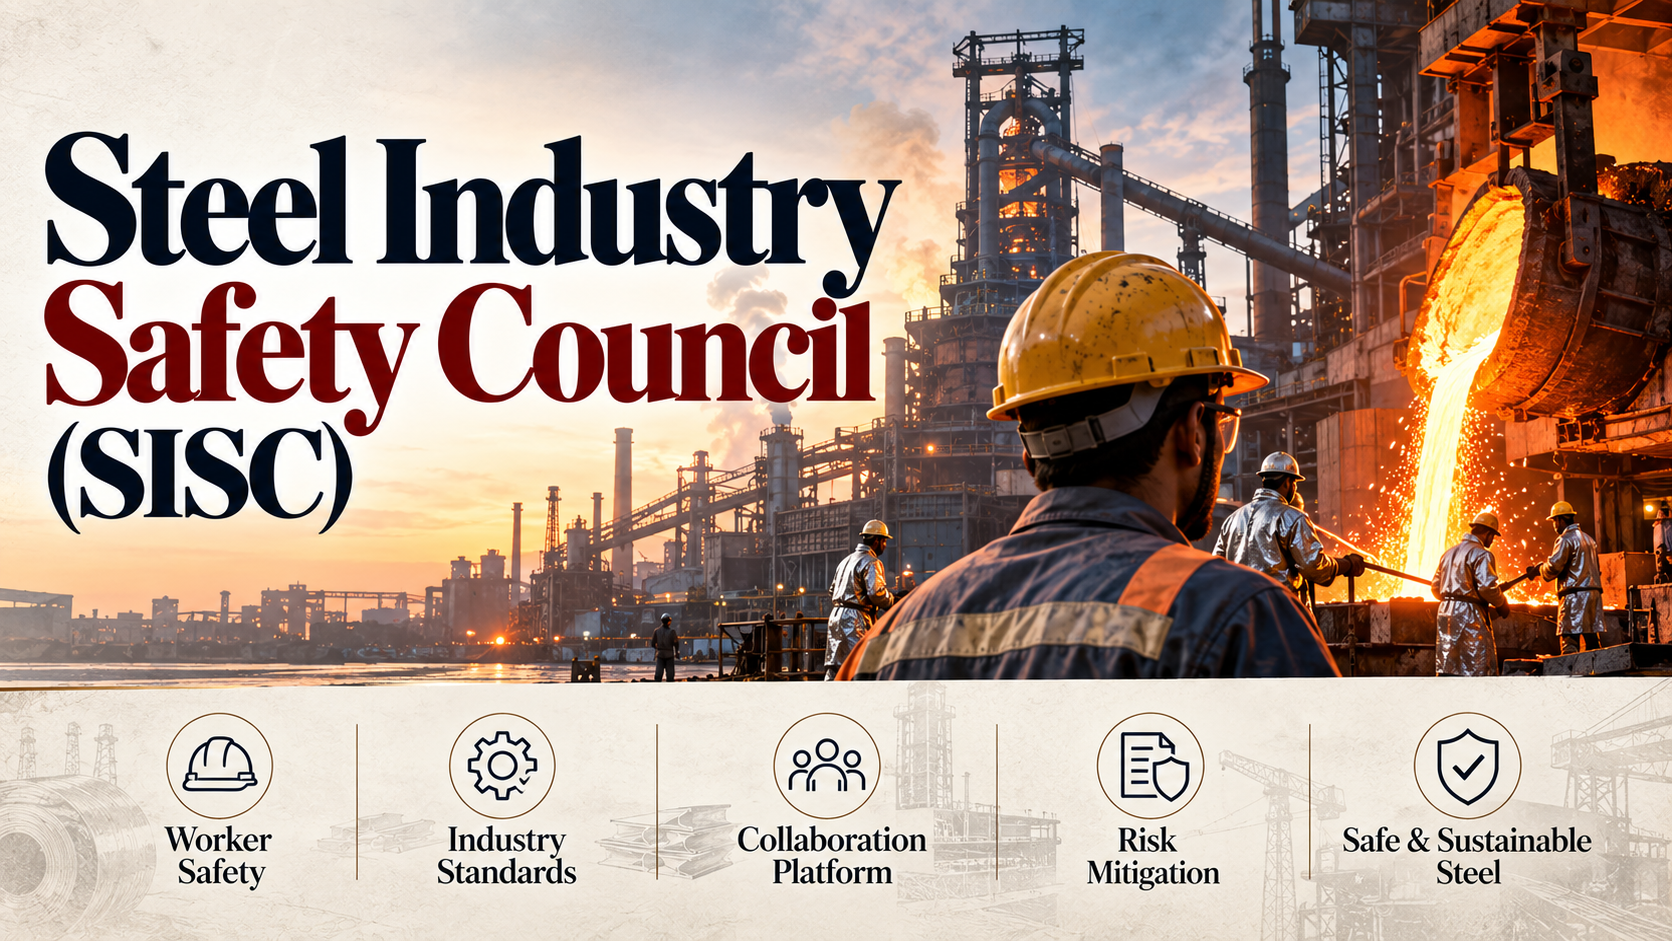
The Ministry of Steel has decided to establish the Steel Industry Safety Council (SISC) as an apex-level industry safety body under the administrative control of the Ministry of Steel.
The initiative aims to strengthen safety standards, accident prevention, safety practices and safety awareness across India’s steel industry.
Key Highlights
SISC will function as an apex-level industry safety body.
It will be headed by the Secretary, Ministry of Steel as Chairman.
Members will include:
Senior officials of the Ministry of Steel
Chief Executives of integrated steel producers
Directorate General of Mines Safety (DGMS)
Petroleum and Explosives Safety Organisation (PESO)
National Disaster Management Authority (NDMA)
Recognised steel technology institutions
Key functions of SISC:
Assess safety conditions in the steel industry.
Facilitate studies and improvements in safety practices.
Approve industry safety standards and recommended practices.
Review serious accidents, accidents and near-miss incidents.
Strengthen safety awareness, training and preventive measures.
Steel Industry Safety Directorate (SISD)
A Steel Industry Safety Directorate (SISD) will provide technical and professional support to SISC.
Expertise will cover:
Process safety
Blast furnaces
Steel melting
Rolling mills
Coke ovens
Refractory systems
Electrical and mechanical safety
Occupational health
Fire engineering
Disaster management
SISD will:
Implement SISC decisions.
Conduct periodic safety audits and reviews.
Maintain and disseminate accident and near-miss information.
Investigate serious safety incidents.
Review emergency preparedness and safety training.
Develop and issue Steel Industry Safety Standards, Recommended Practices and Guidelines suited to Indian conditions.
Prelims Quick Revision
SISC is an apex-level safety body for the steel industry.
SISC will function under the administrative control of the Ministry of Steel.
Secretary, Ministry of Steel will be its Chairman.
DGMS, PESO and NDMA are among the organisations represented in the Council.
SISD will provide technical and professional support to SISC.
SISD will conduct safety audits, investigate serious incidents and maintain accident and near-miss information.
SISC will approve industry safety standards and recommended practices.
SISD will develop safety standards and guidelines suited to Indian conditions.
UPSC Prelims Trap
SISC vs SISD: SISC is the apex-level Council, while SISD is the technical and professional support Directorate.
DGMS is included in SISC, but the article does not state that DGMS will chair the Council.
SISC is under the Ministry of Steel, not described as an independent statutory regulator.
Near-miss incidents are explicitly included in the safety review framework, alongside accidents and serious accidents.
SpaceX‘s reported effort to strip Chinese-made parts from its supply chain shows that cutting dependence on China now means tracing suppliers several layers deep. De-Sinification is two-sided, because Chinese firms moving abroad face the same problem in reverse. For India, the stake is whether incoming factories bring their supplier networks.
What is de-Sinification, and what is an industrial ecosystem?
De-Sinification: Firms and countries cutting their reliance on Chinese factories, suppliers and components.
Industrial ecosystem: The supplier ties, skills, tooling, know-how and logistics behind a factory. It is like a restaurant’s regular vendors and trained staff, who do not move with the building.
Built by repetition: Suppliers learn to respond fast to design or volume changes through repeated dealings, not contracts, so these ties cannot simply be bought.
Deep-tier suppliers: The question is no longer where products are assembled but which suppliers sit several layers down, as SpaceX’s July 2026 effort shows.
The takeaway: A factory crosses a border quickly but its ecosystem does not, so replacing one Chinese supplier leaves dependence on China’s wider production system.
How do Chinese firms face the problem in reverse?
Home advantage: Chinese carmakers BYD and Xpeng compete partly on dense home networks of component makers and engineers.
Three routes abroad: A firm going overseas can take its suppliers, cultivate local ones, or mix both. Each route differs in cost and in how much real localisation, local sourcing, it achieves.
BYD and Xpeng models: BYD is building capacity in Hungary and courting European suppliers. Xpeng has contracted Canada’s Magna to assemble cars in Austria.
Why is de-Sinification a two-sided paradox and a moving target?
Two-sided paradox: Foreign firms are trying to pull out of China’s ecosystem. Chinese firms going global are trying to carry that same ecosystem with them.
China’s own upgrading: China is building capability where it long relied on foreign technology, so firms leaving it chase a moving target.
CXMT: Chinese chipmaker CXMT is now the world’s fourth-largest Dynamic Random Access Memory (DRAM) producer (DRAM is working memory in computers and phones), yet depends on foreign chipmaking tools.
What should India build from this shift?
Early arrivals: Japan’s TDK has expanded battery output in Haryana under its China-plus-one strategy (a second production base outside China). Murata Manufacturing is also expanding in India.
Supplier readiness: India needs domestic suppliers meeting tough cost, quality and delivery standards, plus reliable logistics, skilled workers and secure access to critical inputs.
Test of new investment: Investment should deepen links with Indian firms and bring intermediate production, meaning parts and components, not just assembly.
Judging Chinese investment: The author argues Chinese investment should be valued partly by the supplier networks it builds in India.
Challenges
Assembly heavy electronics: Much Indian electronics output is assembly of imported high value parts. Eg. Phone makers import most chips and displays.
Curbs on Chinese capital:Press Note 3 (2020) requires government approval for investment from land-border countries, slowing Chinese suppliers.
Critical input chokepoints: China can restrict key inputs at will. Eg. Its 2025 rare earth magnet curbs hurt Indian carmakers.
Cost and skills gap: High logistics costs and scarce trained workers leave Indian suppliers less competitive than Chinese ones.
Way Forward
Reward local value addition: Scale up the Electronics Component Manufacturing Scheme, which pays for domestic components rather than assembly volume.
Conditional Chinese investment: Fast-track Press Note 3 approvals for component joint ventures committing to local sourcing and technology transfer.
Supplier clusters: States should build ready-to-use component parks around anchor investors.
Secure critical inputs: Use the National Critical Mineral Mission and partner country deals to cut dependence on Chinese rare earths.
Conclusion
The shift away from China is moving factories faster than the supplier networks that make them competitive. What to watch is whether new investment raises the share of locally made components or leaves India assembling Chinese parts.
Government Initiatives for the Manufacturing Sector
Make in India: Aims to raise manufacturing’s gross domestic product (GDP) share from about 17% toward 25%.
Production Linked Incentive (PLI) scheme: Pays incentives on additional output across 14 sectors, including mobiles, electronics and pharmaceuticals.
National Manufacturing Mission: Launched in the 2025-26 Budget to unify manufacturing policy across ministries and States.
India Semiconductor Mission: A ₹76,000 crore framework for chip fabs and packaging units.
Matching Previous Year Question
“[2025, GS3, 15 marks] Discuss the rationale of the Production Linked Incentive (PLI) scheme. What are its achievements? In what way can the functioning and outcomes of the scheme be improved?”
Make in India was launched in 2014, while PM GatiShakti was launched in 2021.
Make in India 2.0 covers 27 sectors, not 27 manufacturing sectors.
PLI covers 14 sectors, while Make in India 2.0 covers 27 sectors.
IILB is a GIS-enabled industrial land information platform, whereas NSWS facilitates access to business approvals.
Semicon 2.0 focuses on the broader semiconductor ecosystem, including design, manufacturing, advanced packaging, materials, equipment, research and talent development.
Question (2023, GS3 – 10 Marks): Faster economic growth requires increased share of the manufacturing sector in GDP, particularly of MSMEs. Comment on the present policies of the Government in this regard. Linkage: This is the most direct parallel. While QCOs aim to elevate product quality, enforcing mandatory standards on basic intermediate inputs creates compliance burdens and supply bottlenecks for MSMEs. The recent relaxation via the Transition Facilitation Order, 2026 reflects a policy course-correction to protect MSME competitiveness and manufacturing growth.
Mentor Comment
India’s Quality Control Order (QCO) regime has begun to contract, with several orders revoked or suspended since late 2025, particularly those covering intermediate goods. The Department for Promotion of Industry and Internal Trade (DPIIT) has notified the Transition Facilitation (Quality Control) Order, 2026, which lets an eligible firm source temporarily from an alternative class of certified supplier. A study by the Centre for Social and Economic Progress (CSEP) finds that QCOs on chemical inputs cut value addition in large user firms and profitability in small ones. Concerns over India’s QCOs and other non tariff barriers also surfaced at the World Trade Organization’s (WTO) eighth Trade Policy Review of India, held in July 2026. The contested point is whether a regime designed to raise product quality should be judged by the number of products it covers or by what it does to the scale and competitiveness of the firms that must comply.
What is a Quality Control Order?
Mandatory conformity to an Indian Standard: A QCO is issued by the administering ministry or department under the Bureau of Indian Standards Act, 2016. It makes conformity to a specified Indian Standard and a Bureau of Indian Standards (BIS) certification compulsory for the listed products.
Application to domestic output and imports alike: Once a QCO is in force, a covered product cannot be manufactured, imported, stored for sale or sold without that certification. An import faces the same requirement as domestic production.
Two certification routes: BIS Scheme-I is a licence to use the Standard Mark on a product, granted after factory inspection and testing. BIS Scheme-II issues a Certificate of Conformity for a consignment or a batch.
Input orders versus output orders: A QCO on a finished good regulates what reaches the consumer. A QCO on an intermediate input regulates what a downstream manufacturer is allowed to buy.
How far did the QCO net expand, and what remains to be reassessed?
Rapid expansion after 2019: The number of products covered under QCOs rose from 88 in 2019 to 765 by the end of December 2024.
The slowdown: The pace of expansion slowed considerably towards the end of 2025. Several QCOs were revoked or suspended, particularly those covering intermediate goods.
What drove the shift: Mandatory certification on intermediates had raised concerns about input availability, costs and potential supply chain disruptions.
The unfinished list: More than 600 QCO covered products remain to be reassessed. These include several critical intermediate inputs used across chemicals, steel, textiles, machinery and electronics, and rubber and plastics.
What does the Transition Facilitation (Quality Control) Order, 2026 do?
Issuing authority and date: DPIIT notified the order on 25 June 2026.
The mechanism: An eligible firm facing difficulty in obtaining BIS Scheme-I certification may source products temporarily from BIS Scheme-II licensed suppliers.
Sectors covered: The mechanism applies in specified sectors, including toys, footwear and air conditioners.
Access conditions: Use of the mechanism is subject to prescribed eligibility criteria and to approval by a committee constituted by DPIIT.
What does the CSEP study find about QCOs on chemical inputs?
Why chemicals: Chemicals are critical intermediate inputs for downstream sectors such as rubber and plastics, pharmaceuticals and electronics.
Growth of coverage: The first QCO for a chemical product was introduced in 2018. The number of chemical products covered rose to 52 by 2024.
Growth of exposure: The share of chemical using firms exposed to regulation on the input side rose from 11.8 per cent in 2019 to 56.6 per cent in 2024.
Effect on larger firms: Input QCOs are associated with a 9.6 per cent increase in production alongside a 37 per cent decline in gross value added (GVA), meaning output value minus the cost of bought in inputs. Larger firms sustain output at the cost of lower value addition.
Effect on smaller firms: Input QCOs have no statistically significant effect on production or GVA among smaller firms. They are associated with a 47.6 per cent decline in profitability.
What the size split shows: Larger firms can pass at least part of the higher input cost through to output prices. Smaller firms have a more limited ability to absorb rising input costs and the additional compliance costs.
Why has the QCO regime become a trade question?
The forum: The concerns were raised during the WTO’s eighth Trade Policy Review of India.
Raised by major trading partners: The European Union and the United States raised them.
Raised by partners in the same bloc: Fellow BRICS members, including Brazil, China and Indonesia, raised them as well, so the objection does not track a single trade bloc’s interest.
Challenges to the Quality Control Order regime
Compliance cost falls hardest on the smallest firms: Certification fees, testing, factory inspection and documentation are largely fixed costs, so they take a far larger share of a small firm’s turnover. Eg. Of India’s roughly 6.4 crore micro, small and medium enterprises (MSMEs), only about 14 per cent have access to formal credit, so certification costs come out of working capital. The Fix: Give smaller firms dedicated certification assistance, with designed exemptions or transition periods where compliance costs are particularly burdensome.
Certification capacity does not scale with coverage: Recognised testing laboratory and inspection capacity limits how fast licences can be issued once a product is brought under an order. Eg. Waiting periods for foreign manufacturer licences have been a standing complaint from importers of intermediate goods. The Fix: Expand third party conformity assessment through accredited private laboratories, so licence issuance is not gated on the regulator’s own testing capacity.
Input regulation transmits into sectors it was never aimed at: An order placed on an intermediate raises the input cost of every industry that buys it, whatever the order’s own purpose was. Eg. Standards on steel long products raise input costs for engineering goods, automotive components and capital goods producers at once. The Fix: Make a supply chain impact assessment a mandatory part of both the design of a new order and the reassessment of an existing one.
A standard can operate as protection rather than quality assurance: A mandatory standard on an import heavy input restricts supply and raises the domestic price without improving what reaches the consumer. Eg. The WTO Agreement on Technical Barriers to Trade requires that a technical regulation not be more trade restrictive than necessary to fulfil a legitimate objective. The Fix: Publish the risk assessment and the stated objective behind each order at notification, so the instrument is testable against its own purpose.
Quality regulation without surveillance produces paper compliance: A mandatory mark improves quality only where market surveillance detects and penalises non conforming goods actually on sale. Eg. Counterfeit standard marks on low value consumer goods remain a recurring enforcement problem. The Fix: Shift enforcement effort toward post market sample testing of goods on sale rather than toward licence issuance alone.
Conclusion
The instrument under reassessment was designed to police what reaches the consumer, and its cost is landing instead on what a manufacturer is allowed to buy. That mismatch is what the reset has to correct, and a coverage count is the wrong measure of whether it has. The test worth applying is whether quality standards improve products without constraining the scale, efficiency and competitiveness of Indian manufacturing. The marker to watch is whether the reassessment of the remaining intermediate input orders carries a supply chain impact assessment and a separate track for smaller firms, or whether it proceeds product by product as before.
Manufacturing in India
Share and scale: Manufacturing contributes around 17 per cent of India’s GDP. Output is projected to reach approximately $1 trillion in FY 2025-26.
Global standing: India holds around 2.8 per cent of global manufacturing output, against China’s roughly 29 per cent.
Trade and investment: Merchandise exports reached around $437.7 billion in FY25, with non petroleum exports at a record $374.3 billion. Foreign direct investment into manufacturing rose 18 per cent to $19.04 billion in FY25.
Structural concentration: Three states account for around 40 per cent of net value added. Only around 4.7 per cent of the workforce has formal skill training.
Government Initiatives for the Manufacturing Sector
National Manufacturing Mission: Launched in the 2025-26 Budget, it unifies manufacturing policy, execution and governance and prioritises clean and sustainable manufacturing. It targets a 25 per cent manufacturing share of GDP by 2035.
Make in India: The programme promotes domestic manufacturing and investment across identified priority sectors, and is the umbrella framing under which the sector’s GDP share target sits.
Production Linked Incentive (PLI) scheme: It offers output linked incentives across 14 sectors, including mobiles, electronics, pharmaceuticals, textiles and drones. It had drawn over ₹1.76 lakh crore of realised investment as of March 2025.
India Semiconductor Mission: A ₹76,000 crore framework has approved 10 projects worth around ₹1.60 lakh crore, covering silicon fabs, silicon carbide units and advanced packaging.
National Logistics Policy: It aims to cut logistics costs and improve supply chain efficiency for manufacturers.
Back2Basics: WTO Trade Policy Review
What it is: The Trade Policy Review Mechanism is a World Trade Organization process under which a member’s trade policies and practices are examined by the full membership.
Basis: It was established under Annex 3 of the Marrakesh Agreement establishing the World Trade Organization, 1994.
Frequency: The frequency of a member’s review depends on its share of world trade, so the largest traders are reviewed most often.
What it is not: The review is a transparency exercise. It is not a dispute settlement proceeding and it enforces no obligation.
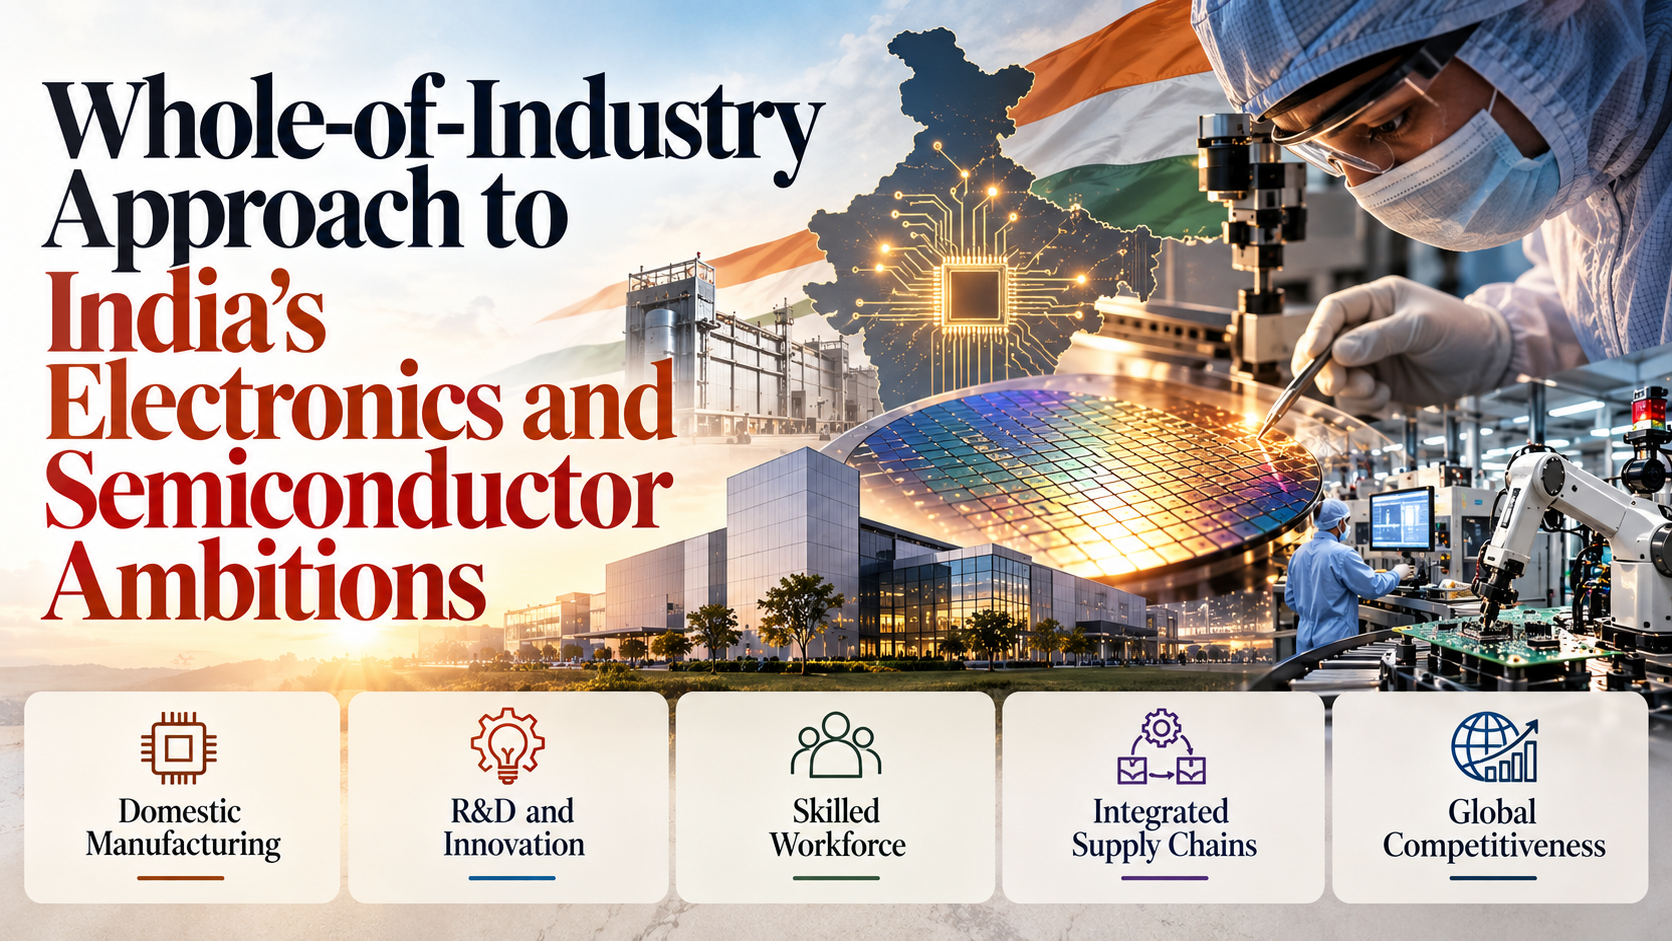
The SEMICON India 2026 panel discussion highlighted the need for a coordinated “whole-of-industry” approach to build India’s globally competitive electronics and semiconductor ecosystem.
Industry leaders stressed collaboration across the semiconductor value chain, from design and manufacturing to packaging, components and end-use applications.
Key Highlights
Panel: “Industry Associations Advancing India’s National Agenda”.
Held during SEMICON India 2026.
Moderated by Amitesh Kumar Sinha, CEO, India Semiconductor Mission (ISM).
600+ exhibitors, including nearly 300 international companies, participated.
56 MoUs, strategic initiatives and industry announcements were recorded.
Focus areas included manufacturing, design, packaging, AI, R&D, logistics and skilling.
Government has approved 12 semiconductor projects under the Semicon India programme.
5 commercial semiconductor units were operational as of September 2026.
Whole-of-Industry Approach
Recognises growing interdependence between:
Semiconductors
Electronics manufacturing
Components
Materials
Chip design
Packaging and testing
End-use applications
Seeks stronger coordination among different industry associations.
Proposed mechanism would facilitate continuous dialogue, coordination and collective action.
It does not replace specialised industry associations, but provides a common platform for cross-sector cooperation.
“Silicon to Systems” Vision
Emphasises integration of:
Design
Manufacturing
Packaging
Electronics
Technology solutions
The objective is to create a stronger and more resilient semiconductor ecosystem.
India’s semiconductor ambitions are increasingly moving beyond individual manufacturing facilities towards ecosystem-wide capabilities.
Government Support
Production Linked Incentive (PLI) schemes support domestic electronics and semiconductor capabilities.
India Semiconductor Mission (ISM) is supporting development of the semiconductor ecosystem.
Semicon India programme has approved 12 semiconductor projects.
5 commercial semiconductor units were operational as of September 2026.
Prelims Quick Revision
SEMICON India 2026 focused on India’s semiconductor and electronics ecosystem.
Panel discussion: “Industry Associations Advancing India’s National Agenda”.
Panel moderated by CEO, India Semiconductor Mission.
600+ exhibitors, including nearly 300 international companies.
56 MoUs and strategic initiatives announced.
12 semiconductor projects approved under the Semicon India programme.
5 commercial semiconductor units operational as of September 2026.
“Silicon to Systems” emphasises integration across design, manufacturing, packaging, electronics and technology solutions.
UPSC Prelims Trap
Whole-of-industry approach does not mean replacing specialised industry associations. It aims to coordinate them through a common platform.
Semiconductor manufacturing is not limited to chip fabrication; the article emphasises the interconnected roles of materials, equipment, packaging, testing, electronics and design.
India Semiconductor Mission (ISM) and Semicon India programme are related to India’s semiconductor development but are not interchangeable terms.
The “Silicon to Systems” vision covers the broader ecosystem from design and manufacturing to packaging, electronics and technology solutions.
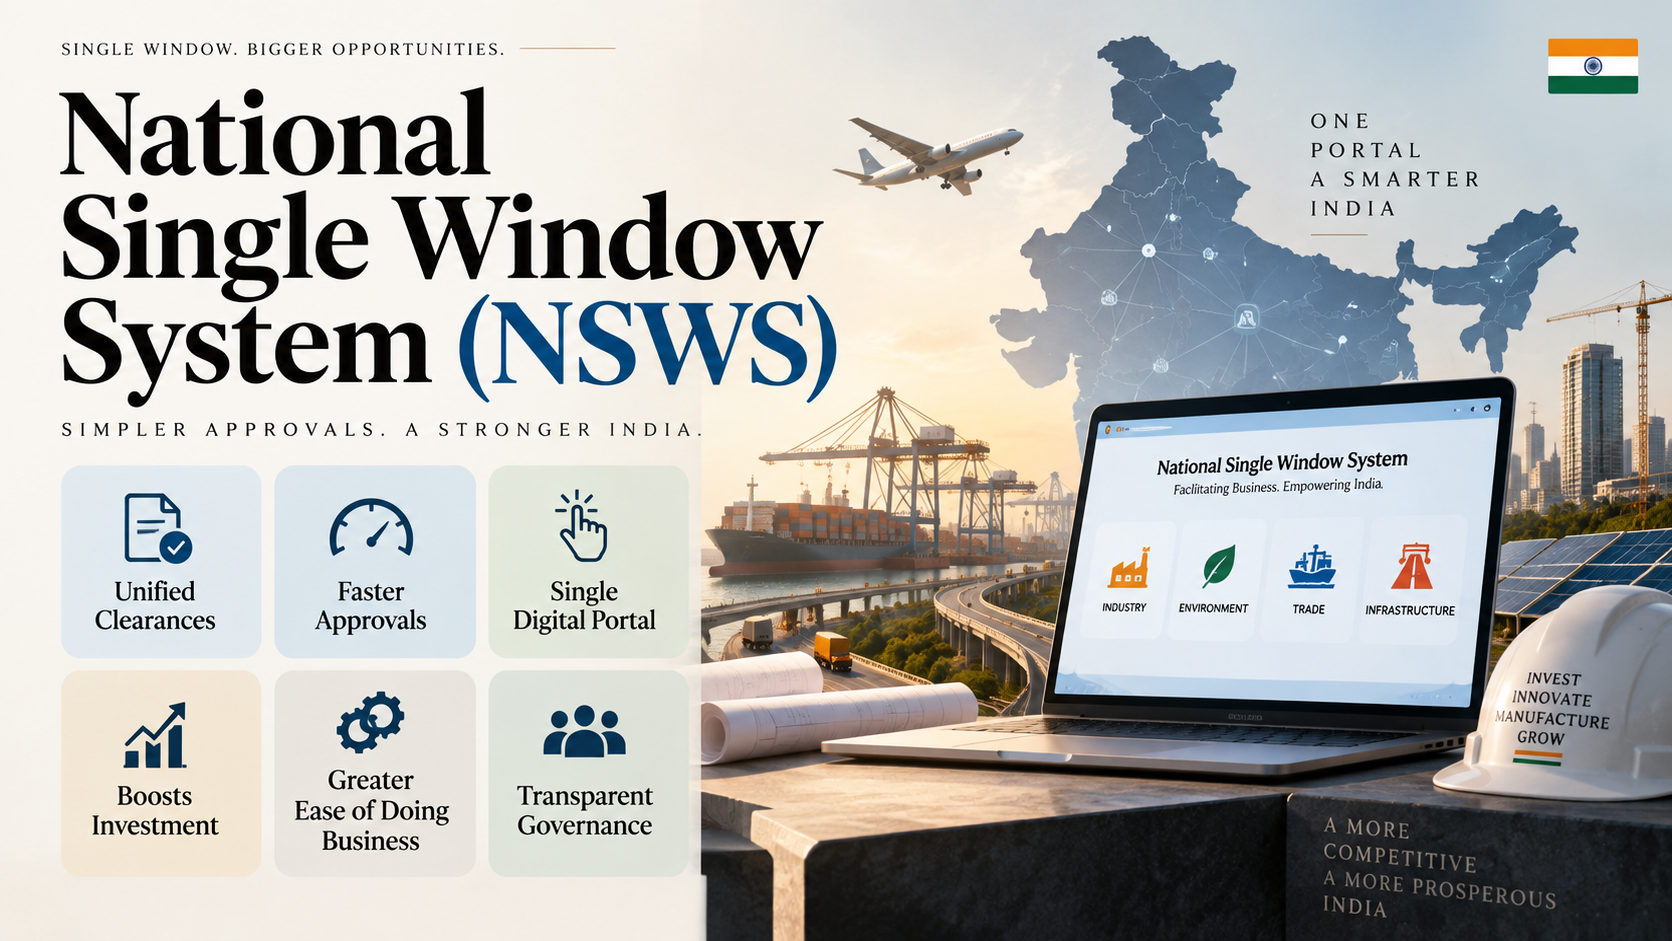
The National Single Window System (NSWS) completes 5 years since its launch on 22 September 2021.
It is implemented by the Department for Promotion of Industry and Internal Trade (DPIIT) to simplify business approvals through a single digital platform.
Key Highlights
Launch: 22 September 2021.
Implementing institution:DPIIT, Ministry of Commerce & Industry.
Provides a common digital platform for approvals from Central Ministries, State Governments and regulatory authorities.
As of 21 September 2026:
5.69 lakh+ business entities onboarded.
327+ Central approvals.
3452 State approvals.
Covers 34 States and Union Territories.
Annual average of 3.06 lakh+ applications.
2.26 lakh+ approvals processed annually.
Highest number of integrated approvals:
Assam – 335
Karnataka – 327
Tamil Nadu – 223
Manipur – 190.
Know Your Approvals (KYA)
KYA module identifies approvals applicable to a business based on its proposed activities.
KYA guidance is advisory in nature and does not constitute legal advice.
NSWS hosts applications from 32 Central Ministries/Departments and 34 States/UTs.
Key Functionalities
Common Registration Form: Enables one-time submission and reuse of information.
Applicant Dashboard: Application submission, status tracking and response to departmental queries.
Centralized Document Repository: One-time document upload and reuse across approvals.
E-Communication Module: Online communication between applicants and authorities.
State Registration Form: Provides access to State Single Window Systems.
Enables online application submission and fee payment.
Registration on NSWS is free, but statutory fees prescribed by authorities must be paid.
Digital Integration
PAN (Permanent Account Number) is used as the Single Business ID.
Authentication is enabled through Digital Signature Certificate (DSC) and DigiLocker for sole proprietors.
Foreign Investment Facilitation Portal (FIF Portal) is integrated with NSWS for FDI applications requiring government approval.
Industrial Entrepreneur Memorandum (IEM) migrated to NSWS in October 2025.
Industrial License (IL) migrated in March 2026.
PESO integrated all 74 licensing modules, becoming the first department to achieve complete transaction-level integration.
Other Important Integrations
Production Investment Business Registration module launched in November 2025.
Facilitates generation of Sponsorship Letters for inviting foreign professionals under the e-Production Investment Business Visa (e-B-4 Visa).
NSWS serves as a common gateway for approvals under:
National Green Hydrogen Mission
Ethanol Policy
Vehicle Scrapping Policy
Indian Footwear and Leather Development Programme.
Prelims Quick Revision
NSWS launched: 22 September 2021.
Implemented by: DPIIT, Ministry of Commerce & Industry.
Coverage: 34 States and Union Territories.
Approvals available: 327+ Central and 3452 State approvals.
Business entities onboarded: 5.69 lakh+.
Single Business ID:PAN.
KYA: Identifies applicable business approvals and is advisory in nature.
PESO: Integrated all 74 licensing modules with NSWS.
UPSC Prelims Trap
NSWS is not itself the approving authority: applications are electronically forwarded to the concerned Ministry, Department or State Government for processing.
KYA is advisory, not legal advice.
NSWS registration is free, but applicable statutory fees are payable.
Do not confuse PAN as the Single Business ID with DSC/DigiLocker, which are used for authentication.
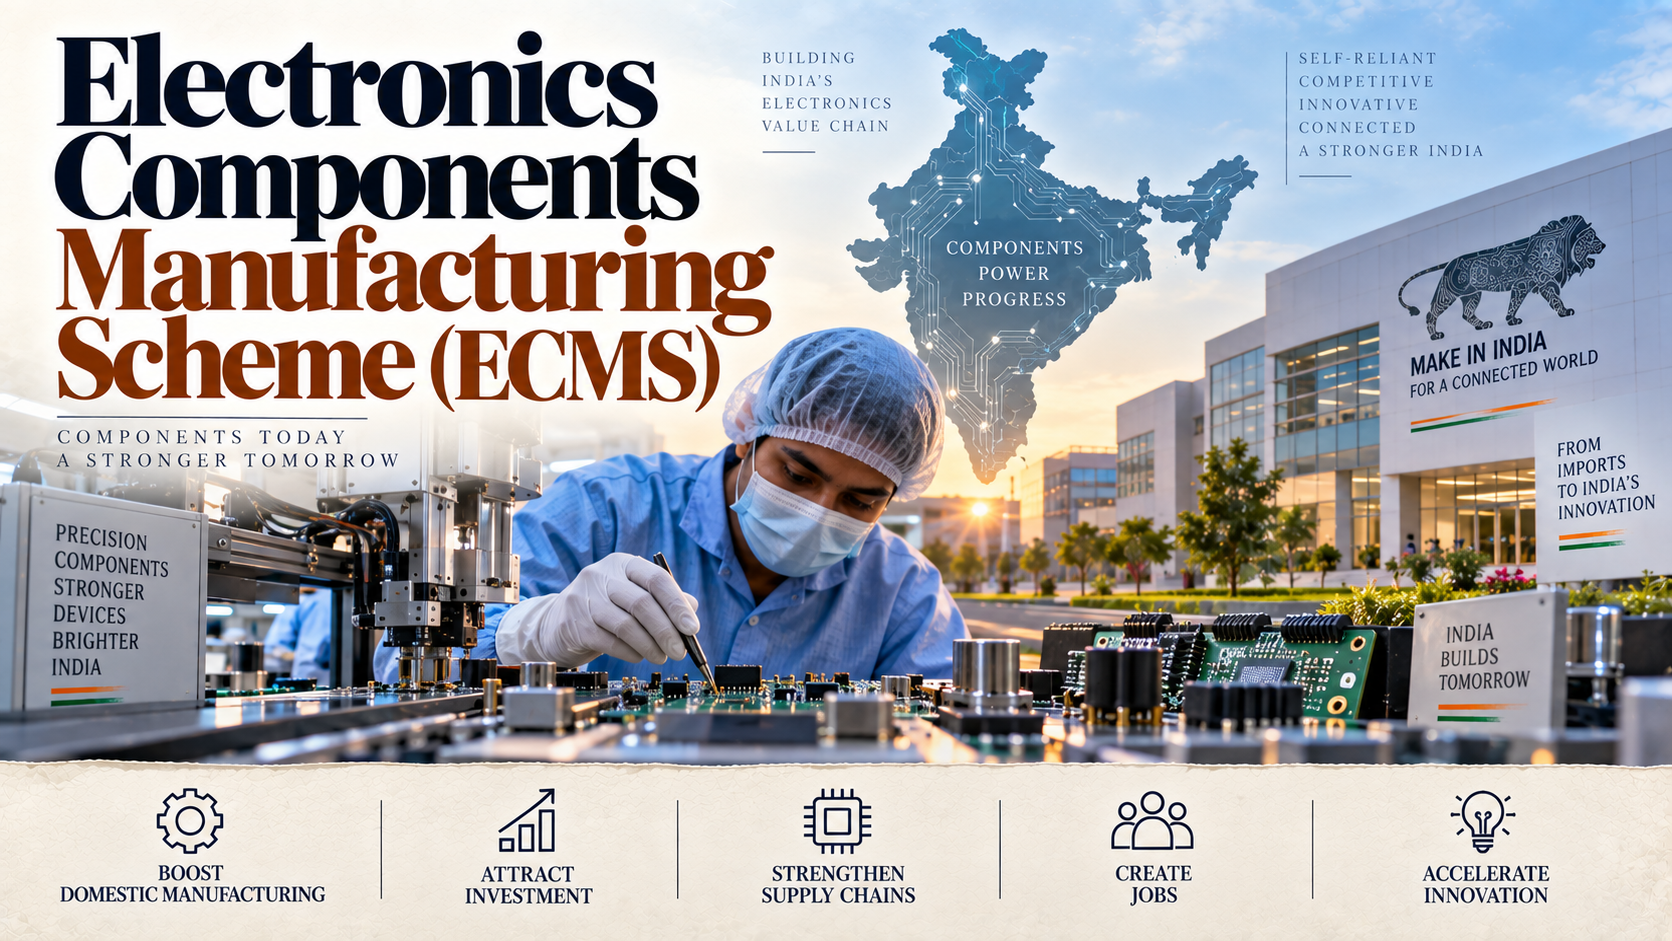
The Electronics Components Manufacturing Scheme (ECMS) is being implemented to deepen India’s domestic electronics ecosystem, reduce import dependence and increase domestic value addition in the electronics supply chain.
Key Highlights
ECMS notified: 8 April 2025
Initial outlay: ₹22,919 crore
Tenure: 6 years, with optional 1-year gestation period
Union Budget 2026-27: outlay increased to ₹40,000 crore
Capex incentive available for 5 years
As of August 2026:
106 projects approved
Across 15 States
Covering 30 electronic domain products
Approved investment: ₹69,548 crore
What Does ECMS Support?
The scheme promotes domestic manufacturing of:
Electronic components
Sub-assemblies
Supply-chain products
Related capital goods
Critical Import-Dependent Components
Printed Circuit Boards (PCBs)
Camera modules
Display modules
Connectors
Capacitors
Lithium-ion cells
Rare-earth magnets
Core objective: Move India beyond electronics assembly towards deeper domestic manufacturing and value addition.
Progress Under ECMS
Production has started at 38 approved plants.
16 projects are at advanced construction or machinery-installation stages.
Expected production: ₹5.34 lakh crore
Expected employment:
74,628 direct jobs
2.5 lakh indirect jobs
SEMICON India 2026
Theme: “Silicon to Systems: Building the Ecosystem”
Venue: Yashobhoomi, New Delhi
Dates: 17-19 September 2026
Focus: strengthening India’s semiconductor ecosystem across the value chain.
Other Government Initiatives
National Policy on Electronics 2019 (NPE 2019)
Aims to make India a global hub for Electronics System Design and Manufacturing (ESDM).
Production Linked Incentive (PLI) for Large-Scale Electronics Manufacturing
Performance-linked incentives of 4%-6% on incremental sales for eligible segments.
SPECS [Scheme for Promotion of Manufacturing of Electronic Components and Semiconductors]
Provided 25% capital expenditure incentive for eligible components, semiconductor/display fabrication, ATMP units, sub-assemblies and capital goods.
EMC 2.0
Modified Electronics Manufacturing Clusters 2.0
Provides manufacturing infrastructure, common facilities and Plug-and-Play capacity.
PLI for IT Hardware
Promotes domestic IT hardware manufacturing and investment.
Semicon India Programme
Semicon 1.0: ₹76,000 crore
Semicon 2.0: ₹1,27,500 crore, approved in July 2026
Supports fabs, packaging, testing, design and related semiconductor capabilities.
Electronics Manufacturing Clusters (EMC) Scheme
Financial assistance up to 50% of project cost
Ceiling of ₹50 crore per 100 acres for greenfield projects.
Phased Manufacturing Programme (PMP)
Uses a structured tariff approach to deepen domestic value addition in mobile phones and key sub-assemblies.
Electronics Development Fund (EDF)
A Fund of Funds investing through venture funds to provide risk capital for innovation, product design and startups in ESDM and IT.
India’s 2030 Target
India is targeting $500 billion domestic electronics manufacturing ecosystem and $150 billion electronics exports by 2030.
![[24th September 2026] The Hindu OpED: Quality control and India’s manufacturing growth](https://d18x2uyjeekruj.cloudfront.net/wp-content/uploads/2026/09/ChatGPT-Image-Sep-24-2026-11_36_08-AM.png)