Mains Ready By December. Smash Mains & Smash PYQ Admissions Open

GS Paper: GS3-06.Storage, transport and marketing of Agricultural produce and issues and related constraints

  • How to finance rural prosperity

    Why in the News

    India’s farm credit system, built to finance crop production, must now finance the whole agricultural value chain if rural India is to capture the value created after harvest. A former Secretary of the Department of Agriculture and Farmers Welfare proposes a value chain financing framework as a reform for Viksit Bharat 2047.

    What is agricultural value chain financing, and why now?

    1. First transformation: Policy, science, irrigation and institutional credit made India a leading producer of cereals, milk, fruits, vegetables and fish, delivering food security.
    2. Value chain: Every commodity moves from production to aggregation, storage, logistics, processing, branding and markets, and enterprises and jobs emerge along it.
    3. Value chain financing: It lends to every viable activity between farm and consumer, not only to the grower. It is like funding the whole assembly line, not just the raw material.
    4. The takeaway: The next transformation must deliver rural prosperity, which depends on financing what happens after harvest.

    Why do seasonal commodities struggle for working capital?

    1. Continuous sectors: Dairy, poultry and fisheries buy and sell year-round, so they earn predictable cash flows and carry lower inventory risk.
    2. Harvest-window squeeze: Seasonal processors must buy most of a year’s raw material in a short harvest window, then finance that stock for months.
    3. Inventory burden: A firm investing ₹500 crore in a processing plant may need ₹700-800 crore just to procure, store and carry stock.
    4. Sugar’s lesson: The seasonal sugar sector grew through inventory finance and warehouse-backed lending, so the difference lies in how the chain is financed, not production potential.

    Why is production credit no longer enough?

    1. Production credit build-up: For five decades, bank nationalisation, regional rural banks, cooperatives and the Kisan Credit Card expanded crop credit, when food security was the priority.
    2. Emerging products: Banks now offer warehouse receipt financing (loans against stored produce), receivables financing (loans against payments buyers still owe) and food processing loans.
    3. NBFC models: Agri-focused non-banking financial companies (NBFCs) have pioneered value-chain lending.
    4. Missing architecture: These remain isolated initiatives, not parts of one financing system.

    How large is the financing opportunity?

    1. Output and credit gap: Farm sector Gross Value Added (GVA), output minus inputs, was ₹48.8 lakh crore, against institutional credit of ₹20 lakh crore.
    2. Opportunity size: For 2023-24, indicative estimates put the value chain financing opportunity above ₹14 lakh crore.
    3. Processing gap: India processes only 10-12% of farm produce, against 35-45% in East, South and Southeast Asia.
    4. Developed economies: The share often exceeds 60% there, where finance follows commodity-specific value chains, not production alone.

    What should the new financing framework contain?

    1. Instrument mix: The framework would combine product finance, receivables finance and warehouse receipt finance. Risk mitigation and credit enhancement tools would cut the lender’s risk of loss.
    2. Warehouse receipt finance: Loans against stored produce, where the receipt a warehouse issues for the stored crop serves as the lender’s security, so the produce backs the loan.
    3. Cash-flow lending: Lenders would judge each commodity chain’s cash flows, not conventional collateral alone.
    4. Wider reach: Credit would reach farmers, input suppliers, aggregators, warehouses, processors, transporters, exporters and retailers, spurring private investment, rural jobs and rural industrialisation.

    Challenges

    1. Collateral habit: Banks still lend mainly against land and fixed assets, so cash-flow appraisal of processors remains underdeveloped.
    2. Price risk on stored stock: A price fall during storage cuts the value of pledged inventory.
    3. Costly NBFC funding: Agri NBFCs borrow at a higher cost than banks, which limits how far their models scale.

    Way Forward

    1. Cash-flow appraisal: Banks should build commodity-specific credit appraisal using procurement and sales data.
    2. Inventory loan guarantees: A guarantee facility should cover seasonal inventory loans to processors.
    3. Electronic warehouse receipts: Scale up the electronic Negotiable Warehouse Receipt (e-NWR) system for pledging stored produce.

    Conclusion

    India’s credit institutions were built to help farmers grow food, not to finance the storage and processing that turn harvests into incomes. Whether lenders move from isolated products to one architecture that lends on cash flows will decide if this becomes a reform or stays a niche.

    Government Initiatives for Agricultural Credit

    1. Kisan Credit Card limit: The KCC loan limit under the Modified Interest Subvention Scheme (MISS) was raised from ₹3 lakh to ₹5 lakh.
    2. Interest subvention: MISS offers short-term crop loans at 7%, falling to 4% on prompt repayment.
    3. Priority Sector Lending: Banks must lend 18% of net bank credit to agriculture.
    4. Special Food Processing Fund: A ₹2,000 crore fund with the National Bank for Agriculture and Rural Development (NABARD) gives affordable credit to food-park units.

    Matching Previous Year Question

    “[2019] The economic cost of food grains to the Food Corporation of India is Minimum Support Price and bonus (if any) paid to the farmers plus (a) transportation cost only (b) interest cost only (c) procurement incidentals and distribution cost (d) procurement incidentals and charges for godowns Answer: (c)”
  • India’s First Soil Carbon Payments to Farmers

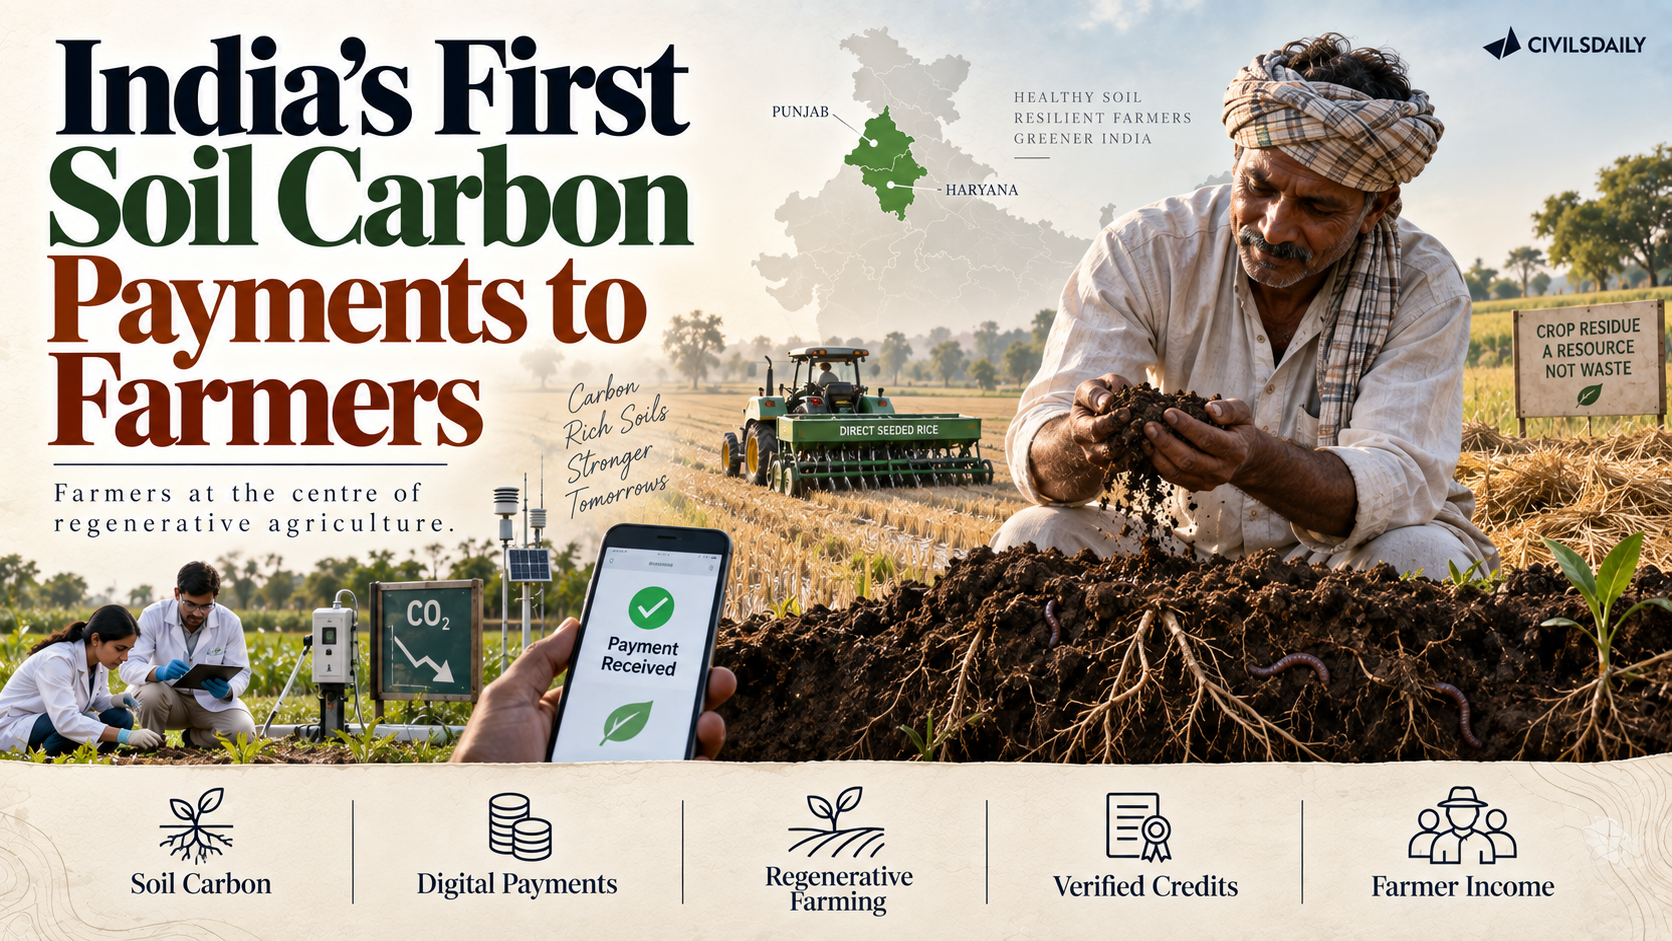
    India’s First Soil Carbon Payments to Farmers

    Why in the News?

    More than 2,500 farmers in Punjab and Haryana are set to receive over ₹2.9 crore through digital payments for adopting regenerative agriculture practices. The initiative marks a link between measured soil-carbon gains, carbon credits and additional farmer income.

    Key Highlights

    • 2,550 farmers from Punjab and Haryana received Direct Benefit Transfer (DBT).
    • Programme: ‘Aadi’, a Grow Indigo farmer carbon programme launched in 2019 with technical guidance from ICAR.
    • Practices adopted during 2019-2022:
      • Direct Seeded Rice (DSR)
      • Reduced/minimum tillage
      • Crop-residue management
    • Resulting greenhouse-gas reductions and soil-carbon increases were measured and independently verified.
    • Carbon credits were issued under Verra VM0042 methodology.
    • Programme covers:
      • 2 million+ acres
      • 1 lakh+ farmers
      • 7 states

    How Does Soil Carbon Payment Work?

    Sustainable farming practice → Measurement of GHG reduction/soil carbon → Independent verification → Carbon credits → Sale/issuance → Farmer payment

    • Farmers are paid according to their share of carbon credits generated from their fields.
    • First issuance covered around 30,000 acres and 50,000+ carbon credits.
    • Participating farmers received approximately ₹3,000-₹15,000.
    • Grow Indigo made payments from its own funds before the credits were fully sold.
    • Farmers could choose:
      • Assured upfront payment, or
      • 75% of net carbon revenue after credit sale.

    Environmental Benefits

    For enrolled fields during 2019-2022, the programme estimates:

    • 45 billion litres of water saved
    • More than 2 lakh tonnes of crop residue kept out of fires
    • Around 1,000 tonnes of PM2.5 emissions avoided
  • CAZRI moth bean varieties show resilience in an El Niño year [MENTION]

    Why in News

    Moth bean varieties developed by the Central Arid Zone Research Institute (CAZRI) performed with resilience during an El Niño year. El Niño is the warm phase of the Pacific ocean and atmosphere cycle that often suppresses the Indian monsoon.

    Static Context

    CAZRI is an ICAR institute at Jodhpur, Rajasthan, focused on arid zone agriculture and desertification research. Moth bean is a hardy arid legume grown in the rainfed drylands of western Rajasthan and Gujarat. It tolerates drought and poor soils, which makes it valuable for climate resilient cropping. Release specific yield figures could not be verified, as the PIB detail page did not resolve this run. The exam value here is the institute and the crop, not the unverified numbers.

    Prelims angle

    Place CAZRI at Jodhpur under ICAR. Recognise moth bean as a drought tolerant arid pulse. Recall that El Niño tends to weaken the southwest monsoon.

    Mains angle

    GS3, dryland agriculture and climate resilience. A supporting example for answers on drought resistant crops and rainfed farming.

    Matching Previous Year Question

    “[2012] Consider the following crops of India: 1. Groundnut 2. Sesamum 3. Pearl millet Which of the above is / are predominantly rainfed crop/crops?
    (a) 1 and 2 only
    (b) 2 and 3 only
    (c) 3 only
    (d) 1, 2 and 3
    Answer: (d)”

    PIB Link

    https://www.pib.gov.in/PressReleasePage.aspx?PRID=2309690&reg=3&lang=1

  • Dryland Congress 2026 concludes with the Delhi Declaration on Drylands

    Why in News

    The Dryland Congress 2026 concluded in New Delhi with the adoption of the Delhi Declaration on Dryland, also styled the 3D. The Congress ran from 10 to 12 September 2026 at the National Agricultural Science Complex, New Delhi.

    Core facts

    The Congress was organised by the Indian Council of Agricultural Research (ICAR) and the International Crops Research Institute for the Semi Arid Tropics (ICRISAT). It gathered over 800 experts from Asia, Africa and the Americas. The event marked 50 years of the ICAR and ICRISAT partnership. It deliberated on six themes: breeding, climate resilience, nutrition and markets, farming systems, seed systems, and gender and youth inclusion. Drylands span about 45% of the world’s land surface and support over two billion people.

    Static Context

    ICRISAT is a research centre headquartered at Hyderabad, working on crops of the semi arid tropics such as sorghum, pearl millet, chickpea, pigeonpea and groundnut. ICAR is the apex body for coordinating agricultural research and education in India, under the Ministry of Agriculture & Farmers Welfare. Dryland and rainfed farming is supported through the Rainfed Area Development (RAD) programme under the National Mission for Sustainable Agriculture (NMSA), which promotes Integrated Farming Systems (IFS). Land degradation in drylands connects to the United Nations Convention to Combat Desertification (UNCCD).

    Prelims angle

    Distinguish ICAR (Indian apex research body) from ICRISAT (international centre at Hyderabad). Link RAD and IFS to the NMSA. Associate desertification with the UNCCD. Know the semi arid tropic crops.

    Mains angle

    GS3, agriculture and cropping systems. Frame dryland and rainfed agriculture as central to crop diversification, climate resilience and farmer incomes, and the value of cooperation among developing countries in seed and breeding research.

    Matching Previous Year Question

    “[2026] Which among the following is/are the objective(s) of the Rainfed Area Development (RAD) initiative under the National Mission for Sustainable Agriculture (NMSA)?
    1. Encouraging monoculture in rainfed areas
    2. Increasing rice cultivation in irrigated regions
    3. Enhancing productivity and minimising climatic risks through Integrated Farming Systems (IFS)
    (a) 1 only
    (b) 1 and 2
    (c) 2 and 3
    (d) 3 only
    Answer: (d)”

    “[2021, GS3, 15 marks] What are the present challenges before crop diversification? How do emerging technologies provide an opportunity for crop diversification?”

    PIB Link

    https://www.pib.gov.in/PressReleasePage.aspx?PRID=2309628&reg=3&lang=1

  • Government could have foreseen the spike in sugar prices

    Why in the News

    Retail sugar prices surged to unprecedented levels in August, and the Union government has responded by allowing duty-free imports of 10 lakh metric tonnes of raw sugar until 31 October 2026, the first such window in a decade. The retail price rose 41 per cent, from Rs 46.27 per kilogram on 26 August 2025 to a high of Rs 65.05 on the same date this year. The government attributed the rise to festive season demand, hoarding, lower than expected production, tightening global supplies and weather related crop damage. An examination of the monthly price series and of the season’s production estimates shows that the tightening was signalled well in advance, which moves the question from what caused the spike to why it was not anticipated.

    Why does the government’s own explanation not hold?

    1. Five factors were cited: The rise was attributed to increased demand ahead of the festive season, hoarding, lower than expected production, tightening global supplies and weather related crop damage.
    2. The festive season argument fails on the data: Monthly all-India average retail prices since January 2016 show this year’s increase as an outlier, unseen ahead of or during any earlier festive season.
    3. The remaining factors were monitorable: Global supply pressure and the gap between estimated and actual production are variables the government tracks continuously.

    What warnings were available before August?

    1. A global price signal: In the first week of August, the Food and Agriculture Organization (FAO) of the United Nations reported that its Sugar Price Index, which tracks international export prices for sugar, had increased by 5.6 per cent in July, indicating the possibility of a further rise.
    2. The FAO named the causes: It attributed the increase to concerns over crop yields in the European Union from hot weather, and to El Nino related weather conditions affecting production in key Asian countries.
    3. Brazil was the larger signal: Expectations of lower sugar production in Brazil, the world’s largest sugar producer, pointed to pressure on global supplies.
    4. The assessment: On these indications, the tightening of domestic sugar availability was not entirely unforeseeable.

    Where did the production estimates go wrong?

    1. A large estimation gap: Initial estimates for 2025-26 sugar production were around 343 lakh tonnes, against a current estimate of around 306 lakh tonnes.
    2. Policy was set on the higher number: Exports were allowed and ethanol diversion targets were fixed on the basis of those initial estimates.
    3. The consequence: When actual production turned out lower, domestic availability became tighter than anticipated.
    4. The estimates ignored the State level trend: They were set high against a production trend that was declining or fluctuating in Uttar Pradesh and Maharashtra, which together account for 71 per cent of cane and 65 per cent of sugar production.

    What does the longer production trend show?

    1. The peak is four years old: All-India sugarcane production has declined since 2022-23, when it reached its highest level of 490.5 million metric tonnes.
    2. The decline was acknowledged: A reply to the Rajya Sabha in March 2025 recorded the fall, and held that production was still sufficient to cater to domestic needs.
    3. There is little export cushion: Of all sugar produced, 83 per cent is used for domestic consumption.
    4. Import dependence has one address: India’s sugar imports have predominantly come from Brazil.

    Is ethanol diversion the cause?

    1. The allegation: The Opposition attributed the price rise to the diversion of cane for ethanol production.
    2. The short term assessment: Ethanol diversion is not identified as a key reason for the current spike, and its weight over the longer term is a separate question.
    3. The feedstock has shifted: In recent years maize has occupied a major share of the feedstock for India’s ethanol blending, a change from the earlier heavy dependence on sugarcane.
    4. The historical test: No comparable price surge occurred in the years when ethanol production relied heavily on sugarcane.

    Challenges to sugar price management

    1. Cane pricing is administered and delinked from sugar realisation: The Centre fixes a Fair and Remunerative Price (FRP) for cane and several States announce a higher State Advised Price, so mills accumulate cane arrears whenever sugar prices fall. Eg. Uttar Pradesh has for years announced a State Advised Price above the central FRP.
      The Fix: Move to a revenue sharing formula that links the cane price to realisation from sugar and its by-products, as the Rangarajan Committee recommended in 2012.
    2. Trade controls swing between extremes: Export permissions and stock limits are switched on and off in reaction to price, which destroys planning certainty for mills and for farmers. Eg. India restricted sugar exports from the 2023-24 season after two seasons of large shipments.
      The Fix: Publish a rule based trigger that ties export and import decisions to a stated closing stock norm rather than to the price of the month.
    3. The crop concentrates water use in stressed basins: Sugarcane is among the most water intensive crops grown in India and takes a disproportionate share of irrigation where it is dominant. Eg. Cane cultivation in Maharashtra’s Marathwada region draws heavily on irrigation in years of deficient rainfall.
      The Fix: Make drip irrigation a condition for new mill licences and for cane area expansion in water deficit districts.

    Conclusion

    Prices have eased from the August peak and the import window is still open. The unresolved problem is not the import decision but the estimate that preceded it. What would change the outcome is a mid-season revision point at which export and diversion permissions are re-set against actual crushing data rather than pre-season projections. Without it, the next surprise in the cane crop will again be discovered at the retail counter.

    Back2Basics: Ethanol Blended Petrol Programme

    1. What it is: A programme of the Ministry of Petroleum and Natural Gas under which oil marketing companies blend ethanol into petrol before sale.
    2. Launch and target: It was launched in 2003 and was later given a target of 20 per cent blending, which the government advanced from 2030 to the 2025-26 ethanol supply year.
    3. Permitted feedstocks: Ethanol is procured from sugarcane juice and syrup, B-heavy and C-heavy molasses, damaged food grains, surplus rice and maize.
    4. Why it interacts with sugar: Procurement prices are fixed administratively for each feedstock, and the quantity of cane and molasses that may be diverted to ethanol in a season is regulated by the Department of Food and Public Distribution.

    Matching Previous Year Question

    “[2025] Consider the following statements: Statement I: Of the two major ethanol producers in the world, i.e., Brazil and the United States of America, the former produces more ethanol than the latter. Statement II: Unlike in the United States of America, where corn is the principal feedstock for ethanol production, sugarcane is the principal feedstock for ethanol production in Brazil. Which one of the following is correct in respect of the above statements? (a) Both Statement I and Statement II are correct and Statement II explains Statement I (b) Both Statement I and Statement II are correct but Statement II does not explain Statement I (c) Statement I is correct but Statement II is not correct (d) Statement I is not correct but Statement II is correct ANSWER: (d)”

  • Jute: India’s Golden Fibre

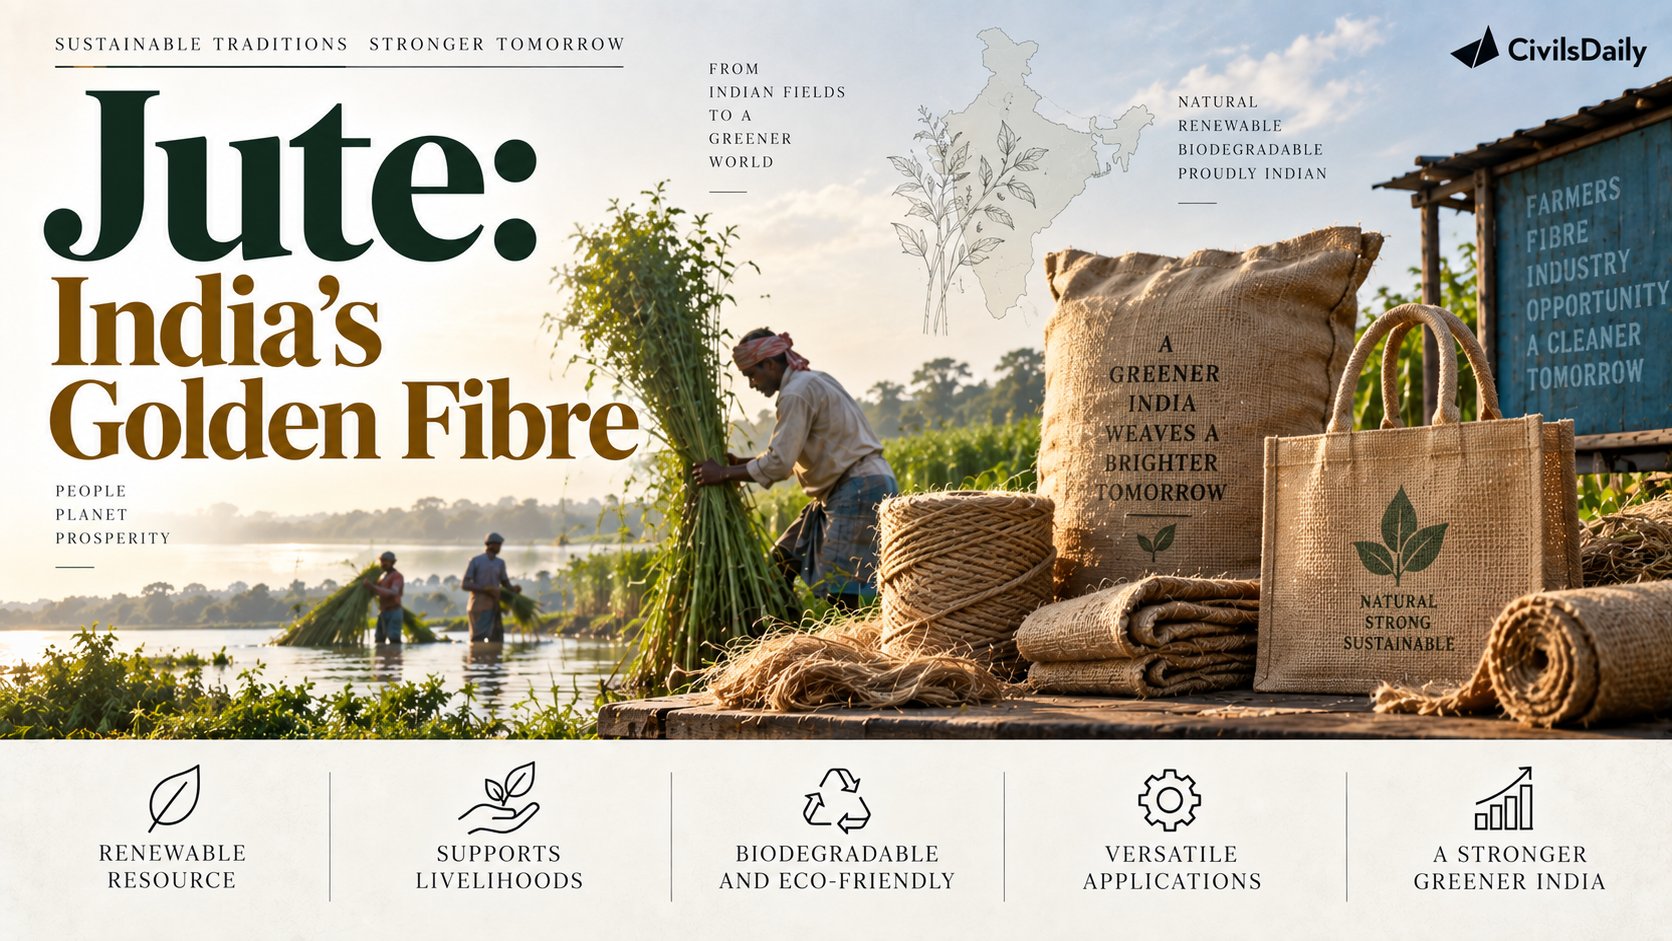
    Jute: India’s Golden Fibre

    Why in the News

    India is the world’s largest producer of raw jute. India produced 94.03 lakh bales of jute and mesta in 2025-26. India is also the leading producer of jute goods globally, accounting for around 75% of estimated world production. The sector supports nearly 40 lakh farm families and provides direct employment to around 3.70 lakh workers. Jute’s biodegradable and recyclable nature makes it an important alternative to synthetic materials.

    Jute: The Golden Fibre

    • Jute is called the “Golden Fibre” because of its golden colour and silky lustre.
    • Jute + Mesta are collectively classified as raw jute due to their similar end uses.
    • Mesta is a bast fibre crop and can serve as an alternative to jute, particularly in drier regions.
    • Major producing states: West Bengal, Bihar, Assam, Odisha, and Jharkhand
    • West Bengal has the largest concentration of jute mills.

    Agro-climatic Conditions

    • Requires hot and humid conditions.
    • Rainfall: around 700-1,500 mm during the growing period.
    • Generally sown during March-April.
    • Harvested within 100-110 days.
    • Cultivation is concentrated in eastern and northeastern India.
    • Predominantly rainfed and mainly cultivated by small and marginal farmers.

    Importance of Jute

    • Biodegradable and recyclable natural fibre.
    • Strong, durable, breathable and versatile.
    • Used in: Packaging, Agriculture, Construction, Industrial textiles, Technical textiles
    • Provides thermal and acoustic insulation.
    • Has high moisture absorption and low static generation.
    • Can be blended with natural and synthetic fibres for value-added products.

    Jute Geotextiles

    • Jute Geotextile (JGT) is a technical textile made from jute fibres.
    • Used for: Soil erosion control, Slope and embankment protection, Riverbank and canal protection, Road construction, Railway track formation, Drainage systems, Soft-soil stabilisation
    • Being biodegradable, it supports soil restoration and ecological regeneration.
    • Helps regulate soil temperature and reduce surface disturbance, supporting seed germination and plant establishment.

    Government Initiatives

    Minimum Support Price

    • MSP of raw jute for 2026-27: ₹5,925 per quintal.
    • Provides a 61.8% return over the all-India weighted average cost of production.
    • MSP increased from ₹2,400 per quintal in 2014-15.

    Jute Corporation of India (JCI)

    • Sole nodal agency for implementing MSP policy for raw jute.
    • Procures directly from farmers when market prices fall below MSP.
    • Operates through Departmental Purchase Centres (DPCs).

    National Jute Development Programme (NJDP)

    • Umbrella programme for development and promotion of the jute sector.
    • Implemented by the National Jute Board (NJB).
    • Focuses on:
      • Increasing farm productivity and farmer incomes.
      • Jute diversification.
      • Market development.
      • Promotion of jute as an alternative to plastics.

    JUTE-ICARE

    Improved Cultivation and Advanced Retting Exercise

    • Launched in 2015-16.
    • Promotes scientific cultivation, mechanisation and improved retting.
    • Supports farmers through certified seeds and field demonstrations.
    • Implemented with CRIJAF and JCI.

    Jute Diversification Scheme

    Promotes value addition through:

    • Jute Raw Material Banks
    • Jute Resource-cum-Production Centres
    • Capital subsidy for machinery
    • Jute retail outlets
    • Export incentives for jute diversified products

    Jute Packaging

    • The Jute Packaging Materials (Compulsory Use in Packing Commodities) Act provides for mandatory use of jute packaging for specified commodities.
    • Government mandates jute packaging for: 100% of foodgrains, and 20% of sugar

    Digital Initiatives

    JUTE-SMART

    • End-to-end e-governance platform for procurement and supply of jute sacking bags.
    • Developed by the Office of the Jute Commissioner.
    • Digitises procurement, registration and compliance processes.

    Jute Crop Information System

    • Developed by ISRO’s National Remote Sensing Centre (NRSC) in collaboration with JCI and NJB.
    • Uses remote sensing and field data to monitor jute cultivation.
    • BHUVAN JUMP: Mobile application for field-level jute monitoring.
    • PATSAN: Web-based platform providing near-real-time jute surveillance and analytics.

    Jute and Sustainable Development

    • Contributes to rural employment, environmental sustainability and green industrialisation.
    • Provides an alternative to plastic and synthetic materials.
    • Supports farmers, workers, artisans and MSMEs.
    • Promotes technical textiles through products such as jute geotextiles.
    • Creates opportunities for value addition and exports.

    [2011] The lower Gangetic plain is characterized by a humid climate with high temperature throughout the year. Which one among the following pairs of crops is most suitable for this region?

    (a) Paddy and cotton

    (b) Wheat and Jute

    (c) Paddy and Jute

    (d) Wheat and cotton.

  • [3rd September 2026] The Hindu OpED: Many layers

    [3rd September 2026] The Hindu OpED: Many layers

    Question (2024, GS3): “Elucidate the importance of buffer stocks for stabilizing agricultural prices in India. What are the challenges associated with the storage of buffer stock? Discuss.
    Linkage: This question directly addresses the core policy tool used in onion management: state-led procurement and buffer stocking to counter short-term price volatility. It highlights the storage and logistical bottlenecks that lead to post-harvest collapses.

    Mentor Comment

    Onion price management has again run through a sequence of export restrictions and post collapse procurement, and neither has protected the farmer or the consumer. Since the 1960s Indian food policy has balanced affordable consumer prices against remunerative producer prices, with state intervention aimed at managing short term volatility rather than the underlying cause. Erratic weather and the absence of long term relief have made that balancing act harder to hold. The tension is that every corrective step arrives after farmers have already made production decisions and after prices have already collapsed, so the intervention reaches neither all farmers nor all grades of produce.

    What has the Centre’s onion trade policy been since 2023?

    1. The export ban: The government banned onion exports from December 2023 to May 2024.
    2. The price floor that replaced it: A minimum export price of $550 per tonne was imposed, which sets the lowest price at which a consignment may legally leave the country and works as a soft restriction on exports. A 40 per cent export duty was imposed alongside it.
    3. The rollback: The duty was reduced to 20 per cent in September 2024 and abolished in April 2025.

    Why does intervention after the event fail farmers?

    1. Policy changes after the sowing decision: The government often changes its position after farmers have made production decisions based on the price they expected.
    2. The procurement price was below cost: During the rabi harvest, onion farmers in Maharashtra, the country’s principal supplier, argued that the Centre’s procurement price of ₹12.35 per kg would not cover cultivation costs.
    3. The correction came too late for many: The Centre subsequently raised the price to up to ₹26.45 per kg. Many farmers could not capture the higher value, including some who had already sold at ₹1 per kg because of low quality and lack of storage.
    4. Coverage is partial by grade: Intervening after prices have already collapsed does not reach all farmers or all grades of produce.

    What pressures exposed the flaw this year?

    1. Rainfall at the wrong point in the cycle: Abnormal rainfall at the time of harvest hit the crop directly.
    2. A kharif shortfall in the main supplying State: Maharashtra recorded a 5 per cent to 7 per cent drop in the kharif crop.
    3. Onion resists buffering: The known difficulties of storing onion and of maintaining large buffers compound every supply shock rather than absorbing it.
    4. Manipulation is the secondary issue: The government has alluded to some price manipulation, and the dominant problem remains that policy keeps reacting rather than acting in advance.

    What proactive measures does the record point to?

    1. Storage: Improving storage options is the first named measure, since it is what allows a crop to be held past a price trough.
    2. Trade policy stability: A less erratic trade policy would let farmers price the export channel into their sowing decisions.
    3. Inter regional movement: Moving stock more efficiently between regions addresses the distribution failure rather than the production one.
    4. Price shock protection: Protecting farmers against price shocks is the fourth measure, and it operates before a collapse rather than after it.

    Does Tamil Nadu’s targeted subsidy resolve the problem or move it?

    1. The design: Tamil Nadu will buy 1,000 tonnes of onions to distribute 1 kg per ration card at ₹35.
    2. What it gets right: The design discourages hoarding while allowing private retail prices to cool down.
    3. The delivery channel is the risk: Distribution runs through a dry grain public distribution system network, which was not built for a crop that spoils quickly.
    4. The economic case has a threshold: That case could collapse if post harvest losses exceed 10 per cent to 15 per cent, and onion is more susceptible to such losses than wheat or rice.
    5. Persistence is the second risk: The case also weakens if the subsidy has to be continued rather than used once.
    6. Replication would exhaust the buffer: If other States adopt similar measures, the Central buffer could be quickly exhausted, more so given this year’s high storage losses of around 30 per cent.
    7. Pressure transfers to the Centre: The State scheme will impose pressure on the Centre to maintain a steady supply behind it.

    Challenges to stabilising onion prices

    1. Onion is bulky, perishable and stored without a cold chain: Farm level storage relies on ventilated structures whose losses rise sharply in a wet post monsoon. Eg. The traditional onion chawls of Nashik are open sided sheds with no humidity control.
      The Fix: Link the storage capital subsidy to a verified ventilation and moisture standard rather than to built area alone.
    2. Production is geographically concentrated: A weather event in one district cluster moves the national price because supply is not spread across regions. Eg. Lasalgaon in Nashik sets the reference price for the country’s onion trade.
      The Fix: Build procurement and modern storage capacity in Madhya Pradesh, Karnataka and Gujarat so the national price is not set by one belt.
    3. Sudden trade restrictions cost long term market access: Buyers who lose supply once diversify permanently, so the export channel is thinner when the surplus returns. Eg. Bangladesh and Sri Lanka shifted to Chinese, Pakistani and Egyptian onion during the Indian export restrictions.
      The Fix: Announce any trade measure with a fixed minimum notice period and a stated expiry date written into the notification.
    4. Procurement covers only a buffer, not the crop: Agency purchase is sized to stabilise consumer supply, so the price the farmer receives is still set by the open market. Eg. National Agricultural Cooperative Marketing Federation of India (NAFED) buying is confined to buffer accumulation and market release.
      The Fix: Add a deficiency price payment triggered on the mandi price falling below assessed cultivation cost, paid directly rather than through purchase.
    5. Farmers sow without a forward price signal: Acreage decisions are made months before the price is known, which is what produces the alternating glut and shortage. Eg. A remunerative rabi price pulls extra acreage into the next kharif sowing and depresses that crop’s price.
      The Fix: Publish an official pre sowing advisory each season carrying expected national acreage and an indicative price band.

    Conclusion

    Onion policy is being run as a series of corrections applied after the price has already moved. What remains unreconciled is that every correction reaches the farmer after both the sowing decision and the distress sale are complete. Storage capacity and orderly movement of stock are the only interventions that operate before a collapse rather than after it. Whether the Centre holds one trade regime steady through a full price cycle is the test of whether the approach has changed.

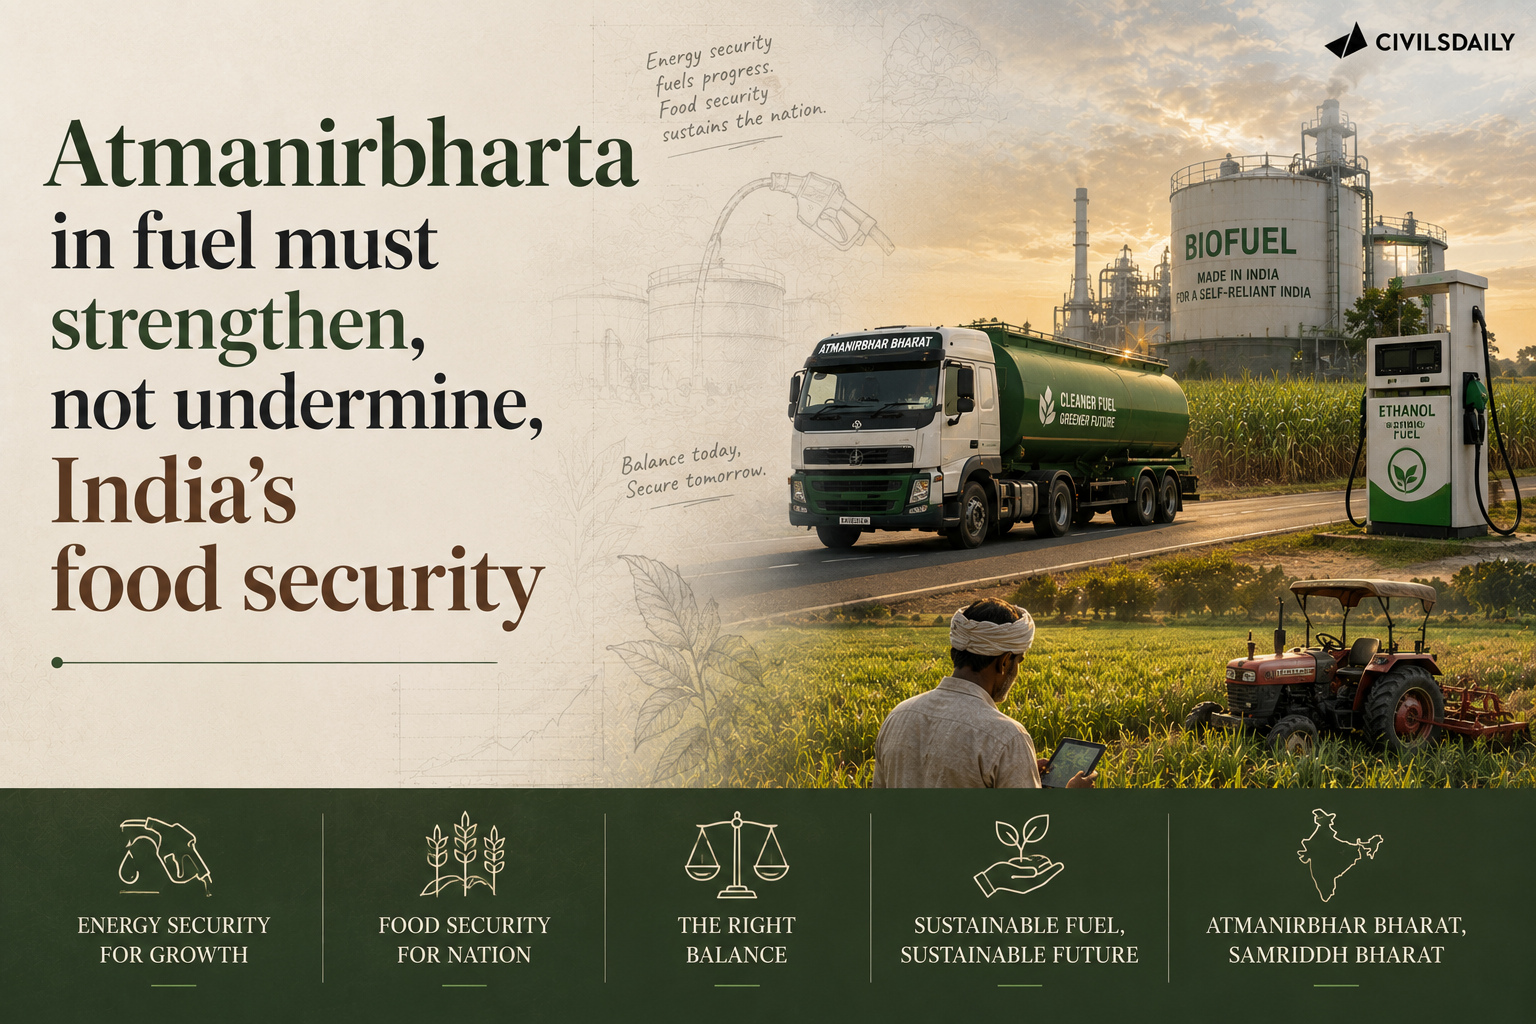
  • Atmanirbharta in fuel must strengthen, not undermine, India’s food security

    Atmanirbharta in fuel must strengthen, not undermine, India’s food security

    Why in the News

    The all India modal retail price of sugar has climbed from around Rs 45 a kg to about Rs 65 a kg within a month, an increase of nearly 44 per cent. The Union government has attributed the rise to hoarding by traders and millers and has threatened strict action. The rise follows a tightening of supply on three counts at once, arriving just before the festive season when sugar demand typically rises. The tension is that the same government fixes cane prices, sugar sales, imports, exports and the allocation of feedstock to ethanol, so a price spike inside a fully administered chain is a policy outcome rather than a market one.

    What is the Ethanol Blended Petrol Programme?

    1. What it requires: Oil marketing companies blend a mandated share of ethanol into the petrol they sell, which substitutes domestically produced fuel for imported crude.
    2. What it runs on: Ethanol is produced from sugarcane juice, syrup and molasses, and from surplus foodgrain such as rice and maize.
    3. How fast it scaled: Blending stood at 1.53 per cent in 2013-14, reached around 5 per cent by 2019-20 and 20 per cent in 2025-26, and feedstock supply did not keep pace with that trajectory.

    Why did sugar prices spike?

    1. The opening cushion had halved: Stocks at the start of the current sugar year, which runs October to September, were 5 million tonnes against 8 million tonnes a year earlier, leaving little room to absorb a fresh shock.
    2. Production came in below estimate: The 2025-26 output estimate was cut from about 34.3 million tonnes to 30.6 million tonnes on damage from red rot, a fungal disease that rots the cane stalk and destroys sucrose, and from top borer. About 27.35 million tonnes had been produced by June, so 3.25 million tonnes would have to arrive between July and September against a six season average of only 0.38 million tonnes for those months, pointing to a further cut to between 28 and 29 million tonnes.
    3. Ethanol removed supply at the worst moment: The ethanol programme diverted about 2.75 million tonnes of sugar at a time when supplies were already tight. That diversion is what turns energy policy into a competitor of the food market.

    Why can the market not correct the shortage on its own?

    1. Price signals are not allowed to act: In a more open economy a production shortfall corrects itself as higher prices pull in imports and trim consumption.
    2. Every step is administered: Sugarcane pricing, sugar sales, imports, exports and ethanol feedstock allocation are all decided by the government, so a correction has to be ordered rather than triggered.
    3. The calendar closes the escape route: Fresh cane will not reach mills in significant quantity until mid October, so the market must run on existing stocks through the festive demand peak.

    What correction does the assessment call for?

    1. Imports opened too narrowly: One million tonnes of duty free raw sugar has been allowed, against an assessed requirement of at least 3 to 4 million tonnes of refined sugar reaching the open market before and during the festive season. The 100 per cent import duty on refined sugar should be cut to zero or to 5 per cent.
    2. Shift the ethanol feedstock temporarily: Sugar based ethanol should be reduced sharply, with rice from Food Corporation of India (FCI) stocks held far above buffer norms taking its place. FCI should charge ethanol plants at least the procurement price of rice, if not its full economic cost.
    3. Import ethanol or lower the mandate: Ethanol can be imported directly when domestic feedstock is pushing up food prices, or the blending share can be brought down from 20 per cent to about 15 per cent.

    Does switching feedstock end the food versus fuel trade off?

    1. Maize is the least thirsty option: Maize does not consume as much water as rice or sugarcane, and it is already being used as a primary ethanol feedstock.
    2. Yield is the binding constraint: Maize productivity in India hovers around 3.5 tonnes per hectare against about 11 tonnes per hectare in the United States, so the surplus that fuel demand needs does not exist.
    3. The pressure moves to protein: Diverting more maize without a matching rise in output raises maize prices, and that passes into poultry meat, eggs and milk, where maize is the main feed.
    4. The trade off relocates rather than ends: Moving from sugar to rice or maize shifts the food versus fuel choice to a different crop, and closing it requires a large maize surplus, which raises the question of whether India will permit the genetically modified maize that drives United States yields.

    How should the ethanol programme be recalibrated?

    1. The basic number is missing: The net energy balance of each feedstock, meaning the energy returned against the energy spent producing it, has not been established, so allocation is being decided without it.
    2. Let the buyer choose the feedstock: Oil marketing companies could be given flexibility to source ethanol from the most economical feedstock, subject to safeguards for food security, farmers and the environment, in place of a rigid allocation from sugar, rice and maize.
    3. The state’s role narrows to the buffer: Government should hold strategic buffers and enforce food security safeguards rather than manage every feedstock allocation, and the programme itself needs a full evaluation of its design.

    Challenges to the Ethanol Blended Petrol Programme

    1. Capacity was financed against a fixed mandate: Distillery capacity was built on the assurance of a fixed blending share and long term offtake, so any temporary cut leaves loans outstanding against idle plants. Eg. The Ethanol Interest Subvention Scheme financed new and expanded distilleries through soft loans carrying a 6 per cent interest subvention. Fix. Convert the fixed target into a band with a stated floor, so capacity is financed against the floor rather than against a single number.
    2. The efficiency cost sits with the vehicle owner: Ethanol carries lower energy density than petrol, so mileage falls in engines not calibrated for the blend. Eg. Vehicles built before E20 compatibility became standard draw the same blend at the pump with no compensating price difference. Fix. Retain a lower blend grade at outlets serving older fleets, and publish blend specific mileage data at the pump.
    3. Two administered prices move at different speeds: The government fixes both the cane price and the ethanol procurement price, and only the cane price has been revised upward in successive seasons. Eg. Mills carrying distillation capacity report underutilisation as the margin on ethanol narrows. Fix. Index the ethanol procurement price to the cane price fixed under the same control order.
    4. The gains cluster geographically: Distillery capacity follows cane and grain surpluses, so the income the programme creates concentrates in a few States. Eg. Uttar Pradesh and Maharashtra, the two largest cane producing States, hold the bulk of cane based distillation capacity. Fix. Weight new capacity approvals toward maize growing districts, where the water saving is also largest.

    Conclusion

    Fuel self reliance and food security are traded against each other because the blending target was fixed as a number and the feedstock left to catch up. What to watch is whether the correction stops at emergency imports or reaches the design: a blending band replacing a fixed share, and feedstock chosen by the buyer against a stated food security safeguard. The maize yield gap decides whether the trade off can be closed at all rather than merely moved.

    The Sugar Industry in India

    1. Scale and geography: India is the second largest sugarcane producer, with output of 454.61 million tonnes in 2024-25, drawn mainly from Uttar Pradesh and Maharashtra.
    2. The dependent population: About five crore cane farmers and their families depend on the crop, alongside mill and ancillary unit workers.
    3. Mills are multi product units: Beyond sugar, a mill earns from ethanol, bagasse co-generated power, and press mud biogas and bio-fertiliser.

    Laws and Rules Governing the Sugar and Ethanol Sector

    1. Essential Commodities Act, 1955: Sugar is a scheduled commodity under it, so the Centre can impose stock limits and regulate sale and distribution.
    2. Sugarcane (Control) Order, 1966: Issued under that Act, it is how the Centre fixes the Fair and Remunerative Price payable by mills to cane growers.
    3. National Policy on Biofuels, 2018: Sets ethanol blending targets and permits cane juice, syrup, molasses and surplus foodgrain as feedstock, its 2022 amendment advancing the 20 per cent target.
    4. Foreign Trade (Development and Regulation) Act, 1992: Sugar exports are regulated through notifications issued under it, which placed raw, white and refined sugar in the prohibited category.

    Government Initiatives for the Sugar Sector

    1. Sugar Development Fund: Provides concessional loans for mill modernisation, crushing capacity expansion, co-generation and cane development.
    2. Pradhan Mantri JI-VAN Yojana: Supports second generation ethanol from crop residue rather than food grade feedstock.

    Challenges in the Sugar Sector

    1. Cane price and sugar price move independently: The Fair and Remunerative Price rose from Rs 285 a quintal in 2020-21 to Rs 340 in 2024-25 and Rs 355 for 2025-26, and the minimum selling price of sugar has stayed at Rs 31 a kg since 2019. Eg. Cane arrears recur in Uttar Pradesh whenever mill realisation lags the obligatory cane price. Fix. Adopt the Rangarajan Committee’s revenue sharing formula, linking cane payment to realisation from sugar and by-products.
    2. Export policy doubles as an inflation tool: Raw, white and refined sugar sit in the prohibited export category to protect domestic stocks and ethanol feedstock, costing mills global market access. Eg. Exporters lose long term contracts each time the category is switched mid season. Fix. Announce an export quota at the start of each sugar season against a stated closing stock norm, letting mills contract ahead.
    3. The highest recovery belt is the most water stressed: Maharashtra, Karnataka and Tamil Nadu record higher sucrose recovery and face the sharpest groundwater depletion. Eg. El Nino years have cut cane availability in Maharashtra and Karnataka and closed crushing seasons early. Fix. Make drip irrigation and fertigation under the Pradhan Mantri Krishi Sinchayee Yojana a condition for cane area expansion, with early maturing drought resistant varieties.
    4. The northern belt crushes longer and recovers less: Uttar Pradesh and Bihar run longer crushing seasons on lower sucrose recovery, with fragmented landholdings raising cane aggregation costs. Eg. A single national recovery benchmark treats a Bihar mill and a Kolhapur mill as comparable. Fix. Set belt specific recovery, crushing and payment benchmarks rather than one national norm.

    “[2025] Consider the following statements:

    Statement I: Of the two major ethanol producers in the world, i.e., Brazil and the United States of America, the former produces more ethanol than the latter.

    Statement II: Unlike in the United States of America, where corn is the principal feedstock for ethanol production, sugarcane is the principal feedstock for ethanol production in Brazil.

    Which one of the following is correct in respect of the above statements?

    (a) Both Statement I and Statement II are correct and Statement II explains Statement I

    (b) Both Statement I and Statement II are correct but Statement II does not explain Statement I

    (c) Statement I is correct but Statement II is not correct

    (d) Statement I is not correct but Statement II is correct

  • Government to introduce fortnightly sugar allocation

    Why in the News

    The Centre has decided to replace the existing monthly sugar quota system with a fortnightly allocation system from September. A physical verification of sugar stocks at mills found that many mills held stocks well beyond their declared monthly returns, that some mills engaged in short selling by selling less sugar than their monthly allocation, and that sugar sold at the start of a month was in some cases lifted by buyers only at the month’s end. The move tightens a monitoring system the government found could be gamed under a monthly cycle.

    Why did the government find the monthly quota system inadequate?

    1. Stock under-declaration: Physical verification showed many mills were holding stocks in excess of what they had declared in their monthly returns to the government.
    2. Short selling: Some mills sold less sugar than the quantity actually allocated to them under the monthly quota, without any monthly-cycle mechanism to catch the shortfall quickly.
    3. Delayed lifting by buyers: In some cases sugar sold by a mill early in the month was dispatched or lifted by the buyer only near the end of the month, defeating the purpose of a monthly release schedule.

    What does the new fortnightly system require?

    1. Split sale mandate: Mills must sell at least 40 percent of their fortnightly allocation in the first week and the remaining balance in the second week.
    2. Faster dispatch: Mills have been directed to dispatch sold sugar within a week of sale, closing the gap that allowed delayed lifting under the monthly system.
    3. Closer monitoring: A fortnightly cycle lets the government track the demand supply position more frequently, respond faster to market changes, and release additional quota where needed.

    Challenges to the fortnightly allocation system

    1. Compliance burden on mills: A fortnightly reporting and dispatch cycle roughly doubles the administrative and logistical load mills previously carried under a monthly system. Eg. Mills must now furnish dispatch proof and stock declarations twice as often, straining smaller mills with limited administrative staff. Fix. Phase in stricter reporting first for mills previously flagged for under-declaration or short selling, rather than applying the full compliance load uniformly from day one.
    2. Enforcement capacity: The scheme depends on the government’s ability to verify declarations at the mill level frequently enough to catch violations before the next cycle begins. Eg. The August verification exercise that triggered this shift was itself a one-time physical check, not a standing monitoring mechanism. Fix. Institutionalise periodic third-party stock audits rather than relying on ad hoc verification drives.

    Conclusion

    The fortnightly allocation system is a direct administrative response to mill-level under-declaration, short selling and delayed dispatch uncovered during stock verification. Crushing for the new sugar year begins on 15 October, with production of 10 lakh tonnes expected in October and 45 lakh tonnes in November, and mills are free to sell without restriction through October.

    Matching Previous Year Question

    No direct PYQ traced in the provided files.

  • Centre lifts ban on wheat exports amid depressed local prices

    Why in the News

    The central government has lifted the ban on wheat exports that it had imposed in 2022, citing depressed domestic wheat prices. The 2022 ban was put in place after a heatwave-hit domestic harvest and global supply disruption from the Russia-Ukraine conflict pushed both international and domestic wheat prices sharply higher, and the government moved to restrict exports to protect domestic supply and price stability. Domestic prices now running below the level that supports farmer incomes has produced the opposite problem the 2022 ban was designed for, prompting the reversal.

    Why was the wheat export ban imposed in 2022, and why lift it now?

    1. 2022 ban responded to a domestic and global price spike: The government banned wheat exports in May 2022 after a heatwave curtailed India’s wheat harvest just as global wheat prices were rising sharply due to the Russia-Ukraine conflict’s disruption of Black Sea grain exports.
    2. Ban was meant to protect domestic food security and price stability: Restricting exports kept domestic wheat supply from being drawn down by exporters chasing the higher international price, a measure meant to shield Indian consumers and the government’s own procurement operations from a global price shock.
    3. Current problem is the reverse, depressed domestic prices: Domestic wheat prices have since fallen to a level the government now assesses as too low to adequately support farmer incomes, the opposite condition from the one that justified the 2022 ban.
    4. Lifting the ban allows exports to absorb surplus domestic supply: Reopening exports gives farmers and traders an additional market outlet beyond domestic demand, which is expected to support prices by allowing surplus stock to move into export channels rather than depressing the domestic market further.

    What does this reversal say about India’s wheat trade policy stance?

    1. India is the world’s second-largest wheat producer: India’s scale of wheat production means its export policy decisions, in either direction, have a visible effect on global wheat supply and price, well beyond India’s own domestic market.
    2. Export policy is being used actively as a price-stabilisation lever: Moving from a ban to a lifted ban within a few years shows the government treating wheat export policy as an active tool to manage domestic price swings in both directions, rather than as a fixed, long-term trade stance.
    3. Signals confidence in current domestic stock levels: Lifting the ban implies the government assesses domestic wheat stocks, including those held for the public distribution system, as adequate to permit exports without risking a repeat of the price and supply concerns that triggered the original ban.

    Conclusion

    The reversal of the 2022 wheat export ban reflects a shift from a supply-protection concern to a price-support concern, as depressed domestic prices have replaced the earlier worry about a domestic and global supply shock. How much export volume actually moves, and how far domestic prices recover, will determine whether the reversal achieves its intended effect for farmers.

    Back2Basics: Minimum Support Price and wheat procurement

    1. The Minimum Support Price (MSP) is the price at which the government commits to procure specified crops, including wheat, from farmers, intended to guarantee a floor price regardless of market fluctuations.
    2. Wheat procurement for the MSP system, along with the Public Distribution System’s buffer stock requirements, is carried out mainly by the Food Corporation of India.
    3. A gap between the market price farmers actually receive and the announced MSP is one of the triggers that can prompt a trade-policy response such as an export ban or its reversal.
    4. India’s wheat export policy has swung between restriction and liberalisation multiple times in recent years, tracking domestic price and stock conditions.

    Matching Previous Year Question

    “[2024, GS3, 15 marks] Elucidate the importance of buffer stocks for stabilizing agricultural prices in India. What are the challenges associated with the storage of buffer stock? Discuss.”