💥Join UPSC 2027,2028 Mentorship (July Batch) + XFactor Notes & Microthemes PDF

GS Paper: GS2-14.Issues relating to poverty and hunger

  • How far do you agree with the view that the focus on lack of availability of food as the main cause of hunger takes the attention away from ineffective human development policies in India?

    Despite being the largest foodgrain producer (73 million tonnes of buffer stock) and running the world’s largest food security programs (NFSA), India ranks 102nd out of 123 countries in the Global Hunger Index 2025.

    Focus on Lack of Availability of Food

    NFSA, 2013: 5 kg subsidized food grains/month to 67% of India’s population.

    PM Garib Kalyan Anna Yojana: Extended free food grain distribution during and post-COVID.

    ICDS and Mid-Day Meal Scheme: Supply meals to pregnant women, lactating mothers, and children to combat calorie deficiency.

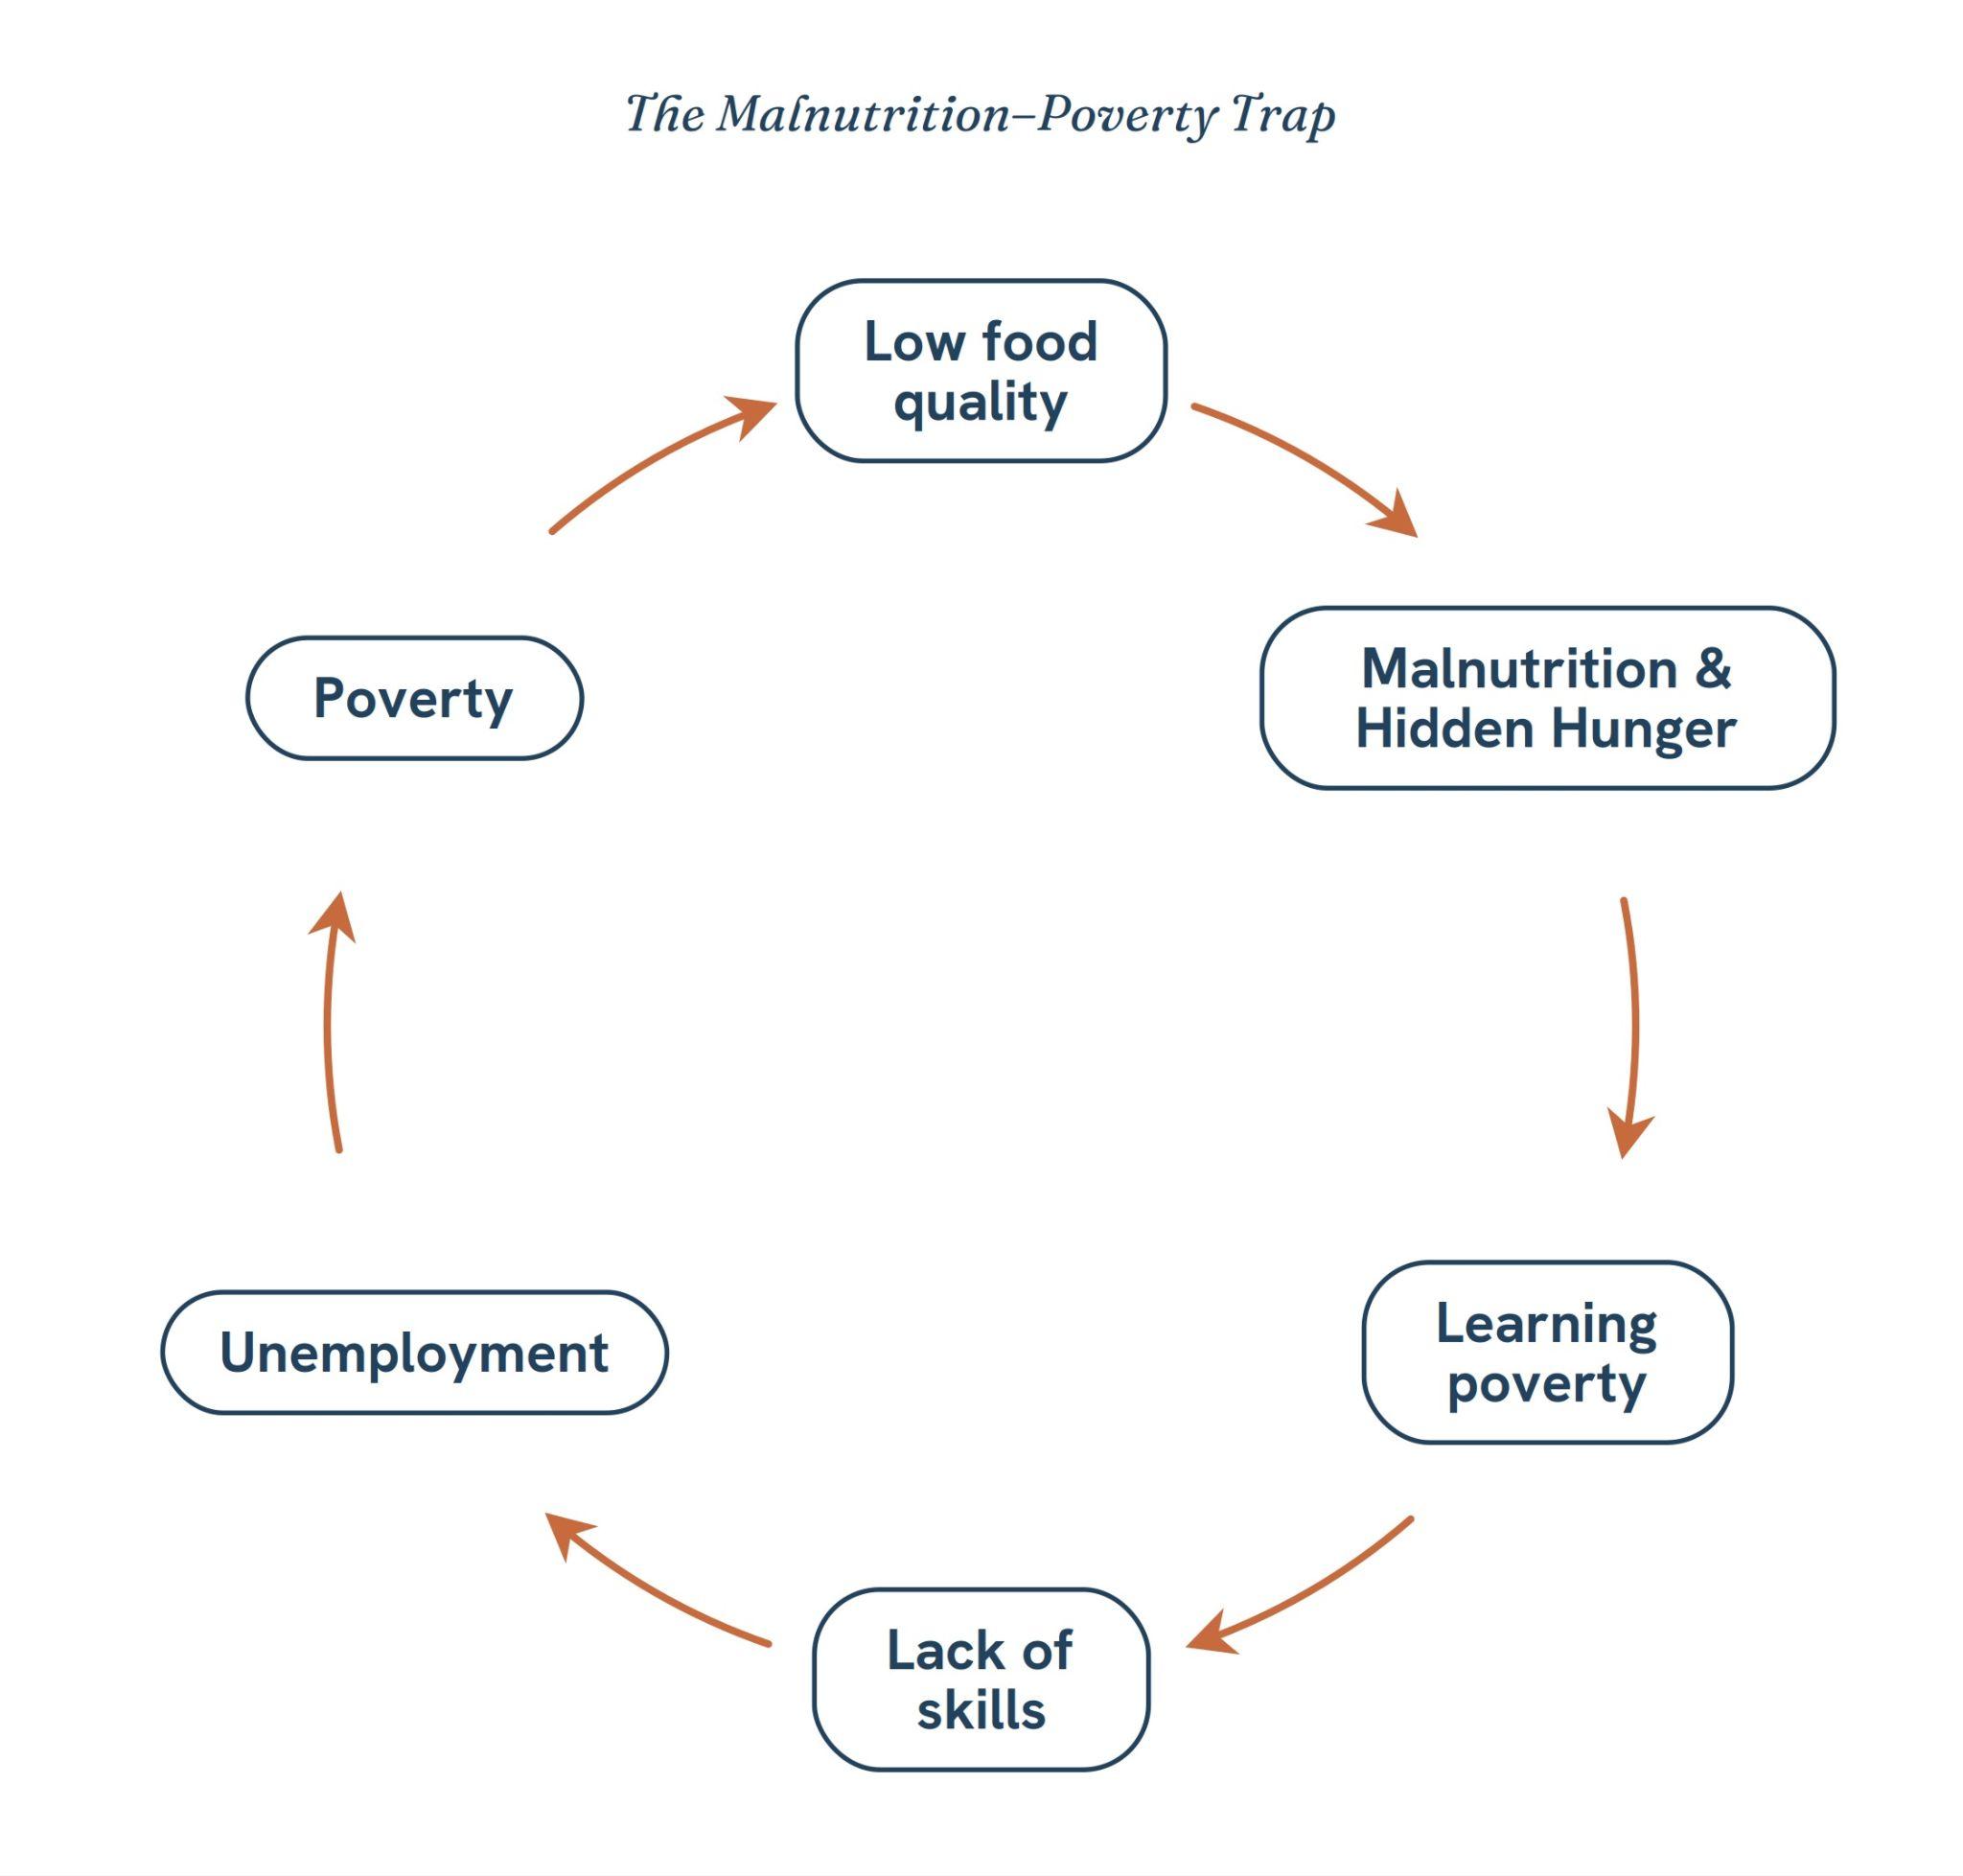
    Persistent Malnutrition: NFHS-5 shows stunting (32.9%), wasting (18.7%), and underweight (32%) children despite extensive food programs.

    High Anemia Levels: 57% of women and 67% of children are anemic – a form of hidden hunger linked to poor micronutrient intake, not lack of food.

    SOFI 2025: 12% of Indians remain undernourished despite record food production.

    Global Hunger Index 2025: score of 25.8 (Serious).

    Ineffective Human Development Policies in India

    Health System Deficiencies: Poor healthcare access, high maternal mortality, inadequate disease prevention, and sanitation deficits worsen malnutrition.

    Education Gaps: Lack of nutrition awareness, hygiene education, and poor child care practices perpetuate undernutrition despite food access.

    Feminization of poverty: Low female labor participation, limited autonomy, and poor maternal nutrition cause intergenerational hunger.

    A large share of the workforce (90%) remains in low-paid informal jobs, restricting food affordability and living standards.

    Limited Funding – Public spending on health (~1.9% of GDP) and education (~2.9% of GDP) remains below global averages, weakening capability-building.

    Income Poverty and Inequality: The poorest 10% spend over 60% of income on food, leaving little for health or education.

    Jobless Growth: Despite 7%+ GDP growth, unemployment among youth remains 17.3% (PLFS 2022-23).

    Steps Taken to Address the Broader Dimensions of Hunger

    Saksham Anganwadi and Poshan 2.0: Modernizes ICDS infrastructure and promotes dietary diversity through fortified foods.

    Ayushman Bharat and PM Jan Arogya Yojana: insurance coverage to 50Cr population

    Swachh Bharat Mission & Jal Jeevan Mission: Improve sanitation and safe water, reducing nutrient loss due to infections.

    MGNREGA, NRLM, and PM-KISAN: Provide livelihood and income support to improve household food affordability.

    Women Empowerment Initiatives: Mobilizing over 1 crore women into 9.96 lakh Self-Help Groups (SHGs) under NULM

    Millets Promotion under “Shree Anna” – Integration of nutri-cereals (e.g. ragi, bajra, jowar) into PDS, ICDS and PM POSHAN

    Way Forward

    Promote diet diversity (millets, pulses, vegetables) through PDS reform.

    Increase public investment in health (2.5%) and education (6%) to strengthen human capital.

    Adopt data-driven local interventions under Aspirational Districts Programme to target high-burden regions.

    Adopt Brazil’s Bolsa Família conditional cash transfer scheme

    Scale State level best practices like TN’s inclusion of Eggs in MDM

    India’s vision of ‘Sabka Saath, Sabka Vikas’ demands inclusive nutrition as the foundation for sustainable human development.

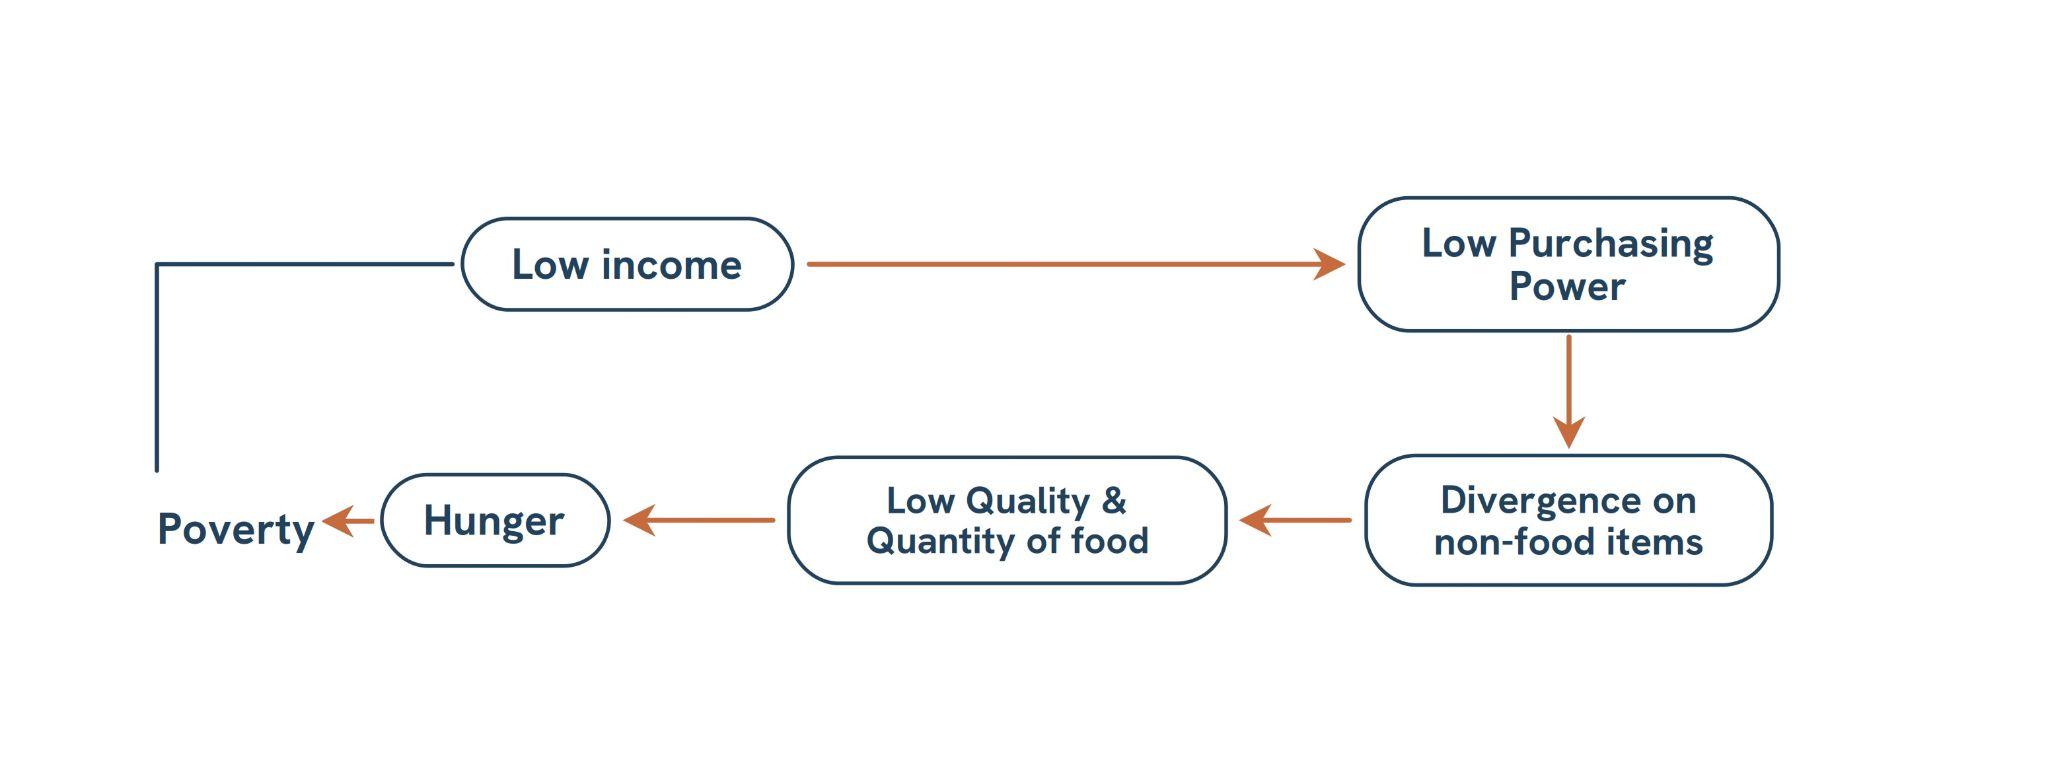
  • There is a growing divergence in the relationship between poverty and hunger in India. The shrinking of social expenditure by the government is forcing the poor to spend more on Non- Food essential items squeezing their food – budget.- Elucidate.

    While extreme poverty fell to 2.35% (World Bank, 2024), undernourishment (12%) and child wasting (18.7%) persist (SOFI 2025).

    Growing Divergence between Poverty and Hunger

    Decline in Monetary Poverty: About 24.82 crore individuals escaped multidimensional poverty in the last 9 years. (NITI Aayog)

    Persistence of Hunger and Malnutrition:

    Despite surplus food production, India’s GHI score (25.8) remains in the “serious” category.

    Indicators such as stunting (32.9%), wasting (18.7%), and anemia (57% women) reveal continued deprivation.

    Shift from Absolute Hunger to Hidden Hunger: 57% of women and 67% of children are anemic

    Shrinking of Social Expenditure by the Government

    Education expenditure: ~2.9% of GDP (NEP recommendation 2020).

    Decline in allocation for MGNREGA

    Impact on Poor Households:

    Health: Out-of-pocket health spending forms 40% of total health expenditure (NHA 2023).

    Indian Middle class is 1 Hospital Bill Away from poverty

    Education: Rising private tuition and school costs strain household budgets.

    Learning poverty – Over 70% of Class 3 students cannot read age-appropriate texts (ASER 2025)

    Utilities and fuel: Increasing electricity, rent, and LPG costs raise non-food spending.

    Proliferation of slums – 17% urban population living in slums

    Way Forward

    Social Determinants Approach: Integration of hunger and poverty with nutrition, sanitation (Swachh Bharat), and clean energy (Ujjwala Yojana).

    Nutrition-Sensitive Policies: Diversify PDS with millets, pulses, fortified foods, and region-specific nutrition interventions.

    Adopt data-driven local interventions under Aspirational Districts Programme to target high-burden regions.

    Adopt Brazil’s Bolsa Família conditional cash transfer scheme

    Scale State level best practices like TN’s inclusion of Eggs in MDM

    This can help achieve SDG 1, 2 and realise Atmanirbhar Bharat.

  • “The incidence and intensity of poverty are more important in determining poverty based on income alone”. In this context analyse the latest United Nations Multidimensional Poverty Index Report.

    As per World Bank, Poverty is a “pronounced deprivation in well-being” which includes low incomes and the inability to acquire basic goods and services necessary for survival with dignity.

    Incidence (H): The proportion of the population who are multidimensionally poor (i.e., deprived in a set share of weighted indicators).

    Intensity (A): The average share of deprivations experienced by the multidimensionally poor.

    MPI value (H × A): Combines incidence and intensity, capturing both how many are poor and how deprived they are beyond the income dimension.

    Why Incidence and Intensity Matter More than Income Alone

    Comprehensive Understanding: Income tells how much money people have, while incidence and intensity show what capabilities they lack.

    Reveals Depth of Deprivation: Two people may have the same income, but one may suffer more due to lack of education or sanitation – intensity captures this depth.

    Targets Policy Better: Helps governments identify which dimensions (health, education, housing) need priority investment.

    Explains Poverty Despite Income Growth: India’s poverty rate has declined (2.35% extreme poverty, World Bank 2024), yet hunger, malnutrition, and illiteracy persist – showing income growth doesn’t equal welfare growth.

    Measures Human Development, Not Just Economics: Aligns with Amartya Sen’s Capability Approach – poverty is deprivation of basic freedoms and opportunities, not just low income.

    Global Multidimensional Poverty Index (MPI) Report 2025

    Global Poverty Statistics – 1.1 billion (18.3%) people in acute multidimensional poverty. Majority are young, rural, and living in low human development countries

    MPI Reduction Trends – Of 88 countries with comparable data, 76 saw a decline in MPI at least once

    Multidimensional Poverty in India

    Poverty fell from 55.1% (2005-2006) to 16.4% (2019-2021)

    About 415 million people exited multidimensional poverty

    Poverty and Climate Interlinkages

    32 million people displaced by climate-related shocks in 2022

    309 million poor people live in regions with three or four overlapping climate hazards

    Without strong climate action, extreme poverty could nearly double by 2050

    MPI Across Income Levels

    64.5% of global poor live in middle-income countries

    55.5% in lower-middle-income nations

    9% in upper-middle-income nations

    Common Global Deprivations

    Clean cooking fuel: 970 million deprived

    Adequate housing: 878 million deprived

    Sanitation: 830 million deprived

    Undernutrition: 635 million deprived

    Children out of school: 487 million deprived

    Limitations of the Global MPI

    Data Gaps: Many countries rely on outdated or incomplete household surveys; MPI data lags actual conditions.

    Uniform Weights and Indicators: Equal weighting (health, education, living standards) may not reflect local priorities or contexts.

    Intra-country Variations: National averages mask disparities between rural-urban areas, genders, and regions.

    No Vulnerability Capture: MPI measures current deprivation but not people at risk of falling back into poverty.

    Way Forward

    Social Determinants Approach: Integration of hunger and poverty with nutrition, sanitation (Swachh Bharat), and clean energy (Ujjwala Yojana).

    Adopt data-driven local interventions under Aspirational Districts Programme to target high-burden regions.

    Adopt Brazil’s Bolsa Família conditional cash transfer scheme

    Poverty is the worst form of violence – Mahatma Gandhi.

    A whole of government and whole of society approach is needed to achieve SDG-1

  • Besides the welfare schemes, India needs deft management of inflation and unemployment to serve the poor and the underprivileged sections of the society. Discuss.

    The Indian Constitution envisions a Welfare State under the DPSP (Articles 36-51), mandating the State to ensure social, economic, and political justice through equitable development. However, impact is undermined by macroeconomic instability, particularly high inflation (8%) and unemployment (6-8%).

    Welfare Schemes

    Financial Inclusion

    PM Jan Dhan Yojana -55 Cr accounts opened

    Aadhaar -1.35 Billion generated

    Direct Benefit Transfer (DBT) -minimizes leakages.

    Social Security Nets

    Atal Pension Yojana for unorganised sector workers.

    PM Maan Dhan Yojana -old-age income security

    Food Security

    Atal Kalyan Yojana / PMGKAY – 67% population covered

    Mid-Day Meal (PM Poshan)

    Support for Vulnerable Sections

    PM Matru Vandana Yojana

    Ayushman Bharat

    Skills and Training

    PM Kaushal Vikas Yojana (PMKVY)

    ‘Earn While You Learn’ Scheme

    Social Infrastructure

    Swachh Bharat Mission

    Ujjwala Yojana -10 Cr LPG connections

    Gram Sadak Yojana

    Women and SC-ST empowerment

    PM Mudra Yojana

    Stand-Up India

    The Impact of Inflation on the Poor

    Erosion of Real Income: Inflation disproportionately affects low-income households as food and fuel form over 50% of their consumption basket.

    Reduced Effectiveness of Welfare Schemes: High prices diminish the real value of cash transfers under DBT or PM-Kisan.

    Rural Distress: Inflation widens the rural-urban gap, as agricultural incomes lag behind input costs (fertilizer, diesel).

    Fiscal Stress: Rising subsidy bills due to inflation crowd out developmental spending.

    Unemployment and Its Consequences for the Poor

    Jobless Growth: Despite 7%+ GDP growth, unemployment among youth remains 17.3% (PLFS 2022-23).

    Informalisation: Around 90% of India’s workforce remains in the informal sector, lacking job security or social protection.

    Poverty Persists12.9% Indians still multidimensionally poor (NITI Aayog, 2023).

    Gender Disparity: Female LFPR, though improved to 41% (2022-23), still trails male LFPR (78%) and Global Average (48%)

    Welfare Dependency: Lack of stable income pushes people to rely on welfare transfers, which creates fiscal burden and undermines self-reliance.

    Policy Measures for Deft Management

    Inflation Management:

    Strengthen Monetary-Fiscal Coordination between RBI and Ministry of Finance.

    Build food supply buffers via eNAM and cold chain networks.

    Promote energy transition to reduce import-driven inflation.

    Employment Generation:

    Expand PM Vishwakarma, PMEGP, and Start-Up India for entrepreneurship.

    Promote labour-intensive sectors – textiles, food processing, tourism. (Economic Survey)

    Urban MGNREGA to reduce urban poverty

    Invest in green and digital jobs through the IndiaAI Mission and National Green Hydrogen Mission.

    Integrate Skill India with industry demand mapping.

    Capability Approach: increase expenditure on Health (2.5% of GDP) and Education (6% of GDP)

    Only by aligning macro-economic management with social justice objectives can India realise the vision of “Sabka Saath, Sabka Vikas, Sabka Vishwas”

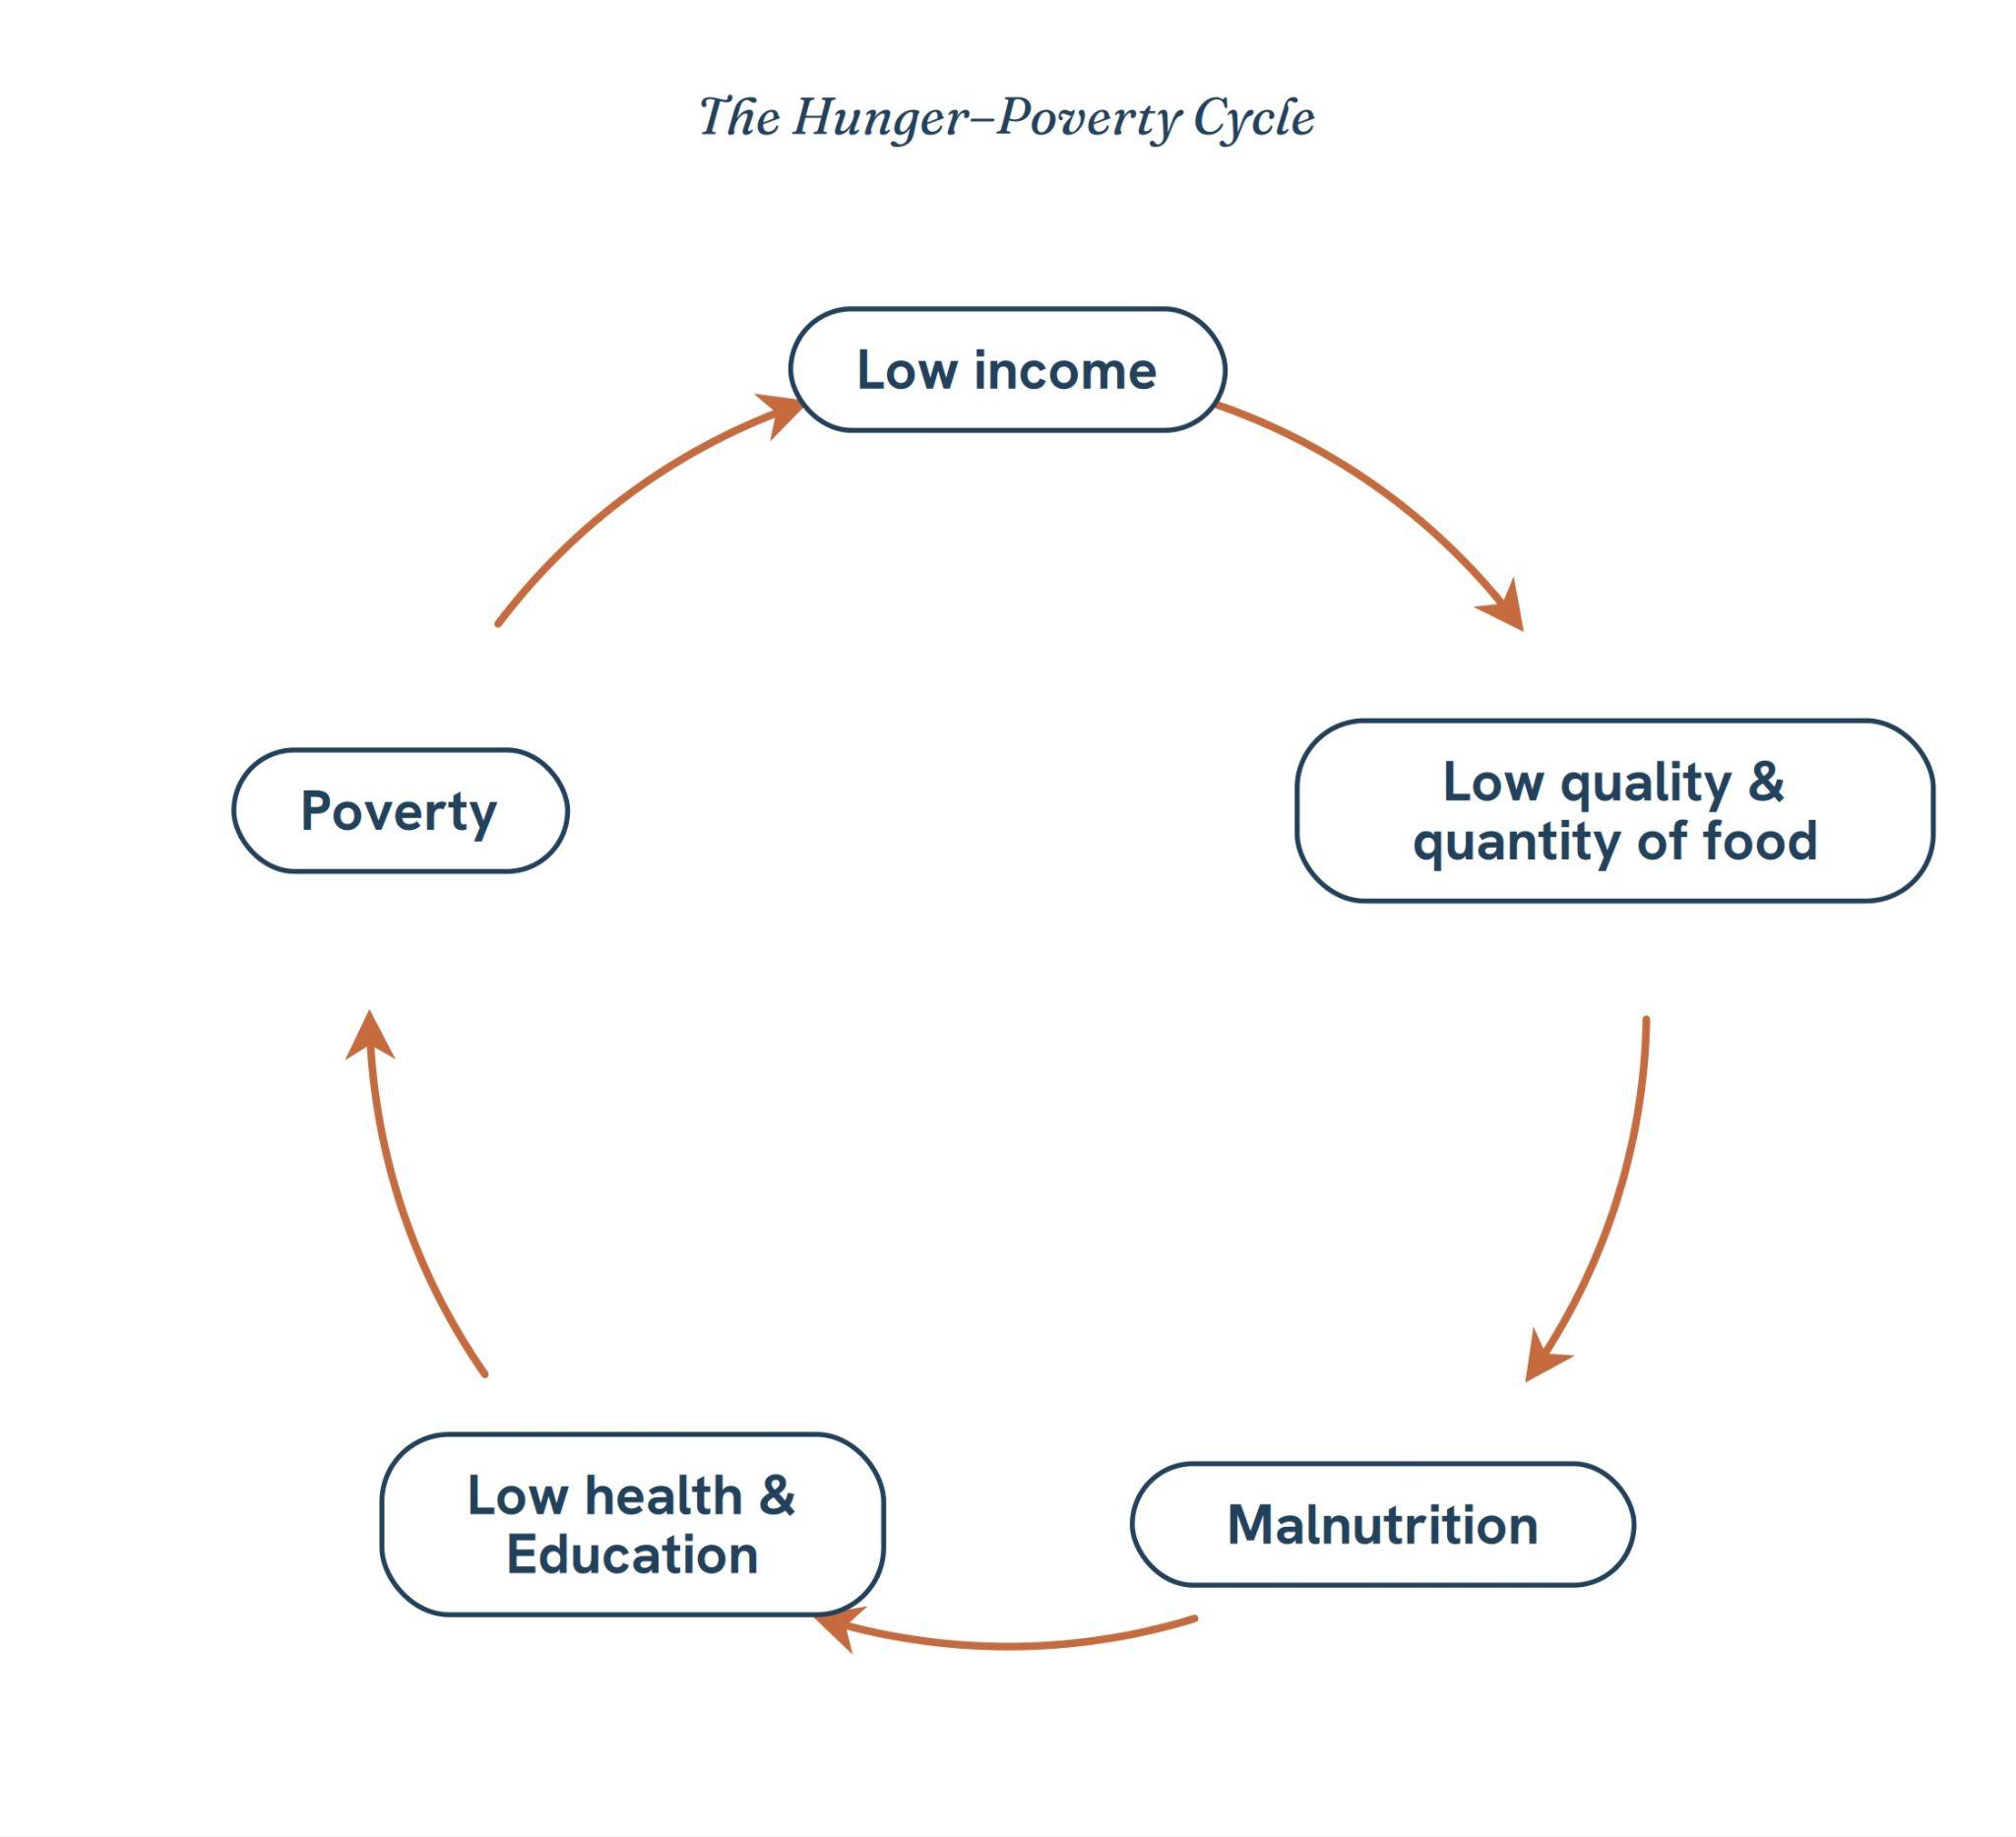
  • Poverty and malnutrition create a vicious cycle, adversely affecting human capital formation. What steps can be taken to break the cycle?

    Impact of poverty and malnutrition on Human Capital Formation

    World Bank (2024): India loses nearly 4% of GDP annually due to malnutrition-related productivity loss.

    Chronic malnutrition causes stunting and wasting among children, leading to weaker immunity and frequent illness.

    Impact on Cognitive Development – Poverty forces children into child labor or causes school dropouts. Malnourished children suffer from impaired brain development, lower IQ, and learning disabilities.

    High disease burden (anaemia, diarrhoea, TB) reduces life expectancy and working life span. Malnutrition contributes to 45% of child deaths (UNICEF, 2024).

    The International Labour Organization (ILO) notes that productivity losses due to undernutrition can reach up to 10% of lifetime earnings per individual.

    Women’s malnutrition (57% anaemic, NFHS-5) leads to poor maternal health and undernourished children.

    Expand NFSA and PMGKAY to include pulses, millets, and fortified foods, not just cereals.

    Steps to break the cycle

    Encourage local community kitchens and anganwadi-based feeding programs. Eg- TN Amma Canteens

    Strengthen Pradhan Mantri Matru Vandana Yojana (PMMVY) to ensure 1000-day nutrition support (pregnancy to age 2)

    Health and Sanitation Reforms

    Expand Ayushman Bharat – Health and Wellness Centres to deliver preventive and curative services.

    Water, Sanitation, and Hygiene (WASH): Accelerate Jal Jeevan Mission for clean drinking water.

    Expand MGNREGA and link with climate-resilient livelihoods (water conservation, afforestation).

    Women Empowerment by adopting best practices like Kerala’s Kudumbshree Model

    Integrated Policy Framework: Ensure coordination across ministries. Gati Shakti Mission Model

    Adopt data-driven local interventions under Aspirational Districts Programme to target high-burden regions.

    Adopt Brazil’s Bolsa Família conditional cash transfer scheme

    This can ensure whole of government and life-cycle approach to realise the vision of Viksit Bharat@2047

  • Inequality in the ownership pattern of resources is one of the major causes of poverty. Discuss in the context of ‘paradox of poverty’.

    The “paradox of poverty” refers to the coexistence of abundant resources and persistent poverty. This paradox arises primarily due to inequality in the ownership and control of resources.

    Paradox of poverty

    Growth with Poverty – India is the 5th largest economy, yet 16.4% population lives in multidimensional poverty (NITI Aayog, 2023).

    Urban Prosperity vs Slums – Cities contribute over 60% of GDP, but 65 million people live in urban slums.

    Link Between Resource Inequality and Poverty

    Land Ownership Inequality

    According to NSSO 77th Round (2019), the top 10% of landowners control over 50% of agricultural land, while landless households form nearly 55% of the rural poor.

    Small and marginal farmers face low productivity, credit exclusion, and income insecurity, perpetuating poverty.

    Capital and Wealth Concentration

    The Oxfam Inequality Report (2024) notes that the top 1% of Indians own over 40% of national wealth, while the bottom 50% own only 3%.

    This leads to unequal access to investment, employment, and enterprise opportunities, reinforcing poverty among asset-poor households.

    Unequal Access to Education and Skills – Poor families cannot invest in quality schooling, health, or digital access, resulting in low productivity and employability. This inequality in knowledge resources leads to income disparity.

    Gender and Social Inequality

    Only 13% of agricultural landholders in India are women (Agriculture Census 2021).

    These groups remain disproportionately poor, illustrating how resource inequality and social hierarchy reinforce each other.

    Regional Disparities

    States rich in natural resources (e.g., Jharkhand, Odisha, Chhattisgarh) also show high poverty and low human development — a clear manifestation of the resource paradox.

    Extraction without equitable sharing of benefits creates “resource curse” poverty.

    Other Causes of Poverty

    Colonial Legacy: deindustrialization of the economy and exploitation of agricultural resources. Eg- India’s GDP share fell from 24.4% in 1700 to 4.2% in 1950

    Jobless Growth: Despite 7%+ GDP growth, unemployment among youth remains 17.3% (PLFS 2022-23).

    Governance and Policy Failures due to high centralization, corruption, and overlapping. Eg- 30% of NREGA payments are delayed beyond the 15-day limit.

    Populism rather than capacity building: Eg: Free Power Scheme in Punjab.

    Polycrisis – multiple crises of slow economic growth, increased fragility, climate risks, and heightened uncertainty have come together at the same time. (WB)

    Way Forward

    Social Determinants Approach: Integrate health with nutrition, sanitation (Swachh Bharat), and clean energy (Ujjwala Yojana). Eg- Gati Shakti Mission Model

    Expand MGNREGA and link with climate-resilient livelihoods (water conservation, afforestation).

    Women Empowerment by adopting best practices like Kerala’s Kudumbshree Model

    Adopt data-driven local interventions under Aspirational Districts Programme to target high-burden regions.

    Adopt Brazil’s Bolsa Família conditional cash transfer scheme

    Land and Asset Redistribution: Promote tenancy rights and women’s joint land ownership.

    Inclusive Financial Access: Strengthen PM Jan Dhan-Aadhaar-Mobile (JAM) and MUDRA loans for micro-entrepreneurs.

    As Amartya Sen observed, poverty is not merely lack of income but lack of capabilities. Bridging resource inequality is key to achieving inclusive growth and social justice (Article 39 (b) & (c)).

    International Relations