Mains Ready By December. Smash Mains & Smash PYQ Admissions Open

GS Paper: GS3-13.Infrastructure: Energy, Ports, Roads, Airports, Railways etc:

  • Green Highways: Sustainable Road Infrastructure

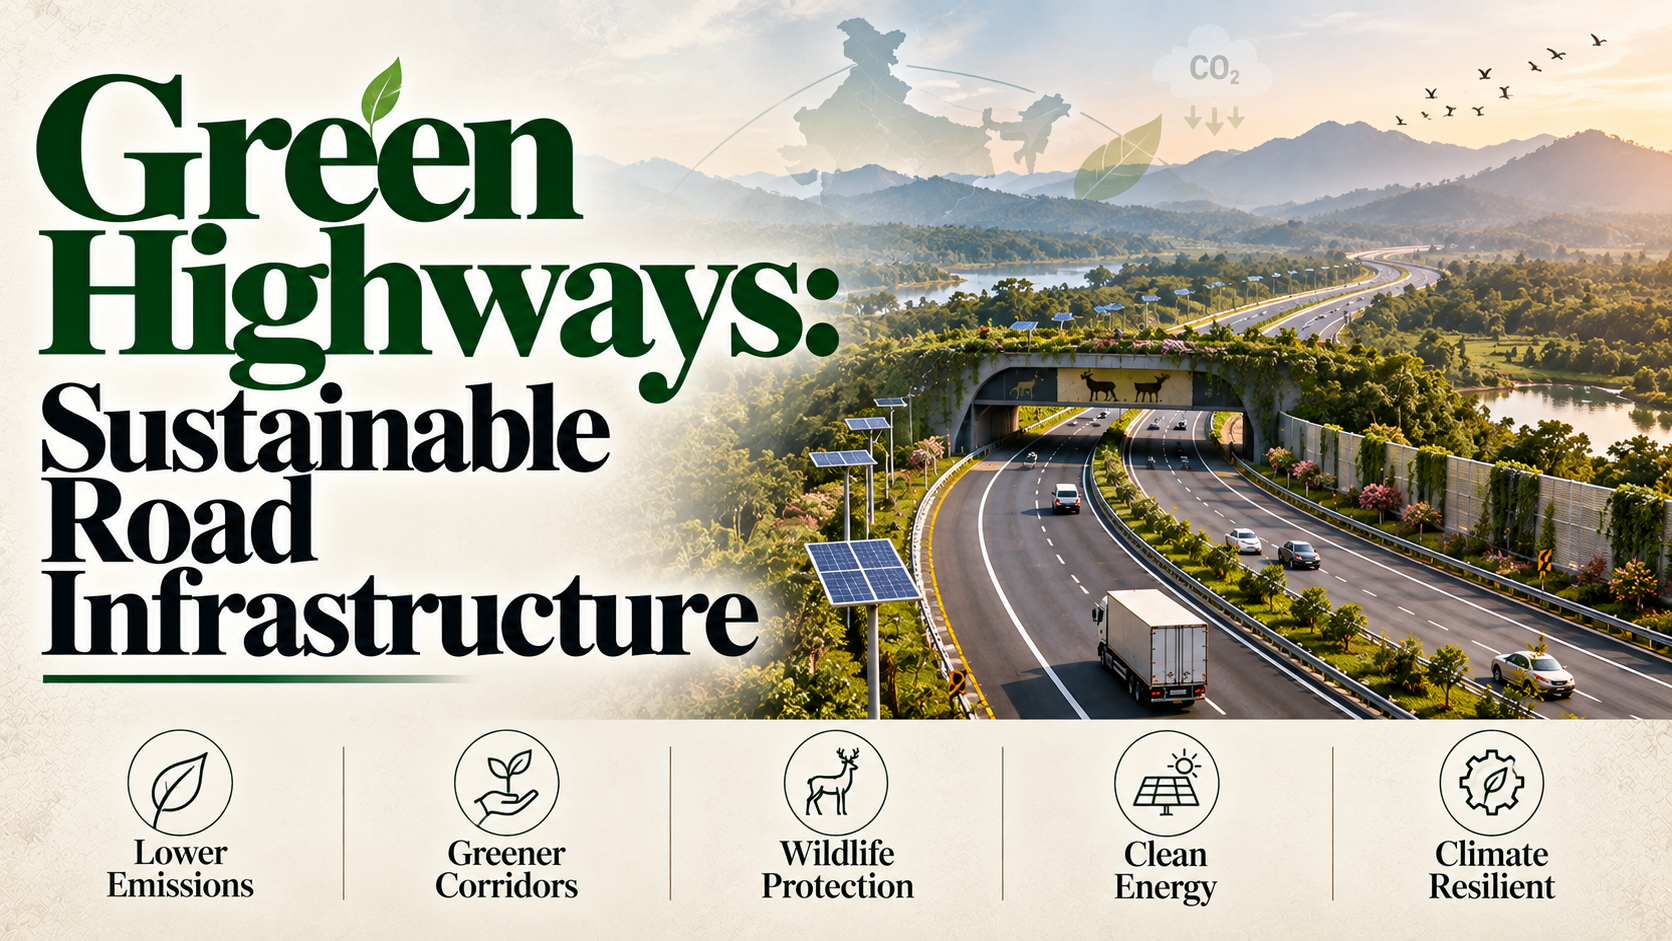
    Green Highways: Sustainable Road Infrastructure

    Why in the News?

    • India’s Green Highways approach is promoting sustainable road infrastructure through plantation, climate-resilient design and resource-efficient construction.
    • More than 3.61 crore saplings have been planted across approximately 1.32 lakh km of National Highways over the last five years.

    Key Highlights

    • National Highway network increased by nearly 61%:
      • 2014: 91,287 km
      • March 2026: 1,46,572 km
    • More than 3.61 crore saplings planted across approximately 1.32 lakh km of National Highways as of July 2026.
    • Green highway practices include:
      • Plantation and afforestation
      • Miyawaki plantations
      • Tree transplantation and compensatory afforestation
      • Recycled and waste-derived materials
      • Bio-bitumen
      • Drone and satellite-based monitoring

    Green Highways Policy, 2015

    • Official name: Green Highways (Plantation, Transplantation, Beautification and Maintenance) Policy, 2015.
    • Key objectives:
      • Framework for plantation along National Highways.
      • Reduce air pollution and dust.
      • Arrest soil erosion on embankment slopes.
      • Moderate wind and incoming radiation.
      • Generate employment for local communities.
    • Implementation involves Self Help Groups, private agencies, State Forest Departments, Forest Corporations and contractors.
    • A Plantation Cell monitors implementation through NHAI regional offices and other agencies.

    Miyawaki Plantation

    • Miyawaki technique creates dense forests in limited spaces.
    • Also known as the “pot plantation method”.
    • Trees and shrubs are planted close together to promote rapid growth.
    • Plants can grow up to 10 times faster under this method.
    • Useful particularly for expanding green cover in space-constrained urban areas.

    National Highways Green Cover Index

    • National Highways Green Cover Index (NH-GCI) 2025-26 is the first Annual Report on the index.
    • Prepared in collaboration with National Remote Sensing Centre (NRSC) of ISRO.
    • Provides the first scientific and quantitative assessment of green cover within the Right of Way (RoW) along National Highways.
    • Covers nearly 30,000 km of National Highways under the Operations and Maintenance (O&M) phase across 24 states.
    • Uses space-based technologies for monitoring.
    • Provides a baseline for comparison, ranking and targeted interventions.

    Sustainable Highway Materials

    • Bio-bitumen technology was transferred in January 2026.
    • Developed jointly by:
      • CSIR-Central Road Research Institute (CSIR-CRRI), New Delhi
      • CSIR-Indian Institute of Petroleum (CSIR-IIP), Dehradun
    • Uses post-harvest rice straw as feedstock.
    • Rice straw undergoes pyrolysis to produce bio-oil, which is blended with conventional bitumen.
    • A 100-metre trial stretch was laid on the Jorabat-Shillong Expressway (NH-40), Meghalaya.
    • India meets nearly 50% of its bitumen requirement through imports.
    • Other materials include fly ash, pond ash, Reclaimed Asphalt Pavement (RAP), Construction and Demolition (C&D) waste, recycled aggregates, plastic waste, slag and crumb rubber.

    Green Highway Compliance

    • NHAI’s September 2026 guidelines require:
      • At least 80% of available Right of Way (RoW) earmarked for plantation to be covered for provisional completion certification.
      • Minimum 90% survival rate of planted saplings at inspection.
      • The same 90% survival benchmark applies during the Operations and Maintenance period.
    • Green Highways Excellence Awards were instituted by NHAI in 2025.
    • The 2026 awards gave highest weightage to plantation survival.

    Prelims Quick Revision

    • Green Highways Policy launched in 2015.
    • National Highway network: 91,287 km in 2014 → 1,46,572 km in March 2026.
    • 3.61 crore+ saplings planted across approximately 1.32 lakh km of National Highways.
    • NH-GCI 2025-26 provides scientific assessment of highway green cover.
    • NH-GCI assessment covers nearly 30,000 km across 24 states.
    • NH-GCI prepared with NRSC, ISRO.
    • Bio-bitumen uses rice straw pyrolysis and has been trialled on NH-40 in Meghalaya.
    • NHAI plantation compliance requires 80% RoW coverage and 90% sapling survival.

    UPSC Prelims Trap

    • Green Highways Policy, 2015 is not limited to plantation; it also covers transplantation, beautification and maintenance.
    • NH-GCI measures green cover scientifically using space-based technologies; it is not simply a count of saplings planted.
    • Miyawaki plantation is associated with dense plantation in limited spaces, not conventional large-scale forest plantation.
    • Bio-bitumen in the article is produced using post-harvest rice straw through pyrolysis, not directly by mixing raw agricultural residue with conventional bitumen.
  • India’s First Port-based e-Methanol Production Facility

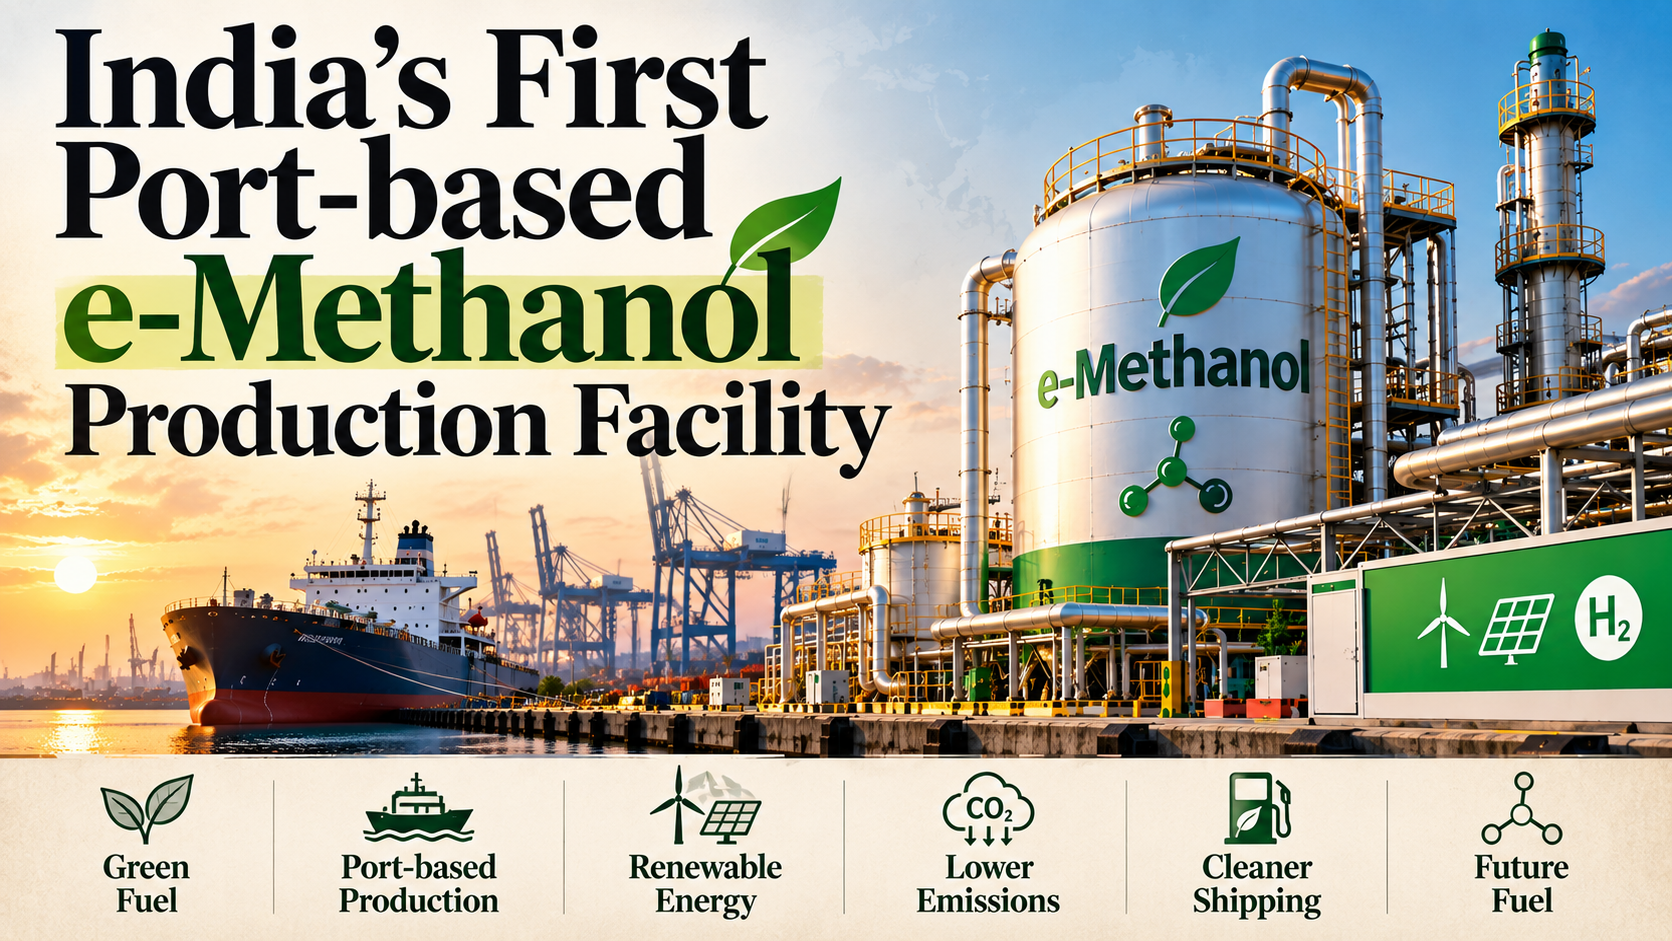
    India’s First Port-based e-Methanol Production Facility

    Why in the News?

    • Foundation stone laid on 26 September 2026 for India’s first port-based e-methanol plant at Deendayal Port Authority (DPA), Kandla, Gujarat.
    • The facility will produce green fuel for ships using renewable power, water and biogenic CO₂, supporting India’s Net Zero 2070 goal.

    Key Highlights

    • Location: Kandla, Gandhidham, Gujarat.
    • Capacity: 150 tonnes per day of e-methanol.
    • Total investment: ₹2,300 crore.
    • Phase I: 50 tonnes/day, ₹1,200 crore, targeted for January 2027.
    • Phase II: Additional 100 tonnes/day, ₹1,100 crore, targeted for March 2027.
    • Project partners: Deendayal Port Authority (DPA) and Assam Petro-Chemicals Ltd. (APCL).
    • Capital contribution: DPA:APCL = 76:24.
    • Expected to create more than 3,500 direct and indirect jobs.
    • Green methanol production cost stated as US$750/tonne, compared with global rate of US$1,300/tonne.
    • Fuel will be supplied to vessels operating on the Asia-Europe International Trade Corridor.
    • Supports Net Zero 2070, Atmanirbharta, Make in India and Make for the World.

    E-Methanol

    • E-methanol is a green fuel produced using:
      • Renewable power
      • Water
      • Biogenic CO₂
    • The project aims to use e-methanol as a cleaner marine fuel.
    • The facility will help develop a green energy value chain around Kandla, including:
      • Transportation
      • Storage
      • Fuel supply
      • Associated green molecule infrastructure

    Project Institutional Structure

    • Deendayal Port Authority (DPA):
      • Provides equity capital of ₹567.32 crore.
      • Provides 75 acres of land.
      • Provides desalinated water.
      • Provides renewable energy in the form of green hydrogen.
    • Assam Petro-Chemicals Ltd. (APCL):
      • Based in Namrup, Assam.
      • Joint partner in the Kandla e-methanol project.

    Maritime Sector Linkages

    • Government plans to add 100 new ships to India’s merchant fleet over the next 5 years.
    • Target: Make India one of the top five ship-owning nations by 2047.
    • DPA-Cochin Shipyard Limited (CSL) shipbuilding project at Vadinar:
      • Value: ₹1,520 crore.
    • Proposed greenfield shipbuilding and repair cluster at Kuchhadi, Porbandar has received in-principle approval.

    Prelims Quick Revision

    • First port-based e-methanol plant in India: Kandla, Gujarat.
    • Port: Deendayal Port Authority.
    • Capacity: 150 tonnes/day.
    • Investment: ₹2,300 crore.
    • Partners: DPA + Assam Petro-Chemicals Ltd.
    • Capital contribution ratio: 76:24.
    • Feedstocks/inputs: Renewable power, water and biogenic CO₂.
    • Primary application: Green fuel for ships operating on the Asia-Europe International Trade Corridor.

    UPSC Prelims Trap

    • E-methanol ≠ conventional methanol: The article specifically describes production using renewable power, water and biogenic CO₂.
    • Kandla ≠ Namrup: The production facility is at Kandla, Gujarat, while the partner Assam Petro-Chemicals Ltd. is based at Namrup, Assam.
    • 150 tonnes/day is the total capacity: Phase I contributes 50 tonnes/day, while Phase II adds 100 tonnes/day.
  • Farmers need a share of the solar boom

    Why in the News

    India’s solar capacity has grown sixtyfold since 2014 through utilities and rooftop households, but farmers are left out because Pradhan Mantri Kisan Urja Suraksha evam Utthaan Mahabhiyan (PM-KUSUM), the Ministry of New and Renewable Energy’s farmer scheme, has lagged. The Indian Council for Research on International Economic Relations (ICRIER) proposes agri-photovoltaics, so farmland yields food and power.

    What is PM-KUSUM Component A, and why has it lagged?

    1. What it is: Component A lets a farmer build a solar plant of up to 2 MW on his land and sell its power, like growing electricity as a crop.
    2. Why it was added: PM-KUSUM began with solar pumps; Component A added income from selling power.
    3. What went wrong: With no capital subsidy, a farmer must raise the full plant cost himself, so the scheme has not yet succeeded.
    4. The takeaway: Farmers hold the land solar needs but not the capital to use it, so the boom has passed them by.

    Who has gained from the solar boom so far?

    1. Global standing: India ranks third in solar, after China and the United States.
    2. Utility scale parks: About 74 percent of capacity sits in large parks on government provided wasteland, run by firms such as NTPC. Eg. Khavda Solar Park, Gujarat.
    3. Rooftop households: Rooftop solar holds about 20 percent, driven by Pradhan Mantri Surya Ghar: Muft Bijli Yojana, whose subsidies cover about 60 percent of a household system.
    4. Finance gap: Surya Ghar has a World Bank loan; PM-KUSUM has none.

    How would agri-photovoltaics bring farmers in?

    1. Agri-photovoltaics: Agri-PV mounts panels about 11 feet above the ground with spacing for crops underneath, so one field yields food and power.
    2. Subsidy and cheap credit: Component A needs a Surya Ghar style subsidy. Farmers and farmer producer companies (FPCs) should get Priority Sector Lending, the cheaper credit banks must give agriculture.
    3. Feed-in tariff: This is the fixed price a distribution company (discom) pays per unit fed into the grid. A tariff of Rs 4.5 per kWh makes projects viable.
    4. Solar cooperatives: The World Bank financed Operation Flood, the dairy cooperative drive, and should back solar cooperatives too. This “PM Surya Khet Kranti” makes solar the “third crop“.

    Why would it pay, and what is the trade-off with food?

    1. Food versus energy: Ground mounted solar on farmland displaces food crops, so the writers want it banned.
    2. Three objectives: Agri-PV under Component A serves three objectives:
      • Farm income: rises eight to ten times, as an ICRIER pilot in Rajasthan showed through power sales and shade tolerant horticulture;
      • Power subsidy bill: falls, because farm power costs about Rs 8.5 per kWh to supply, the Comptroller and Auditor General (CAG) estimates, but farmers pay about Rs 1;
      • Rural industrialisation: clean energy helps rural areas industrialise.
    3. No new spending: A feed-in tariff near half the supply cost can come from the existing farm power subsidy.

    Challenges

    1. Scale of farm demand: Agriculture uses nearly 260,000 GWh a year, priced far below cost, so agri-PV must scale widely to matter.
    2. Discom payment delays: Loss making discoms pay generators late, so power sales are unreliable income.
    3. Rising demand needs storage: Artificial intelligence (AI) data centres consume heavy power, so new solar must come with storage.

    Way Forward

    1. Aggregate through FPCs: Route agri-PV plants through FPCs and cooperatives so small holdings pool land and credit.
    2. Differentiated tariff: State regulators should notify a separate agri-PV feed-in tariff.
    3. Storage in design: Plan agri-PV with battery or pumped hydro storage beyond lithium-ion.

    Conclusion

    India can scale solar, but farmers, who hold most of the land, own almost none of it. Whether Component A gets Surya Ghar style support and a paying tariff will decide if solar also raises rural incomes.

    Key numbers

    1. Solar capacity: 2.82 GW (2014) to 168.04 GW (August 2026); Khavda Solar Park 30 GW.
    2. Surya Ghar: Rs 78,000 central subsidy for 3 kW, plus Rs 30,000 in Uttar Pradesh, against Rs 1.8 lakh cost; 1 crore households; outlay Rs 75,021 crore; World Bank loan $820 million.
    3. ICRIER pilot: 600 kW; income about Rs 40,000 to nearly Rs 4 lakh per acre; Rs 1.4 crore State Bank of India loan, Rs 60 lakh farmer share, Rs 35 lakh Kotak corporate social responsibility funds.
    4. Tariff subsidy bill: Rs 2.35 lakh crore a year; agriculture may bear 85 percent.

    Government initiatives for solar energy

    1. Production Linked Incentive (PLI) scheme: Rewards domestic manufacture of solar cells and modules.
    2. Green Energy Corridors: Transmission lines carrying large solar and wind output into the grid.
    3. Battery storage viability gap funding: Part funds battery storage to steady renewable supply.

    Matching Previous Year Question

    “[2026] Which of the following statements with regard to Green Hydrogen is/are correct? 1. It is decarbonized hydrogen obtained from natural gas reforming combined with carbon capture and storage (CCS). 2. It is produced using electrolysis of water with electricity generated by renewable energy. 3. National Green Hydrogen Mission of India aims for abatement of nearly 50 MMT of annual greenhouse gas emissions by 2030. (a) 1 only (b) 2 and 3 only (c) 2 only (d) 1, 2 and 3 Answer: B”

  • Centre directs captive coal plants to run at full capacity from October 1

    Why in the News

    The Centre has directed about 112 captive coal based power plants to run at maximum available capacity from 1 October to 31 December. It invoked Section 11 of the Electricity Act, 2003, an emergency power, because September peak demand came close to the year’s summer peak. Plants built to supply their own factories are now a reserve for the public grid.

    What is a captive power plant, and why direct one to run?

    1. What it is: A captive power plant is a station a factory builds to power its own operations rather than to sell electricity, like a building running on its own generator.
    2. Why factories build them: Captive generation is exempt from the cross subsidy surcharge, an extra charge grid consumers pay that funds cheaper supply to other categories, so self supply costs less.
    3. What the emergency power does: Section 11 of the Electricity Act, 2003 lets the government order a station to operate as it directs in extraordinary circumstances, overriding the owner’s commercial choice.
    4. The takeaway: An emergency provision is pulling privately owned capacity into the public market, because the grid has no other reserve it can order into service quickly.

    What does the direction require?

    1. Who is covered: Every coal based captive plant of 50 megawatt and above must generate to the maximum extent of its available capacity.
    2. Surplus to the market: After meeting its own factory demand, a generator must offer the surplus on the power exchanges, where electricity is traded for the next day or the next hour.
    3. Fuel stock: Generators must hold adequate coal stock so fuel availability does not limit generation.
    4. Weekly reporting: Generators must report weekly to the Central Electricity Authority, the government’s technical adviser on power planning, on generation, captive use, exchange sales and coal stock.

    Why was it invoked in September?

    1. Out of season demand: Electricity demand rose unusually this September and approached peak summer levels, so capacity kept for May was needed out of season.
    2. A September record: Peak demand touched 269 gigawatt, the highest ever recorded in that month and almost equal to the year’s May peak.
    3. Not a first invocation: The provision has been used in earlier years during peak summer months.

    What does the Coastal Gujarat Power extension add?

    1. A second invocation: The power ministry extended the same mechanism to Coastal Gujarat Power Ltd, Tata Power’s imported coal based station, until 31 December, continuing an arrangement running since March.
    2. Why it had shut: The 4 gigawatt station sat idle for nearly six months, because imported fuel costs were high and no viable power purchase arrangement existed.
    3. A revised contract reopened it: The Gujarat government approved a revised power purchase arrangement earlier this year, clearing the way for long term supply to resume.
    4. Why only this plant: The recorded ground is that other imported coal based plants were operating without difficulty.

    Challenges

    1. An exception used as policy: Section 11 is written for extraordinary circumstances, and repeated seasonal use turns a statutory exception into a planning instrument with no fixed review.
    2. Captive generators carry the risk: An industrial user ordered to run flat out buys more coal and sells the surplus at exchange prices it does not set.
    3. Coal logistics, not capacity, binds: Maximum generation depends on coal rakes, the trainloads that carry fuel to a plant, actually arriving, which a direction cannot create.
    4. The shortfall is a few hours long: Demand peaks in the evening, so ordering stations built to run steadily all day adds energy the grid does not need.

    Way Forward

    1. Contract the reserve instead of ordering it: The Ministry of Power should buy captive surplus as a paid seasonal reserve, so capacity is available without an emergency provision.
    2. Pay for standing by: Widen the ancillary services market, which pays a generator to stay on standby for the grid operator, so flexible capacity earns for being available.
    3. Build for the evening peak: Tie battery storage and pumped hydro tenders to evening peak hours, since that is where the shortfall sits.
    4. Stock before the season: The coal ministry and the railways should fix rake plans and plant stock targets before each demand season.

    Conclusion

    The grid no longer has a single summer peak, and the Centre is meeting the new one by ordering private industrial capacity into the public market. What to watch is whether that reserve is contracted in advance or ordered again under an emergency power.

    Matching Previous Year Question

    “[2026, GS3, 15 marks] Explain the key challenges for India’s energy security. What measures do you suggest for ensuring energy security along with economic growth and sustainability?”

  • Centre notifies Kandla, JNPA, Mundra and Paradip as mega ports

    Why in the News

    The Ministry of Ports, Shipping and Waterways has notified four ports as mega ports under the Indian Ports Act, 2025, three of them major ports and one privately operated. This is the first use of the Act’s power to grade ports by size rather than by ownership. It places a privately run port in the same statutory class as ports the Union administers.

    What is a mega port under the Indian Ports Act, 2025?

    1. What it is: A mega port is a port the Centre puts in its highest class once it meets published scale criteria. It works like a size based star rating.
    2. Why the Act provides for it: The Indian Ports Act, 2025 replaced the colonial era Indian Ports Act, 1908 and made a port’s class follow notified criteria rather than practice.
    3. What the criteria say: The criteria were notified on 30 July 2026 after consulting State governments. The notification records only that all four ports meet them.
    4. The takeaway: Size now decides which ports the Centre treats as nationally significant, so being a major port is no longer what puts a port in the top tier.

    What exactly has been notified?

    1. The major ports in the set: Deendayal (Kandla), Jawaharlal Nehru (Nhava Sheva) and Paradip are major ports, administered under the Major Port Authorities Act, 2021.
    2. Two routes, one notification: The three major ports were notified under Section 73(2), and Mundra under Section 73(3), the route for a port that is not a major port.
    3. Who runs the fourth: Mundra is operated by Adani Ports and Special Economic Zone, a private company, not by a Union port authority.
    4. When it takes effect: The notification was issued on 25 September 2026 and came into force when it was published in the Gazette of India.

    Why does one private port in the class matter?

    1. Two constitutional lists: Major ports fall under Entry 27 of the Union List and every other port under Entry 31 of the Concurrent List, so the two answer to different governments.
    2. A State regulator for a mega port: Ports other than major ports in Gujarat are regulated by the Gujarat Maritime Board, so the Centre has graded a port it does not administer.
    3. Scale of the private port: Mundra is the country’s largest privately operated port by cargo handled, which is why a class defined by size could not exclude it.

    Challenges

    1. One class, two regulators: A mega port in State jurisdiction is still licensed and charged tariffs by a State maritime board, so the new label changes no regulator.
    2. Rail and road capacity binds: A port can unload more cargo than the rail lines and roads behind it carry away, so a higher class does not move cargo faster.
    3. Concentration of traffic: Grading by size rewards ports that already dominate traffic, widening the gap with smaller ports competing for the same cargo.

    Way Forward

    1. Publish the score against each criterion: The Ministry of Ports, Shipping and Waterways should publish how each port scored on every notified criterion, so the class is auditable.
    2. A common protocol with State boards: Agree one clearance and reporting protocol with State maritime boards for mega ports outside Union jurisdiction.
    3. Tie the label to connectivity targets: Link mega port status to dated rail and road milestones under the Sagarmala programme, so grading pulls connectivity investment.
    4. Fix a review cycle: Provide that a port failing the criteria on review loses the classification.

    Conclusion

    Port classification has moved from who owns a port to how much it handles, and the first list crosses the Union and State line. What to watch is what the class entitles a port to, and whether State maritime boards get a formal place in that decision.

    Back2Basics: Major Port Authorities Act, 2021

    1. What it replaced: The Act replaced the Major Port Trusts Act, 1963 and converted port trusts into Port Authority Boards.
    2. What it covers: It governs the major ports the Union administers, not ports in State jurisdiction.
    3. Tariffs: Each Board fixes its own scale of rates instead of following a central tariff authority.
    4. Composition: Each Board has independent members alongside State and central ministry representatives.

    Matching Previous Year Question

    “[2023] Consider the following pairs : Port / Well Known as 1. Kamarajar Port : First major port in India registered as a company 2. Mundra Port : Largest privately owned port in India 3. Visakhapatnam Port : Largest container port in India How many of the above pairs are correctly matched? (a) Only one pair (b) Only two pairs (c) All three pairs (d) None of the pairs Answer: (b)”

  • India’s vast canal network offers a land-free path to solar power

    Why in the News

    The Centre has approved the PM Surya Sarovar Yojana (PM-SSY). The scheme aims at developing 5,000 MW of floating solar capacity on reservoirs and other inland water bodies across the country. The approval follows a steady rise in the cost and difficulty of acquiring land for large-scale solar projects. India’s canal network, one of the largest in the world, carries a second land-neutral option in canal-top photovoltaics (CTPV), meaning solar panels mounted on elevated structures built over canal stretches. A 2024 assessment placed India’s combined canal-top and canal-bank potential at around 131 GW. Deployment has stayed limited for more than a decade after the first installation, so the binding constraint on canal-top solar is system cost and structural design rather than resource availability.

    What is canal-top photovoltaics?

    1. Structures built over the canal: CTPV mounts solar panels on specialised structures erected over canal stretches. The canal itself becomes the site, so no separate plot is acquired.
    2. Difference from floating solar: A floating system places panels on floating platforms on a water body. CTPV instead uses elevated structures standing above the canal.
    3. Design set by canal geometry: A system is built to the canal’s width, design and orientation. The elevated structure may span the canal or sit along the canal banks.
    4. Unobstructed water flow: Every design must leave the canal’s water flow unobstructed.

    What does covering a canal deliver beyond electricity?

    1. Land neutrality: CTPV requires virtually no additional land. Eg. In Punjab, the installation of 20 MW of canal-top systems is estimated to have saved nearly 100 acres of land.
    2. Reduced evaporation loss: Panels covering a canal stretch cut the amount of water lost to evaporation. The gain matters most in India’s water-stressed regions.
    3. Cooling effect on panel output: The water beneath the panels cools them. Panel performance in hot weather improves as a result.
    4. Measured dual output: A 1 MW system over the Narmada Canal at Mehsana in Gujarat saves close to 9 million litres of water every year. It generates 1.6 million units of electricity annually.

    How far has deployment actually gone in India?

    1. Early adoption: India’s first canal-top installation was commissioned at Mehsana in Gujarat in 2012. The country was an early adopter of the technology.
    2. Gujarat and Punjab capacity: Two 10 MW systems were commissioned in Vadodara, Gujarat, between 2014 and 2017. Punjab commissioned 20 MW of canal-top systems between 2017 and 2018.
    3. Punjab’s current pipeline: The Punjab Energy Development Agency invited expressions of interest in September 2025 for 40 MW of canal-top projects. The State’s canal network spans over 10,000 km.
    4. Haryana’s exploration: Haryana has initiated efforts to explore canal-top systems over six of its irrigation canals.
    5. A niche after a decade: CTPV remains largely a niche application, and deployment has stayed limited for more than a decade after the first installation.

    What does the assessed potential show about where canal-top solar can scale?

    1. Assessed potential: A 2024 assessment estimated India’s canal-top and canal-bank potential at around 131 GW.
    2. Scope of the estimate: The estimate covers canals up to 30 m wide. It assumes vertical bifacial installations for canals over 30 m wide.
    3. Screening criteria: Solar irradiation, canal characteristics, distance from substations and protected areas were applied to identify the best-suited canal stretches across India.
    4. Leading States: Uttar Pradesh, Bihar, Karnataka, Andhra Pradesh and Punjab carry the highest potential.

    Why has a decade of policy support not converted pilots into scale?

    1. The 2014 pilot scheme: The Ministry of New and Renewable Energy (MNRE) launched a pilot-cum-demonstration scheme for grid-connected canal-top and canal-bank projects in 2014. It set a target of 50 MW each for canal-top and canal-bank projects.
    2. Financial assistance offered: The scheme offered Rs 3 crore per MW for canal-top systems and Rs 1.5 crore per MW for canal-bank systems. The assistance was capped at 30% of project cost, whichever was lower.
    3. Limits of financial assistance: The 2014 scheme shows that financial support by itself does not convert pilots into large-scale deployment.
    4. Floating solar as the new policy signal: PM-SSY is expected to revitalise the floating solar segment and drive its adoption across India. That policy interest in land-neutral solar can extend to canal-top systems.

    Challenges to canal-top photovoltaics

    1. High system cost: Elevated structures spanning a canal need additional structural steel, foundations and access provisions, so canal-top systems cost more than ground-mounted ones. Eg. High system cost is the primary bottleneck behind a deployment record of a few tens of megawatts since 2012.
      The Fix: Route early projects through viability gap funding and low-cost debt, so developers build experience and cost falls through scale and standardisation.
    2. Structural design against canal operations: The structures must avoid disrupting canal operations and must withstand winds. Eg. A design spanning an irrigation canal has to clear the water flow and carry maintenance access at the same time.
      The Fix: Issue standardised specifications and guidelines for canal-top structures, so each developer does not engineer the same span from scratch.
    3. Maintenance on a working canal: Cleaning panels, replacement and repair are difficult on structures elevated above a canal that is in use. Eg. The two 10 MW systems at Vadodara sit over live irrigation canals.
      The Fix: Build operations and maintenance access into the design standard rather than leaving it to each project’s own layout.
    4. Linear layout and evacuation distance: A canal-top system runs along the canal’s course, so irregular paths and changes of direction raise the cost of electricity where substations or transformers are not close. Eg. Punjab’s canal network runs over 10,000 km across the State.
      The Fix: Select and prioritise canal stretches on land scarcity, nearby electricity demand, grid connectivity and canal geometry before capacity is tendered.
    5. Institutional coordination: A canal-top project sits across a State nodal agency and an irrigation department, each with its own approval process. Eg. Haryana’s exploration covers six irrigation canals under its irrigation administration.
      The Fix: Attach capacity building of State nodal agencies and irrigation departments, plus streamlined process flows, to any renewed canal-top scheme.

    Conclusion

    Land-neutral solar has moved from demonstration to a funded national scheme in the floating segment, and canal-top solar sits one step behind it. The obstacle is not the size of the resource or the absence of a subsidy, both of which have been established for years. It is the cost of building over a working canal and the absence of a standard way of doing it. The measure to watch is whether any renewed canal-top support carries standardised specifications and State agency capacity building alongside the money, since money on its own has already been tried once.

    Matching Previous Year Question

    “[2015, GS3, 12.5 marks] To what factors can be the recent dramatic fall in equipment cost and tariff of solar energy be attributed? What implications does the trend have for thermal power producers and related industry?”

  • Decoding the transition to alternative fuels

    Why in the News

    August 2026 recorded a historic fuel crossover in India’s passenger vehicle market. Data from the Federation of Automobile Dealers Associations (FADA), the apex body of vehicle dealers that compiles retail registration data, showed that the share of new vehicles in the alternative fuels category reached 41.95 per cent against petrol’s 40.85 per cent, the first time the former has overtaken the latter. The crossover follows a steady five year decline in the fossil fuel share of all registrations. The tension inside the number is that the alternative fuels category combines compressed natural gas, hybrid and electric vehicles, and in the car segment the shift has gone mainly to gas rather than to electricity.

    What counts as an alternative fuel in this data?

    1. FADA’s definition: The alternative fuels category combines compressed natural gas (CNG), hybrid and electric vehicles into a single share.
    2. Two of the three are still fossil fuels: CNG and liquefied petroleum gas (LPG) are fossil fuels, and their advantage over petrol and diesel is significantly lower emissions rather than zero emissions.
    3. Hybrids straddle the categories: A hybrid car runs on petrol combined with CNG or LNG, so a rise in its share moves a vehicle out of the petrol column without removing it from fossil fuel use.

    How far has the overall fuel mix actually shifted?

    1. Fossil fuels still dominate: Petrol and diesel accounted for 83.5 per cent of the roughly 82 lakh vehicles registered from January to March 2026.
    2. The five year fall: That is a drop of 11.5 percentage points from the same period in 2021, when petrol and diesel accounted for over 95 per cent of the 57 lakh vehicles then registered.
    3. Electric vehicles overall: Electric vehicles accounted for 10.6 per cent of total registrations.
    4. What the aggregate conceals: A granular reading of the sub categories shows that the headline electric share is driven by particular segments rather than by a uniform shift.

    Which segments are driving electric adoption?

    1. Two wheelers carry the volume: The two wheeler segment accounts for over 70 per cent of all new vehicles registered in the country, so its mix moves the national figure.
    2. A step change in two wheelers: The electric share in two wheelers jumped from 6.4 per cent in 2025 to 9.1 per cent in 2026 up to August, after only marginal year on year increases before that.
    3. A first for petrol two wheelers: This is the first time the share of two wheelers running on petrol has come down to the 90 per cent mark, and that fall pulled the all category petrol and diesel share well below 85 per cent this year.
    4. Three wheelers have already transitioned: Of the roughly 9.8 lakh three wheelers registered till August 2026, 60.5 per cent were electric, and the petrol and diesel share in the segment halved from nearly 30 per cent in 2021 to under 15 per cent in 2026.
    5. Gas is receding there too: The share of three wheelers using CNG or LPG has also come down this year, and the segment accounts for only 4 per cent of all vehicles sold.

    Why are cars the laggard in this transition?

    1. Cars are the second largest segment: Cars account for the second biggest share of vehicles after two wheelers, so the car mix decides how much the headline crossover means.
    2. The headline fall is real: The share of petrol and diesel cars dropped from 86 per cent in 2021 to 61.6 per cent in 2026.
    3. Gas, not electricity, replaced them: That decline is accounted for mainly by hybrid cars running on petrol with CNG or LNG rather than by electric cars.
    4. Hybrid share has plateaued: The share of hybrid electric vehicles has stayed fairly constant since 2023 at around eight per cent.
    5. Electric growth is slow here: Sale of electric cars is progressing, and it is much slower than the growth in vehicles using CNG or LPG.

    Challenges to electric vehicle adoption in India

    1. Charging density decides car buying: A car buyer without home charging or a reliable public network defaults to a fuel that can be refilled in minutes, which is why CNG is winning the switch. Eg. India’s public charging network remains concentrated in a handful of metropolitan corridors while CNG retail outlets are far more widely distributed.
      The Fix: Mandate charging provision in new building codes and tie highway charger density targets to national highway concession agreements.
    2. Battery inputs are imported: Cell manufacture depends on lithium, cobalt, nickel and graphite that India does not produce at scale, so the cost base sits outside the country. Eg. The lithium block identified at Reasi in Jammu and Kashmir has been put to auction and is far from production.
      The Fix: Run the National Critical Mineral Mission alongside overseas asset acquisition and mandatory battery recycling targets, so recovered material offsets imported feedstock.
    3. The emissions gain depends on the grid: An electric vehicle charged on a coal heavy grid shifts emissions from the tailpipe to the power plant rather than removing them. Eg. Coal remains the largest source of electricity generation in India by a wide margin.
      The Fix: Pair electric vehicle incentives with time of day tariffs that push charging into hours of high renewable generation.
    4. Resale value and financing are unresolved: Uncertainty about battery life depresses the second hand price of an electric car, and lenders price that uncertainty into the loan. Eg. Battery replacement cost can approach a large share of an older electric car’s residual value.
      The Fix: Mandate a standardised battery state of health certificate at resale, so the residual value rests on a measured figure rather than on a guess.
    5. Demand tracks the subsidy window: Electric two wheeler sales have moved with the opening and tapering of central purchase incentives rather than with underlying preference. Eg. Electric two wheeler volumes fell sharply after the subsidy rate under the second phase of the Faster Adoption and Manufacturing of Electric Vehicles scheme was reduced in 2023.
      The Fix: Shift support from purchase subsidies to permanent structural levers such as differential road tax, registration fee waivers and scrappage linked credits.

    Conclusion

    The crossover is real, and its composition is the substantive finding. India is moving off petrol and diesel fastest in the segments where the vehicle is cheap, the daily range is short and the duty cycle is predictable, which is why three wheelers are past 60 per cent electric and cars are not. For cars the transition so far is a substitution within the fossil fuel family rather than an electrification. The measure to watch is the electric share of car registrations, which will move only once charging infrastructure is dense enough to remove the range calculation from the purchase decision.

    Back2Basics: Vahan portal

    1. What it is: Vahan is the national vehicle registration database of the Ministry of Road Transport and Highways, developed with the National Informatics Centre.
    2. Coverage: It consolidates registration records filed by Regional Transport Offices across States and Union Territories onto a single platform.
    3. Why it is used as data: Its public dashboard reports registrations by fuel type, vehicle category and State, which makes it the standard source for fuel mix analysis.
    4. Its limit: It records registrations rather than sales, so unregistered vehicles and jurisdictions outside its coverage fall outside the count.

    Matching Previous Year Question

    “[2025] Consider the following types of vehicles: I. Full battery electric vehicles II. Hydrogen fuel cell vehicles III. Fuel cell electric hybrid vehicles How many of the above are considered as alternative (powertrain) vehicles? (a) Only one (b) Only two (c) All the three (d) None Answer: (c)”

  • New high-speed corridors to get one-metre high wall to prevent cattle menace

    Why in the News

    The National Highways Authority of India (NHAI) has issued its first standardised design and safety guidelines for access controlled high speed National Highways. They prescribe a one metre high wall along the outer edge of such corridors to prevent unauthorised access and the entry of stray cattle, and they bar openings in median walls. The guidelines arrive while the NHAI is asking the Supreme Court to modify a direction of November last year on stray animals, having told the Chief Justice of India that herding cattle off highways is not its responsibility and that compliance would cost around Rs 27,000 crore. The tension is that the authority is being asked to solve by construction a problem it says belongs to local authorities, and it is doing so only on corridors not yet built.

    What are the NHAI’s high speed corridor guidelines?

    1. Nature of the document: This is the first time the NHAI has prescribed standardised technical and safety provisions for high speed corridors, so design that was previously project specific is now uniform.
    2. Scope of application: The guidelines apply to all upcoming four to six lane greenfield and brownfield access controlled National Highways. A greenfield corridor is built on a new alignment, a brownfield one upgrades an existing road.
    3. The existing stock: The length of operational access controlled high speed corridors currently stands at 3,052 km, which the guidelines do not reach.

    What physical measures do the guidelines prescribe?

    1. Boundary wall: A one metre high wall runs along the outer edge of the corridor, stated as a measure against unauthorised access and the entry of stray cattle.
    2. Median openings barred: Openings in median walls on access controlled highways are prohibited, which removes the informal crossing points that produce head on collisions.
    3. Collapsible barriers: Collapsible barriers at a distance of 5 km are permitted so emergency and maintenance vehicles can cross where an opening is not available.
    4. Jersey barriers as an alternative: Modular concrete or plastic walls used to separate lanes of traffic and prevent head on crashes, known as jersey barriers, are allowed in place of a solid median wall.
    5. Structures get a stronger median: At bridges, tunnels and overpasses the guidelines require a median wall topped with metal crash barriers.

    Why is stray cattle a design problem rather than an enforcement one?

    1. The authority’s stated position: The NHAI has told the Chief Justice of India that it cannot herd stray cattle and animals off public thoroughfares or find them shelter homes, and that the responsibility lies with the respective local authorities.
    2. The cost of the alternative: The NHAI has put compliance with the court’s direction at around Rs 27,000 crore, which is the figure that makes a boundary wall on new corridors cheaper than a national removal and sheltering operation.
    3. The procedural move: The law officer for the NHAI has requested the Chief Justice to constitute a Bench so the authority can seek modification of the court’s direction of November last year.
    4. The Railways precedent: The Railways has fenced stretches against the same problem, including metal barrier fencing along the 623 km Mumbai Ahmedabad train route, which is the working model for treating animal intrusion as an exclusion engineering task.

    Challenges to the high speed corridor safety guidelines

    1. The existing network is untouched: The guidelines apply only to upcoming corridors, so the operational network keeps its current design. Eg. Stray cattle collisions occur on the 3,052 km of already built access controlled stretches, which the wall requirement does not reach.
      The Fix: Fix a retrofit schedule with annual targets for boundary walling the operational access controlled network, funded from the toll revenue of those same stretches.
    2. A wall displaces animal movement rather than ending it: Sealing a corridor severs the routes livestock and wildlife use to cross, which pushes the crossing to the nearest gap. Eg. Linear infrastructure across the Kanha Pench corridor required dedicated animal underpasses because fencing alone concentrated crossings.
      The Fix: Make an animal passage plan, with underpasses or overpasses at surveyed crossing points, a mandatory annexure to every corridor’s design approval.
    3. Jurisdiction over stray cattle remains unsettled: The duty is said to lie with local authorities, and those authorities have neither the shelter capacity nor a dedicated funding line for it. Eg. Municipal cattle pounds in most Indian cities hold a small fraction of the stray population in their jurisdiction.
      The Fix: Fix a single statutory owner for stray animal management on and around National Highways, with a dedicated head in the highway project cost rather than in municipal budgets.
    4. Barred median openings raise emergency response times: Removing crossings means a responder on the wrong carriageway must travel to the nearest collapsible barrier. Eg. The guidelines set those barriers 5 km apart.
      The Fix: Require a mapped and numbered barrier registry shared with State emergency services and ambulance dispatch systems, so the nearest crossing is known at the time of the call.
    5. Encroachment follows the wall rather than stopping at it: A boundary wall becomes the new edge against which informal settlement, parking and vending accumulate. Eg. Service road encroachment along existing National Highway stretches has repeatedly narrowed the usable carriageway.
      The Fix: Attach a demarcated and surveyed right of way strip outside the wall, with clearance responsibility written into the concession agreement of the corridor operator.
    6. Design standards without an audit do not become practice: A guideline binds only where a body checks that the built corridor matches it. Eg. Road safety audit provisions exist in Indian highway practice but are inconsistently applied at the construction stage.
      The Fix: Make an independent road safety audit sign off a precondition for the completion certificate and for the start of tolling on every new corridor.

    Conclusion

    The NHAI has answered a court direction about stray animals by writing a construction standard rather than by accepting an enforcement duty. The standard binds only corridors that do not yet exist, and the authority’s jurisdictional objection over the operational network remains live. The marker to watch is the Bench the NHAI has asked the Chief Justice to constitute, since its ruling decides whether the removal and sheltering obligation stands or is modified.

    Back2Basics: National Highways Authority of India

    1. Statutory basis: The NHAI was constituted under the National Highways Authority of India Act, 1988, and became operational in 1995.
    2. Administrative control: It functions under the Ministry of Road Transport and Highways.
    3. Mandate: It is responsible for the development, maintenance and management of National Highways entrusted to it.
    4. Delivery role: It is the implementing agency for the Centre’s large highway programmes, including Bharatmala Pariyojana.

    Matching Previous Year Question

    “[2014, GS3, 12.5 marks] National Urban Transport Policy emphasises on ‘moving people’ instead of ‘moving vehicles. Discuss critically the success of the various strategies of the Government in this regard.”

  • NPCIL begins fuel loading at RAPP-8, unit nears operation

    Why in the News

    The Nuclear Power Corporation of India Limited (NPCIL) has begun initial fuel loading (IFL) at Unit 8 of the Rajasthan Atomic Power Project (RAPP) at Rawatbhata, the step that starts the commissioning of a 700 megawatt electric (MWe) indigenous pressurised heavy water reactor (PHWR). The loading followed permission from the Atomic Energy Regulatory Board (AERB), granted after safety evaluations, major system integrity audits and site readiness reviews. Unit 8 is the fourth reactor in the series of sixteen indigenous 700 MWe PHWRs being built in the country, after Units 3 and 4 at the Kakrapar Atomic Power Station (KAPS) and RAPP Unit 7. The unit is expected to enter commercial operation during the current financial year, which would place four units of the standardised design in operation and move the series from individual project execution towards fleet mode deployment.

    What is a pressurised heavy water reactor (PHWR)?

    1. The design: A PHWR uses heavy water as both moderator and coolant, with the coolant kept under pressure so that it carries heat to the steam generators without boiling.
    2. The fuel it accepts: Heavy water absorbs far fewer neutrons than ordinary water, which allows the reactor to run on natural uranium rather than on enriched uranium.
    3. Why that matters for India: Running on natural uranium removes dependence on enrichment capacity, which is the reason the design was chosen as the mainstay of the domestic programme.
    4. The Indian series: Indian PHWRs progressed from 220 MWe units to 540 MWe units and then to the 700 MWe design now being built in series.

    What does initial fuel loading commit the unit to?

    1. The regulatory gate: Fuel loading could begin only after the Atomic Energy Regulatory Board granted permission and the prescribed prerequisites were completed, so the step certifies that the unit passed its pre operational safety review.
    2. What the review covered: The permission followed rigorous safety evaluations, major system integrity audits and site readiness reviews conducted as part of the regulatory process.
    3. The timeline it starts: The process from initial fuel loading to commercial operation typically takes about six to eight months, and loading commenced on 19 September.
    4. The next milestone: The unit must next reach First Approach to Criticality (FAC), which marks the start of a controlled fission chain reaction, before power generation can begin.

    Where does Unit 8 sit in the 700 MWe series?

    1. Its position: RAPP Unit 8 is the fourth reactor in the series of sixteen indigenous 700 MWe PHWRs planned in the country.
    2. The units already operating: Units 3 and 4 at the Kakrapar Atomic Power Station in Gujarat entered commercial operation in 2023 to 2024, and RAPP Unit 7 followed in April 2025.
    3. What the fourth unit establishes: Each completed unit strengthens the standardisation of the 700 MWe design, which is the precondition for building the remaining units to a repeated template.
    4. Why standardisation is the objective: Fleet mode deployment means building several units to one settled design, so engineering, licensing and procurement are done once rather than project by project.

    What else is moving at the site and across the programme?

    1. The next two units at Rawatbhata: Geotechnical investigations for Units 9 and 10 at the RAPP site commenced on the same day as the fuel loading, which is the foundational step in project development.
    2. The construction pipeline: Apart from RAPP Unit 8, eight other reactors are under construction, two each at Gorakhpur in Haryana and Kaiga in Karnataka and four at Kudankulam in Tamil Nadu.
    3. The two technology streams: The Kudankulam units are light water reactors built with Russian collaboration, while the Gorakhpur and Kaiga units are indigenous 700 MWe PHWRs, so the pipeline advances both streams in parallel.

    Challenges to the 700 MWe PHWR fleet programme

    1. Domestic uranium is low grade: The fuel requirement rises with every unit commissioned, and Indian ore carries a far lower uranium content than the deposits mined elsewhere. Eg. The Jaduguda belt in Jharkhand works ore of well under one percent uranium oxide, against several percent in Canadian and Australian deposits.
      The Fix: Tie each new unit’s sanction to a matching fuel supply commitment, combining domestic mine expansion with long term import contracts before first concrete is poured.
    2. The supplier liability regime deters vendors: The right of recourse against equipment suppliers has kept private and foreign vendors cautious about entering the nuclear supply chain. Eg. Section 17(b) of the Civil Liability for Nuclear Damage Act, 2010 allows the operator to recover from a supplier where the accident results from defective equipment or substandard services.
      The Fix: Issue binding contractual guidance capping supplier recourse by value and by period, so a vendor can price the risk rather than avoid it.
    3. Heavy component manufacture is a narrow bottleneck: Calandria vessels, end shields and steam generators for the 700 MWe design are fabricated by a small set of qualified domestic vendors, so fleet mode depends on a supply base that fleet mode itself has not yet widened. Eg. Large forgings and reactor internals for Indian PHWRs come from a handful of heavy engineering suppliers.
      The Fix: Qualify additional fabricators against the standardised 700 MWe drawings in advance of the order, so capacity exists before the schedule needs it.
    4. Spent fuel and waste management stays unresolved at scale: Each additional unit adds spent fuel to storage, and the reprocessing and disposal capacity has to grow with the fleet rather than after it. Eg. Spent fuel from Indian PHWRs is stored at station pools pending reprocessing under the closed fuel cycle.
      The Fix: Sanction reprocessing and away from reactor storage capacity on the same schedule as the reactor units it will serve.
    5. Grid absorption limits the value of new base load: A 700 MWe unit delivers steady output into grids that are increasingly balancing variable solar generation, so the benefit depends on transmission and scheduling rather than on generation alone. Eg. High solar generation in the middle of the day has already compressed the space for inflexible base load in several state grids.
      The Fix: Plan evacuation and flexible scheduling arrangements for each unit at the sanction stage rather than at the commissioning stage.

    Conclusion

    Fuel loading at RAPP Unit 8 moves the indigenous 700 MWe programme from three operating units to four, and the significance is in the repetition rather than in the capacity added. A design built four times to the same specification is what allows the remaining twelve units of the series to be executed as a fleet rather than as separate projects. The near milestone to watch is First Approach to Criticality at Unit 8, followed by commercial operation within the current financial year, with geotechnical work at Units 9 and 10 marking where the same site goes next.

    Back2Basics: Atomic Energy Regulatory Board (AERB)

    1. What it is: The AERB is the national regulatory authority for nuclear and radiation safety in India.
    2. Its legal basis: It was constituted in 1983 under Section 27 of the Atomic Energy Act, 1962, which allows the Central Government to delegate its regulatory powers to a designated authority.
    3. What it does: It frames safety codes and standards, issues consents at each stage of a nuclear facility’s life from siting through construction and commissioning to decommissioning, and enforces compliance through inspection.
    4. Its structural limitation: It reports to the Atomic Energy Commission rather than to Parliament through independent statute, which is the basis of the standing criticism that its independence from the operator it regulates is administrative rather than legal.

    Matching Previous Year Question

    “Give an account of the growth and development of nuclear science and technology in India. What is the advantage of fast breeder reactor programme in India?”

  • Ethanol vision needs a feedstock reality check

    Why in the News

    The price of sugar has risen as part of the normal cycle in sugar output, at a point when ethanol production is being pushed to reduce crude oil imports. Sugarcane is one of the three feedstocks for ethanol, and the price rise has opened the broader question of whether the blending target will put pressure on crop supplies generally. About 45% of India’s ethanol now comes from maize and a further 20% to 25% from rice, with the balance produced from sugar based feedstock. E20, the blending of 20% ethanol into petrol, has been made mandatory, which fixes the demand rather than leaving it to the relative price of the feedstock. The tension is that the cheapest and highest yielding feedstock is also the base of India’s cattle and poultry feed, and its output cannot be raised quickly because genetically modified seed is not permitted for maize.

    What is the E20 ethanol blending mandate?

    1. About: E20 is petrol blended with 20% ethanol by volume, supplied under the Ethanol Blended Petrol Programme run by the Ministry of Petroleum and Natural Gas.
    2. Why it exists: Blending substitutes a domestically produced fuel for imported crude, which reduces both the oil import bill and the foreign exchange spent on it.
    3. How the ethanol is bought: Oil marketing companies procure ethanol from distilleries at administered prices fixed separately for each feedstock route, so the mix responds to policy pricing rather than to the fuel market.
    4. The target date: The 20% blending target was advanced to the 2025 to 2026 ethanol supply year from the original timeline of 2030.

    What decides India’s ethanol feedstock mix?

    1. Current shares: Around 45% of ethanol is produced from maize and 20% to 25% from rice, with sugar based feedstock supplying the balance.
    2. Yield per tonne: One tonne of maize yields 380 to 400 litres of ethanol, one tonne of rice yields 370 to 385 litres, and one tonne of sugarcane yields 220 to 280 litres.
    3. Cost per tonne: Maize costs around Rs 20,000 to Rs 21,000 per tonne, rice around Rs 38,000 to Rs 39,000, and sugar approximately Rs 37,000, which places maize first on cost as well as on yield.
    4. Availability: Availability also favours maize, so producers prefer it on all three counts and it stands highest in the pecking order.
    5. The rice supply was a one time disposal: Excess stocks held by the Food Corporation of India (FCI), the central agency that procures and stores foodgrain, were of low quality and were sold into the market, which was sound as a disposal but cannot be the feedstock strategy going forward.

    Who else is competing for India’s maize?

    1. Households: Household consumption accounts for a small part of total maize demand.
    2. Cattle and poultry feed: Maize supports cattle and poultry and accounts for 60% of the total feed requirement.
    3. Industrial starch: Industrial use draws maize for the production of starch.
    4. Ethanol as the fourth claim: Ethanol now becomes a fourth source of demand on the same domestic output.

    Why can maize output not simply be expanded?

    1. The seed restriction: Production using genetically modified variety seeds is not permitted for maize, so output growth has to come from existing domestic seeds.
    2. Demand is fixed by notification: A mandatory E20 blend raises ethanol demand on a schedule the crop cycle cannot respond to.
    3. Price pass through: Higher demand raises maize prices, and that increase trickles through to the prices of dairy, meat and related products.
    4. The proposal on the table: One solution is to permit genetically modified seed for maize grown solely for ethanol production, which separates the fuel use from the food and feed chain.

    What does the water accounting show?

    1. Water per kilogram: Maize takes 500 to 900 litres of water per kg, sugarcane takes 1,500 to 2,500 litres and rice takes 2,000 to 3,500 litres.
    2. The implication for the mix: On water use alone, more maize and less rice and sugarcane should be diverted to ethanol.
    3. Incremental output still costs water: Additional maize output adds to the pressure on water resources even though maize is the least water intensive of the three.
    4. A competing claim on the same supply: The parallel push to build data centres adds another heavy consumer of both power and water, which makes water supply a general constraint on the economy rather than an ethanol specific one.

    Challenges to the ethanol blending programme

    1. The blend reduces vehicle efficiency: Ethanol carries lower energy density than petrol, so a higher blend delivers fewer kilometres from the same volume of fuel. Eg. Efficiency losses of roughly 2% to 6% have been reported for vehicles not calibrated for a 20% blend.
      The Fix: Mandate a published efficiency rating for every vehicle model at the E20 blend, so the import saving and the mileage cost are visible together.
    2. Capacity is being built against a single target year: Grain based distillery capacity added on the strength of a mandatory blend has no alternative market if the target is later revised. Eg. Grain based routes displaced sugarcane as the dominant ethanol feedstock within a few supply years.
      The Fix: Publish a rolling five year feedstock and capacity plan so investment tracks a stated trajectory rather than one target year.
    3. The older fleet is not compatible: Vehicles built before blend compatible components were standardised face corrosion in fuel lines and seals at higher ethanol shares. Eg. Vehicles manufactured before 2023 were not designed to be E20 compliant.
      The Fix: Require retail outlets to stock a lower blend grade alongside E20 until the pre compliance fleet retires.
    4. Food and fuel draw on the same procurement system: The agency that holds foodgrain for the public distribution system also supplies grain to distilleries, so a poor crop year forces a choice between the ration and the blend. Eg. Rice released for ethanol has been drawn from central stocks built for food security.
      The Fix: Fix a statutory buffer floor below which no grain may be released for ethanol, published before each supply year.

    Conclusion

    The ethanol programme is being run as an energy policy while its binding constraint sits in agriculture. Neither of the two things that would let maize output grow, approval of genetically modified seed and additional water, lies within the remit of the ministry that sets the blending target, and a mandate creates neither. What is unresolved is that a fuel target fixed by notification meets a crop supply that responds only to seed technology and rainfall, and the adjustment between the two will appear first in feed and dairy prices rather than at the pump.

    Government Initiatives for Biofuels in India

    1. National Policy on Biofuels, 2018: The policy classifies biofuels into first, second and third generation categories and widens the permitted feedstock base to include damaged foodgrain and surplus grain.
    2. Ethanol Interest Subvention Scheme: The Centre supports new and expanded distilleries through soft loans carrying a 6% interest subvention on the borrowing.
    3. Pradhan Mantri JI-VAN Yojana: It funds commercial scale second generation ethanol plants that use crop residue instead of food grain as feedstock.
    4. Sustainable Alternative Towards Affordable Transportation (SATAT): This initiative of the Ministry of Petroleum and Natural Gas promotes Compressed Bio Gas produced from agricultural and municipal waste for use as a transport fuel.

    Matching Previous Year Question

    “Consider the following statements: Statement I: Of the two major ethanol producers in the world, i.e., Brazil and the United States of America, the former produces more ethanol than the latter. Statement II: Unlike in the United States of America, where corn is the principal feedstock for ethanol production, sugarcane is the principal feedstock for ethanol production in Brazil. Which one of the following is correct in respect of the above statements? (a) Both Statement I and Statement II are correct and Statement II explains Statement I (b) Both Statement I and Statement II are correct but Statement II does not explain Statement I (c) Statement I is correct but Statement II is not correct (d) Statement I is not correct but Statement II is correct”