Mains Ready By December. Smash Mains & Smash PYQ Admissions Open

GS Paper: GS3-18.Conservation, Environmental Pollution and Degradation, Environmental Impact Assessment.

  • Lucknow air cleanest, Indore’s second best among cities with million-plus people

    Why in the News

    Lucknow has been ranked first among million plus population cities in Swachh Vayu Sarvekshan 2026, the annual air quality ranking run under the National Clean Air Programme (NCAP). Indore was placed second and Jabalpur third in the same category of 47 cities. The rankings were declared in Delhi and the awards were distributed by the chairperson of the National Green Tribunal (NGT). Municipal wards that improved their air quality were honoured for the first time this year. The tension sits in the scoring itself: improvement in particulate matter (PM) 10 concentrations carries a weight of only 2.5%, so a city can top the ranking while its air remains above the national standard.

    What is Swachh Vayu Sarvekshan?

    1. What it ranks: It is an annual assessment of cities under the National Clean Air Programme, scoring the actions a municipal body has taken to improve air quality rather than the air quality it has achieved.
    2. How cities are grouped: Cities and towns are placed in three population based categories, those with a million plus population, those between 3 lakh and 10 lakh, and those below 3 lakh, so a small town is not ranked against a metropolis.
    3. What is scored: The parameters cover waste management, road dust control, dust from construction and demolition waste, reduction in vehicular pollution and reduction in industrial pollution. Reduction in PM 10 concentrations carries a weight of 2.5%.
    4. What the winners receive: The top three in each category receive cash prizes and mementos, ranging from Rs 1.50 crore for the first place in the million plus category down to Rs 12.5 lakh for the third place in the smallest category.

    Which cities topped the ranking, and which trailed it?

    1. Million plus population category: Lucknow first with Rs 1.50 crore, Indore second with Rs 1 crore, and Jabalpur third with Rs 50 lakh.
    2. Cities of 3 lakh to 10 lakh: Rourkela first with Rs 75 lakh, Firozabad and Guntur sharing second place with Rs 50 lakh, and Amravati third with Rs 25 lakh.
    3. Cities below 3 lakh: Kalinga Nagar first with Rs 37.5 lakh, Angul second with Rs 25 lakh, and Talcher third with Rs 12.5 lakh.
    4. The bottom of the largest category: Chennai, Jamshedpur, Kota, Kolkata and Madurai were placed in the bottom five of the 47 million plus cities.
    5. The two largest cities: Delhi ranked 30th and Mumbai 37th in the same category.

    What did the top ranked cities actually do?

    1. Lucknow’s interventions: The city deployed electric vehicles in its waste collection fleet, used mechanised sweepers to manage road dust, and cleared legacy waste dumps.
    2. Jabalpur’s interventions: The city ran a waste to energy plant, achieved full collection of waste with scientific disposal, mechanised street sweeping and promoted electric vehicles.
    3. The common thread is municipal solid waste and dust: Both winning profiles are built on services a municipal body directly controls, and neither turns on industrial or vehicular emission sources.
    4. Indore’s standing: Indore, ranked India’s cleanest city for seven years until 2025, converted that solid waste management capacity into second place on air quality.

    Challenges to the Swachh Vayu Sarvekshan ranking

    1. Effort is scored, outcomes are not: With actual PM 10 reduction weighted at 2.5%, the survey ranks the interventions a city reports rather than the air its residents breathe. Eg. Lucknow topped the category while its annual PM 10 concentration stood at 137 micrograms per cubic metre against the national standard of 60.
      The Fix: Raise the weight on measured concentration decline and make the award conditional on continuous ambient monitoring data rather than on activity reports.
    2. The measured pollutant is the coarser one: The survey and the programme centre on PM 10, while PM 2.5 is the fraction that penetrates deep into the lungs and drives the health burden. Eg. Road dust suppression lowers PM 10 sharply without touching combustion sources that generate PM 2.5.
      The Fix: Score PM 2.5 concentration decline as a separate parameter with its own weight, so combustion sources cannot be scored around.
    3. A city boundary is not an airshed: Pollution crosses municipal limits, so a city’s ranking reflects sources it does not control alongside those it does. Eg. Delhi’s winter concentrations rise with stubble burning in neighbouring States and with emissions from thermal plants outside the city.
      The Fix: Move the assessment unit to the airshed, ranking a cluster of local bodies jointly and funding them against a common source apportionment study.
    4. Self reported action invites inflation: Cities score themselves on activities such as sweeping frequency and dust suppression that no independent agency verifies. Eg. Mechanised sweeper deployment is recorded as procurement rather than as operating hours on the road.
      The Fix: Require third party verification of a random sample of claimed interventions before the cash award is released.
    5. Baselines flatter the already polluted: A city that started from a very high concentration records a large percentage decline while remaining far above the standard. Eg. Lucknow’s PM 10 fell 45.2% from 250 micrograms per cubic metre in 2017-18, and is still more than twice the standard.
      The Fix: Score cities against the absolute standard as well as against their own baseline, so meeting the norm rather than improving on a bad start is what wins.

    Conclusion

    A ranking that scores what a municipal body did, and barely scores what happened to the air, will reward administrative activity long before it rewards clean air. The gap is visible in this year’s own result, where the winning city remains far outside the national standard. What to watch is whether the weight given to measured concentration is raised in the next survey, and whether the ward level awards introduced this year are backed by ward level monitoring data.

    Back2Basics: National Clean Air Programme

    1. What it is: A national framework launched in January 2019 by the Union Ministry of Environment, Forest and Climate Change to cut particulate pollution in cities that fail the national ambient air quality standards.
    2. Which cities it covers: It covers non attainment cities, meaning cities that did not meet the standards over a five year period, along with million plus cities, taking in 131 urban areas.
    3. The target: The original goal of a 20% to 30% reduction in particulate concentrations by 2024 against a 2017 baseline was revised to a 40% reduction by 2025-26.
    4. How it is funded: Million plus cities receive air quality grants routed through the Fifteenth Finance Commission, while the remaining cities are funded through the programme’s own allocation.

    “[2022, GS3, 10 marks] Discuss in detail the photochemical smog emphasizing its formation, effects and mitigation. Explain the 1999 Gothenburg Protocol.”
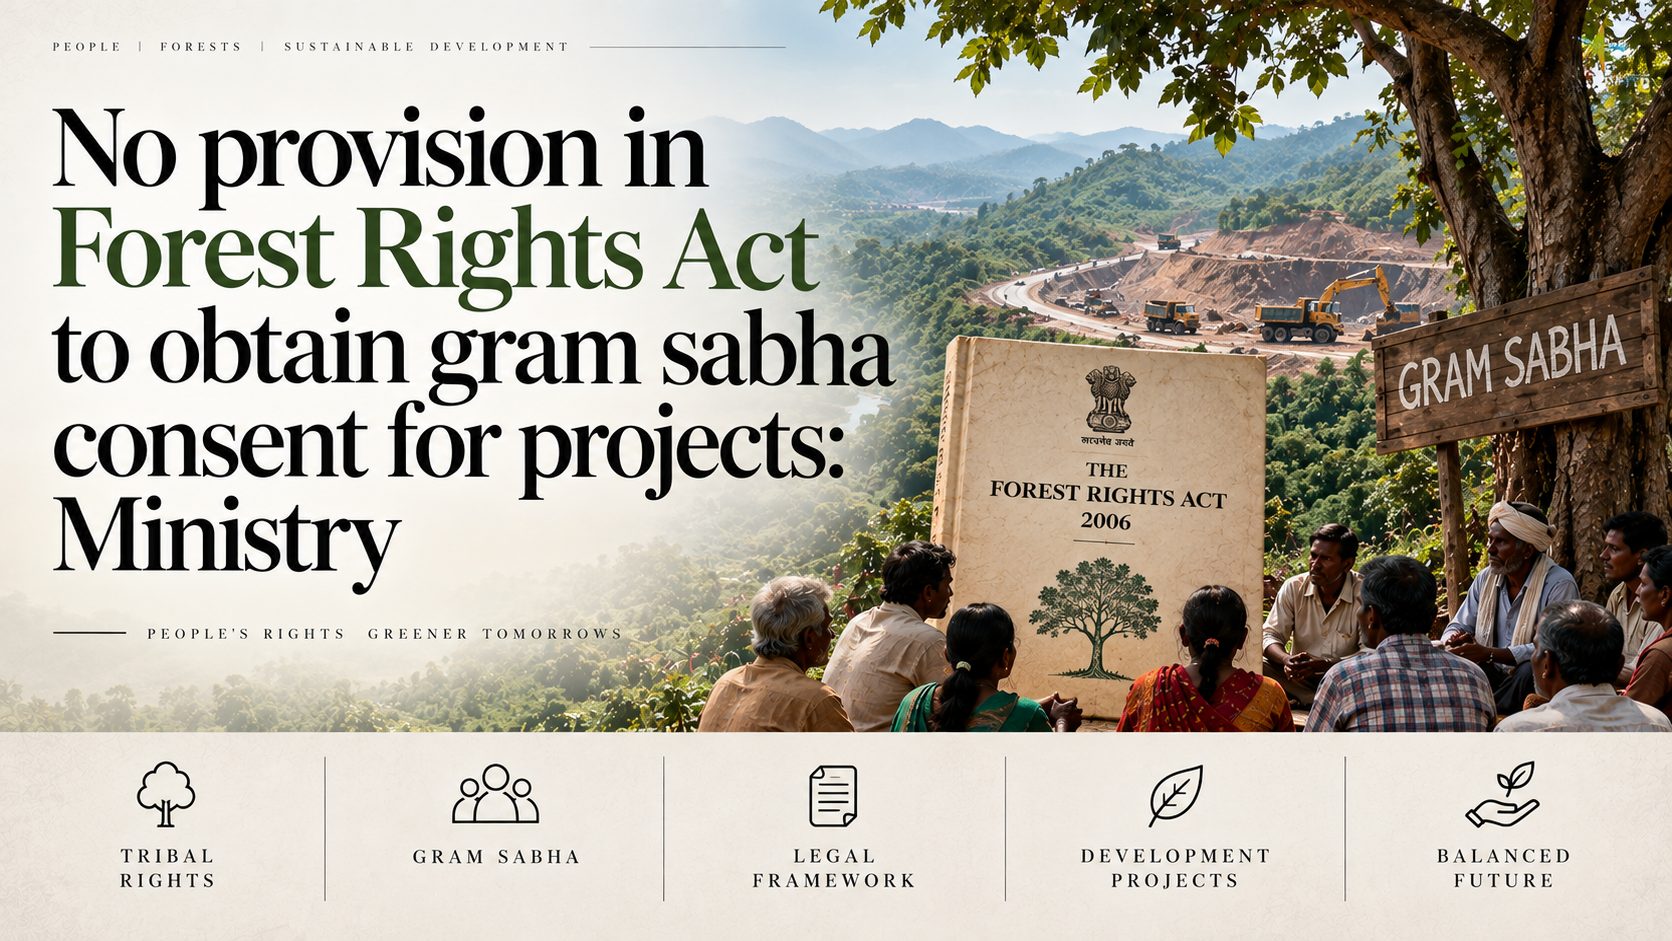
  • No provision in Forest Rights Act to obtain gram sabha consent for projects: Ministry

    No provision in Forest Rights Act to obtain gram sabha consent for projects: Ministry

    Why in the News

    The Union Ministry of Tribal Affairs has told the Union Ministry of Power that the Scheduled Tribes and Other Traditional Forest Dwellers (Recognition of Forest Rights) Act, 2006 carries no provision for obtaining gram sabha consent for Stage-II forest clearance. It added that such matters do not fall within its purview.

    How does gram sabha consent for forest clearance actually work?

    1. The requirement sits in the diversion rules, not in the Act: The Forest Rights Act, 2006 carries no language on gram sabha consent for diverting forest land to non-forest purposes. The Union government’s rules under the Forest (Conservation) Act, 1980 require that all processes under the Forest Rights Act be completed before a diversion certificate is issued.
    2. Step one, identify and recognise: The guidelines require potential claimants under the Forest Rights Act to be identified, and their rights to be recognised where they apply.
    3. Step two, vest the rights: Recognised rights are then vested in the holders before the diversion proposal can move.
    4. Step three, obtain the no-objection certificate: The concerned gram sabhas then issue a no-objection certificate on the proposal to divert that forest land for the stated purpose. This certificate is what is commonly called gram sabha consent for forest clearance.

    What is the Ministry of Tribal Affairs’ stated position?

    1. The communication is dated and specific: The Ministry stated on 31 August that there is no provision for obtaining gram sabha consent for Stage-II forest clearance in the Forest Rights Act, 2006 or the rules made under it.
    2. It disclaims jurisdiction: It concluded that such matters therefore do not fall under its purview.
    3. The Act says otherwise on responsibility: The Forest Rights Act explicitly names the Ministry of Tribal Affairs as the nodal ministry responsible for the law’s implementation.
    4. The disclaimer has a record behind it: The Ministry has previously claimed no role in the Nicobar mega-infrastructure project and in Forest Rights Act implementation cases in Madhya Pradesh, Karnataka and other States, arguing that the Act assigns implementation to State and Union Territory governments.

    Why is that position contested?

    1. The requirement is not free-standing: The no-objection certificate is demanded because the diversion rules make completion of the Forest Rights Act processes a precondition. A ministry that owns the Act’s implementation cannot disown the precondition built on it.
    2. No alternative authority exists: The position leaves no ministry able to settle a disputed consent, which is the objection recorded by a Supreme Court advocate who formerly advised the Ministry of Tribal Affairs under both governments.
    3. The timing sharpens the gap: The disclaimer was issued while a parliamentary committee proposal to lower the consent standard is live and awaiting inter-ministerial examination.

    What did the parliamentary committee propose, and why?

    1. The report is dated: The Parliamentary Standing Committee on Public Undertakings reported on NHPC Limited on 3 August, and the Power Ministry’s deliberations with the Tribal Affairs Ministry followed from it.
    2. The delay figure: Based on discussions with NHPC officials, the committee recorded an average forest clearance time of 106 months for under-construction projects.
    3. The bottleneck it identified: It found the requirement that all concerned gram sabhas consent to be the single most critical bottleneck.
    4. The stalled project named: The Teesta-IV hydroelectric project is indefinitely stalled because consent from a small minority of gram panchayats remains pending.
    5. The proposed dilution: The committee endorsed NHPC’s recommendation for a qualified super-majority, meaning consent from 70 to 75 per cent of affected gram sabhas, for large hydropower projects of national importance. It asked the Power Ministry to examine the feasibility of that proposal with the Ministry of Tribal Affairs.

    Challenges to gram sabha consent under the Forest Rights Act

    1. Consent can be recorded without a real assembly: Resolutions are produced without quorum or without convening the habitation actually affected. Eg. Villagers of Hariharpur, Salhi and Fatehpur alleged forged gram sabha consent for the Parsa coal block in the Hasdeo Aranya forests of Chhattisgarh.
      The Fix: Require a video record and a habitation-wise attendance roll for every consent resolution, uploaded before the diversion certificate is issued.
    2. Rights recognition lags, so the assembly may hold no title: Community forest resource rights remain unrecognised across most eligible villages, which weakens the standing of the body being asked to consent. Eg. Recognition of community forest resource rights has advanced in Maharashtra and Odisha and stalled across most other States.
      The Fix: Complete community forest resource recognition across the affected district before a diversion proposal is admitted for consideration.
    3. The rules have already moved consent later in the sequence: Consent now arrives after a project has an in-principle approval, which reduces it to a formality. Eg. The Van (Sanrakshan Evam Samvardhan) Rules, 2022 removed the gram sabha consent step from the stage preceding in-principle approval.
      The Fix: Restore the consent step ahead of in-principle approval, so no project is sanctioned before the affected assembly has been heard.
    4. Compliance is certified by the authority pushing the project: The State administration both promotes the project and certifies that the statutory process was followed. Eg. The environment ministry accepts the State’s compliance certificate at the final clearance stage without independent verification.
      The Fix: Route the compliance certificate through the State tribal welfare department, accompanied by a published list of recognised claimants.

    Conclusion

    Two positions now stand directly against each other. The statute names one ministry as responsible for its implementation, and that ministry says the consent question is not its business. Nothing in the system supplies an alternative authority to settle a contested consent, so a disputed resolution has no forum. That gap matters most now, because a proposal to lower the consent standard is live and no ministry has claimed the authority to rule on it.

    [2021] At the national level, which ministry is the nodal agency to ensure effective implementation of the Scheduled Tribes and Other Traditional Forest Dwellers (Recognition of Forest Rights) Act, 2006?

    (a) Ministry of Environment, Forest and Climate Change

    (b) Ministry of Panchayati Raj

    (c) Ministry of Rural Development

    (d) Ministry of Tribal Affairs”

  • Fear revisits residents of Western Ghats

    Why in the News

    The Centre has issued its seventh draft notification proposing to declare 56,825.7 sq km of the Western Ghats an Ecologically Sensitive Area (ESA). Of that, 29,668 sq km spread across 1,449 villages in ten Karnataka districts falls in the State. Hundreds of farmers in the Malnad region have marched against the draft, and their central demand is not that the notification be dropped. They want the Karnataka government to conduct a physical survey of the land and to exclude human settlements and cultivated areas from the proposed ESA boundary. The tension is that the people most opposed to the notification already live under forest restrictions that deny them roads, schools, electricity and clear title, and they read the ESA as freezing those unsettled claims permanently.

    What is an Ecologically Sensitive Area?

    1. The legal basis: An ESA is an area notified under the Environment (Protection) Act, 1986, within which specified activities are prohibited, restricted or made subject to closer scrutiny.
    2. How it is created: The Centre issues a draft notification proposing the boundary and the restrictions, and allows a fixed period for objections before a final notification can issue. The seventh draft allows 60 days.
    3. What it is not: An ESA is a land use regime layered over existing ownership, so it does not by itself transfer land or extinguish a title.

    How did the Western Ghats ESA proposal originate?

    1. A march, not a ministry: On 1 November 1987 two groups of scientists, ecologists, environmentalists and activists began walking simultaneously from Navapur in Maharashtra’s Dhule district and from Kanyakumari in Tamil Nadu towards a common meeting point in Goa, documenting the ecological condition of the landscape along the route.
    2. The Goa conference: The effort culminated in a conference in Goa in February 1988, where the ecologist Madhav Gadgil of the Indian Institute of Science, Bengaluru chaired the technical session on the region’s ecological status.
    3. The demand for an expert panel: The group stayed active through a 1998 yatra and meetings in 2009 and on 18 February 2010 at the Keystone Foundation in Kotagiri, Nilgiris, where the then Union Minister for Environment and Forests was asked to constitute an expert panel on the Western Ghats.
    4. The panel: On 4 March 2010 the Ministry of Environment and Forests set up the Western Ghats Ecology Expert Panel (WGEEP) under Gadgil, with nine non-government and five official members, to assess the ecological status of the Ghats, demarcate areas to be notified as ecologically sensitive, and recommend conservation measures through wide consultation.

    What did the WGEEP recommend, and how was its report handled?

    1. A people-oriented model: The report went beyond regulation to propose science-based incentives, including financial rewards for individual farmers and payments for ecosystem services to communities. It cited the Australian Soil Carbon Accreditation Scheme, under which farmers were paid retrospectively for verified increases in soil carbon on regeneratively managed farmland.
    2. The restrictions it proposed: These included a complete ban on mining and sand extraction with existing operations phased out within five years or on expiry of lease, restrictions on housing and construction projects exceeding 20,000 sq m, a ban on all “red category” highly polluting industries with existing units to close or relocate within five years, encouragement of organic farming, and closer scrutiny of other development activities.
    3. The report was withheld for months: The panel submitted its final report on 31 August 2011. The Ministry resisted disclosure through repeated applications under the Right to Information Act, 2005 and an order of the Central Information Commission, and approached the Delhi High Court seeking a stay, before uploading the report on its website on 23 May 2012.
    4. Every State government objected: All the States concerned, including Karnataka and Kerala, opposed the recommendations, and elected representatives particularly in Kerala argued they would severely disrupt local livelihoods.

    What did the Kasturirangan High-Level Working Group change?

    1. Why it was constituted: Taking the criticism of the WGEEP report into account, the Union Ministry set up a High-Level Working Group (HLWG) under K. Kasturirangan to prepare a “workable and implementable” report on conserving the Western Ghats.
    2. What it recommended: The panel visited several places, including Sakleshpur in Hassan district, and submitted its report on 15 April 2013. It recommended that about 37 per cent of the Western Ghats, 59,940 sq km forming a continuous band of natural vegetation stretching roughly 1,500 km across six States, be declared an ESA. Karnataka accounted for the largest share, around 20,668 sq km.
    3. The objection from the earlier panel: Gadgil objected strongly in an open letter, stating that the WGEEP had proposed a graded, participatory approach with a major role for grassroots input.
    4. What the letter said the HLWG did instead: It had effectively partitioned the landscape, with roughly a third to be protected by “funds and guards” as natural landscape and the remaining two-thirds labelled cultural landscape and left open to development.

    What does the seventh draft propose for Karnataka?

    1. Seven drafts, none finalised: The Ministry has issued seven draft notifications since 2014. All six earlier drafts were opposed by the States concerned, and residents of the affected regions filed numerous objections against them.
    2. The Karnataka share: The 29,668 sq km proposed in the State is spread across 1,449 villages in Belagavi, Chamarajanagar, Chikkamagaluru, Dakshina Kannada, Hassan, Kodagu, Mysuru, Shivamogga, Udupi and Uttara Kannada districts.
    3. The instrument has not changed: The draft still rests on the boundary the HLWG proposed, which is why the objection filed against it is the same objection filed against the six drafts before it.

    What are the Malnad protests demanding?

    1. The march: On 29 August hundreds of farmers from Hosanagara taluk in Shivamogga district marched about nine kilometres from the Ganesha temple in Karanagiri to Hosanagara town, and farmers across Shivamogga and neighbouring Malnad districts are planning similar protests.
    2. The demand has narrowed: The central demand is a physical survey of the land by the State government and the exclusion of human settlements and cultivated areas from the proposed boundary.
    3. The Kerala model they cite: Kerala reduced its proposed ESA area from 13,108 sq km to 9,937 sq km, comprising 9,107 sq km of forest and 886.7 sq km of non-forest land, after conducting a physical survey. That reduction of more than 3,000 sq km has since been incorporated into the revised notification.
    4. The organising vehicle: A large section of farmers has been brought together under the banner of the Western Ghats Raitha Sahakari Vedike, which has launched a website with a tool to help the public file objections online.
    5. The shift in position: The organisation is not opposing the notification outright this time, and is instead demanding that the State government follow the Kerala model to minimise the impact.

    How has the Karnataka political establishment responded?

    1. The stated concerns: The Member of Parliament from Shivamogga, who joined the protest marches, said restrictions on township projects and the push for organic farming were the primary concerns in the Malnad region.
    2. The plantation economy’s objection: Many farmers in Shivamogga, Uttara Kannada, Chikkamagaluru and Kodagu who grow plantation crops such as coffee and areca use chemical fertilizers to protect their crops from disease, and ask how plantations are to be protected if such inputs are restricted. Restrictions on house construction are the second stated objection.
    3. A legislative airing: The Karnataka Cabinet announced on 3 September 2026 a three-day special session of the legislature from 21 September to discuss drought, which will also take up a detailed discussion on the Kasturirangan report. The Chief Minister agreed to convene it after leaders across parties urged a physical survey, and the decision was welcomed across party lines.
    4. The State’s declared position: The Minister for School Education, who is also in charge of Shivamogga district, has said the State government will oppose the draft notification. A former Minister and Congress leader burnt a copy of the Kasturirangan report at a press conference in Tirthahalli.

    Why is the fear about existing forest rules rather than the ESA?

    1. A displaced village still without power: Uralagallu in Sagar taluk of Shivamogga district houses families displaced by the Linganamakki dam across the Sharavathi river in the 1960s. The village has roughly 50 to 56 families and a population of 150 to 200, with no proper road, school or primary health centre, its nearest bus stop about 10 km away, and no ambulance visit in recent years. It still has no electricity, because the Forest Department has repeatedly denied clearance for road and power-supply works.
    2. Children leave the village to study: A majority of parents there send their children to hostels or to relatives’ homes early. One resident’s two children stay about 50 km away at Mavinagundi, and villagers walk 10 km to Kanuru to catch a bus.
    3. Roads are blocked in conflict-prone stretches: At Byrapura in N.R. Pura taluk of Chikkamagaluru district, schoolchildren recently encountered a leopard on their way home, and stayed away from school for several days. Parents say a proper road would allow safer transport, and forest regulations continue to block it.
    4. Even the local government has no title: In Karimane village of Hosanagara taluk, large parts of the settlement including the gram panchayat building stand on forest land, leaving the panchayat office without an official khata, or title, and the community in administrative limbo.
    5. Unsettled claims are the real anxiety: Bagair hukum, or unauthorised, cultivators and people displaced by dam projects are yet to receive the compensatory land promised to them under existing rules, and they fear that an ESA in force would leave those claims unresolved indefinitely.

    What is the case for the notification?

    1. The rejected report is held to be the better one: Several environmentalists argue that the Kasturirangan report was a “diluted version” of the WGEEP report, which they consider better suited to conserving the Ghats with active local participation.
    2. The argument surfaces only after a disaster: Whenever landslips or flash floods strike Kerala or Kodagu, environmentalists blame policymakers for ignoring the WGEEP recommendations. The debate typically subsides within days, as routine concerns over access, amenities, roads and electricity take over.
    3. Much of the proposed area is already forest: An environmentalist based in Sagar taluk states that a major portion of the area proposed for the ESA in Karnataka is already notified forest, that the remainder is small, and that there should be no opposition to including it.
    4. The restrictions are said to be misread: The same view holds that people with vested interests are misleading the public with false information about the restrictions, that ordinary people have no reason to fear a ban on mining or on red-category industries, and that the push for organic farming benefits everyone.

    Challenges to the Western Ghats ESA notification

    1. A draft that never becomes a notification produces neither protection nor certainty: Each draft lapses and is reissued, so landowners cannot plan and the ecologically sensitive designation has no legal force in the interim. Eg. The proposal has now run through more than a decade of successive drafts without a single final notification issuing.
      The Fix: Fix a statutory outer limit within which a draft issued under the Environment (Protection) Act, 1986 must be finalised or formally withdrawn.
    2. ESA status does not stop the land use changes that do the most damage: Large hydel, transmission and road projects are cleared through separate forest and wildlife clearance processes that an ESA notification does not displace. Eg. The Athirappilly hydel project in Kerala’s Chalakudy basin has been proposed and revived repeatedly in a stretch the ecology panel placed in its highest sensitivity zone.
      The Fix: Write the prohibition on new hydel and mining leases into the notification itself, rather than leaving each project to a case-by-case clearance.
    3. Forest rights claims in the same landscape are unsettled: Restricting land use before individual and community claims are decided converts a pending claim into a permanent denial. Eg. The Scheduled Tribes and Other Traditional Forest Dwellers (Recognition of Forest Rights) Act, 2006 requires gram sabha verification of every claim, and recognition remains incomplete across the Western Ghats States.
      The Fix: Settle pending claims before the final notification takes effect, and attach the gram sabha resolution to the boundary record for each village.
    4. Tighter protection without habitat management raises human-wildlife conflict: Restricting access and infrastructure inside a landscape does nothing about crop raiding and encounters on the forest edge, which is what residents experience daily. Eg. Kodagu and Hassan districts record repeated elephant crop damage and human casualties, and conflict compensation in Karnataka runs among the highest in the country.
      The Fix: Fund a dedicated conflict mitigation line inside the ESA framework, covering barriers, rapid response teams and time-bound ex gratia payment.

    Conclusion

    The dispute is no longer about whether the Western Ghats need protection. It is about who verifies the boundary, and on what evidence. A line drawn from remote sensing and contested for over a decade has delivered neither conservation on the ground nor certainty for the people living inside it, and each reissued draft resets the argument to where it began. The question that decides the outcome is whether Karnataka answers this draft with a completed ground survey or with another objection.

    Back2Basics: Western Ghats

    1. What it is: The Western Ghats is a chain of hills running parallel to India’s western coast, older than the Himalaya, and it intercepts the south-west monsoon to produce the heavy orographic rainfall of the west coast.
    2. Global recognition: It is one of the world’s recognised biodiversity hotspots, a designation given to regions with exceptional endemism and severe habitat loss.
    3. World Heritage status: UNESCO inscribed a serial property of 39 sites across the Western Ghats on the World Heritage List in 2012.
    4. Why endemism matters here: A large share of its amphibians, fish and flowering plants are found nowhere else, and species such as the lion-tailed macaque and the Nilgiri tahr are restricted to this range.

    Matching Previous Year Question

    “Gadgil Committee Report’ and ‘Kasturirangan Committee Report’, sometimes seen in the news, are related to (a) constitutional reforms (b) Ganga Action Plan (c) linking of rivers (d) protection of Western Ghats”

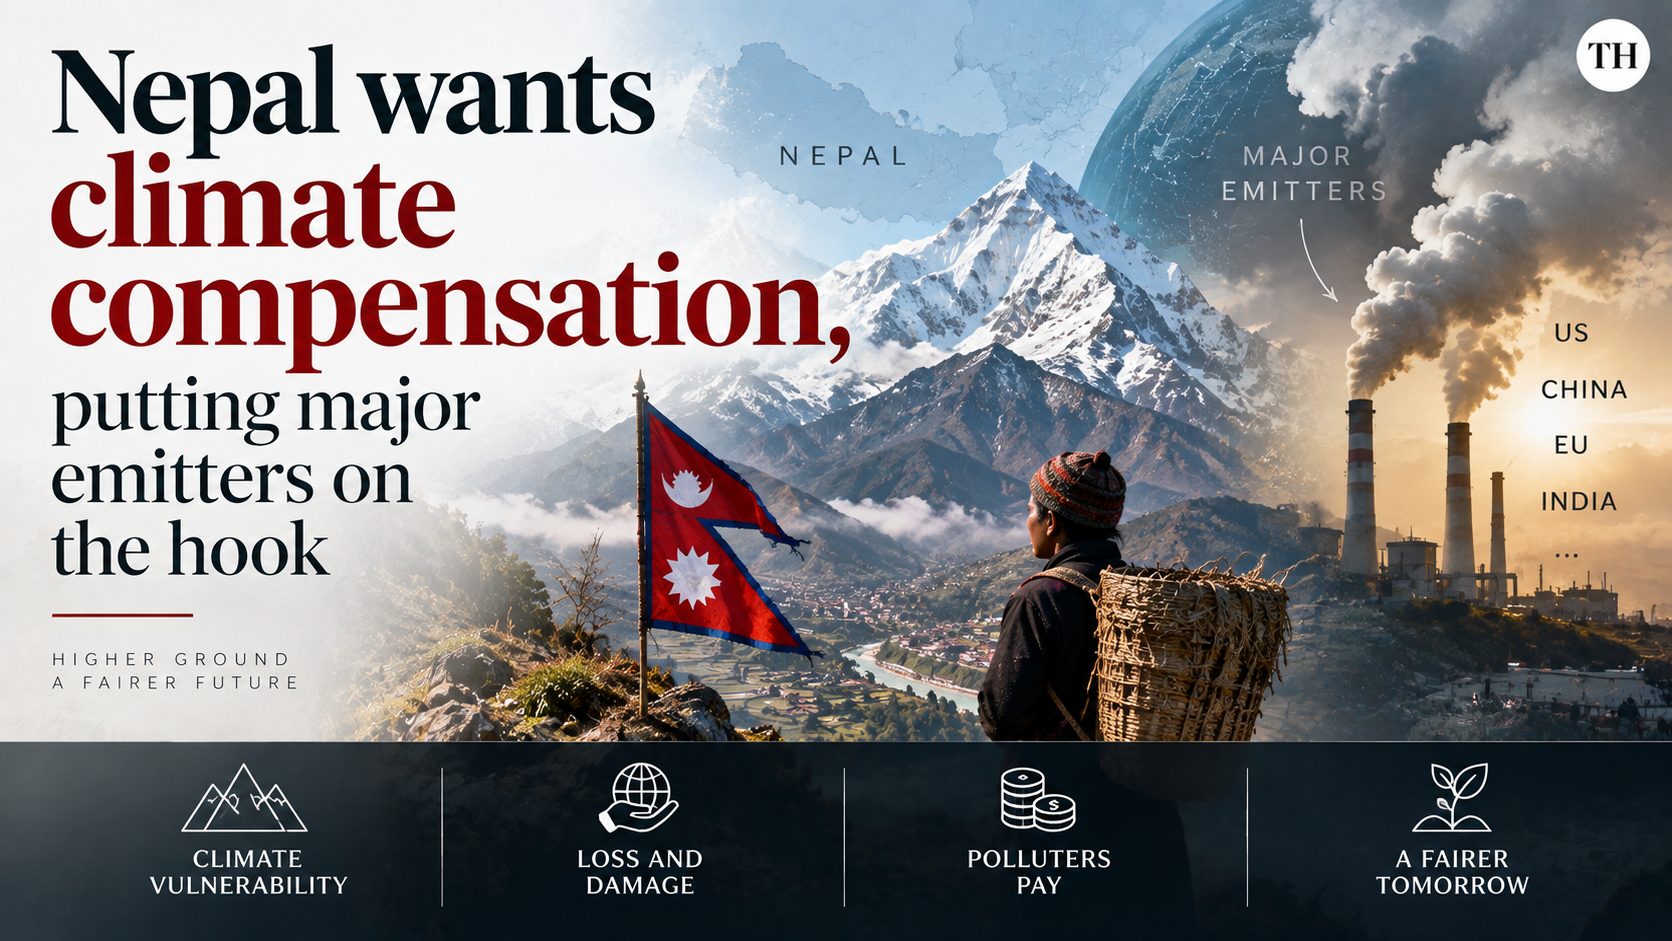
  • Nepal wants climate compensation, putting major emitters on the hookNepal wants climate compensation, putting major emitters on the hook

    Nepal wants climate compensation, putting major emitters on the hookNepal wants climate compensation, putting major emitters on the hook

    Why in the News

    Nepal has demanded direct climate compensation from the United States, China and India, the world’s three largest emitters. The demand follows the glacial collapse of 26 August on the Nepal China border, which killed over 1,200 people and buried hydropower tunnels and valleys downstream. Nepal’s Foreign Minister has framed the country as paying the ultimate price for a crisis it did not create.

    What is the Fund for Responding to Loss and Damage?

    1. What it is for: It is the dedicated financing mechanism for climate damage that has already occurred and can no longer be adapted to, as distinct from funds for mitigation or for adaptation.
    2. How it came about: Vulnerable nations secured its establishment at COP27 in 2022, after decades of resistance from developed countries to any dedicated loss and damage facility.
    3. When it began operating: It was operationalised a year later at COP28.
    4. Where it sits: It is temporarily hosted by the World Bank, which places a development lender at the centre of a compensation mechanism.

    Why does Nepal sit at the centre of climate injustice?

    1. Its own contribution is negligible: Nepal accounts for 0.1 percent of global greenhouse gas emissions and generates almost all its electricity from renewable hydropower.
    2. Its geography is the exposure: The Hindu Kush Himalayas, described as the “Third Pole”, are warming at nearly twice the global average, and their glaciers are melting at 10 times their historical norms.
    3. The driver is remote, not local: Warming in the North Eurasian Arctic disrupts planetary waves and the stratospheric polar vortex, which in turn destabilises the South Asian monsoon.
    4. The scale was misread: The major powers treated the event as a localised weather emergency manageable with temporary relief, when the cryosphere failure cascaded down into densely populated valleys.

    What did the disaster do to Nepal’s economy?

    1. It struck the sector the country had bet on: Nepal’s strategy for economic sovereignty rested on harnessing 43,000 MW of commercially viable hydropower to become a regional energy exporter, and it had only recently achieved net exporter status.
    2. A tenth of installed capacity is gone: The floods crippled approximately 10 percent of installed capacity, wiping out older surface level plants such as Devighat and burying under construction projects in mud.
    3. The trade position reversed overnight: A country banking on power exports to narrow its trade deficit with India halted exports and began importing power to survive the winter.
    4. Rebuilding costs more than building did: Climate resilient underground engineering will raise future project costs by 10 to 12 percent.
    5. The bill is a tenth of the economy: Total damages are estimated between 4 billion dollars and 7 billion dollars, roughly a tenth of Nepal’s entire gross domestic product.

    Why has Nepal named the United States, China and India?

    1. The case against the United States is cumulative: America accounts for over 20 percent of cumulative global emissions since 1850, which anchors the claim in historical liability rather than current output.
    2. The case against China is proximity and data: China is the current top annual emitter, and Nepali officials had asked at a bilateral meeting in Kathmandu in May 2026 for real time data sharing on glacial lakes and avalanches in the Tibetan region.
    3. What China supplied instead: Beijing provided only heavy rain forecasts, and the absence of transboundary early warning proved fatal when the glacial lake burst.
    4. The case against India inverts India’s own argument: New Delhi has long cited low per capita emissions and demanded “common but differentiated responsibilities” from the West, and Nepal now applies that logic regionally to South Asia’s largest economy and emitter.
    5. India’s regional conduct is part of the charge: India’s refusal to buy power from Nepali projects built by Chinese contractors has complicated Nepal’s recovery and spread the friction horizontally across the region.

    Why can the existing fund not answer the demand?

    1. The fund is smaller than one country’s damage: It holds a mere 700 million dollars in pledges, against a single catastrophe costing several billion.
    2. The grant ceiling makes the arithmetic absurd: Pilot phase rules cap individual grants at between 5 million and 20 million dollars, so the maximum available payout answers a fraction of one percent of the loss.
    3. Speed is the second failure: The mechanism is handicapped by slow moving bureaucracy, and Nepal’s out of cycle demand on 1 September forces its board to decide whether it can respond to a live emergency at all.
    4. Compensation may arrive as debt: Debt saddled developing nations fear that money routed through a development lender converts into loans, turning a liability payment into a further obligation.
    5. The major powers answered with relief, not liability: China and India responded with helicopters, rescue teams and medicines, which supplies assistance while conceding no legal responsibility.

    Challenges to Nepal’s compensation claim

    1. The climate treaty framework expressly rules out liability: The decision adopting the Paris Agreement records that loss and damage provisions do not involve or provide a basis for any liability or compensation. Eg. Developed countries insisted on that language in 2015 as the price of accepting loss and damage in the text at all.
      The Fix: Pursue the claim through state responsibility and human rights forums in parallel, so the treaty carve out does not extinguish the legal route entirely.
    2. Attributing a single collapse to named emitters is contested: Compensation requires linking one event to specific contributors, and attribution science produces probabilities rather than the causal certainty a liability claim needs. Eg. The International Court of Justice advisory proceedings on climate obligations turned substantially on whether such a link can ground state responsibility.
      The Fix: Commission an independent forensic attribution study of the 26 August collapse before the claim reaches any forum, so the demand rests on published evidence.
    3. Pledged climate money has a record of not arriving: Announced sums and disbursed sums diverge by years in climate finance. Eg. The 100 billion dollar a year promise made for 2020 at Copenhagen in 2009 was reported as met only in 2022.
      The Fix: Attach disbursement deadlines and public tracking to each pledge, so a pledge that is not paid is visible rather than absorbed into a cumulative total.
    4. Upstream data sharing rests on no binding obligation: Early warning for glacial hazards depends on the upstream state volunteering information, and no treaty compels it. Eg. Hydrological data on the Brahmaputra reaches India through renewable memoranda of understanding, and sharing lapsed after the 2017 Doklam standoff.
      The Fix: Negotiate a Hindu Kush Himalaya data protocol with automatic sensor level transmission, so glacial lake readings do not depend on the state of bilateral relations.
    5. Regional politics undercuts regional claims: Nepal is asking India for differentiated responsibility while its recovery is being slowed by an Indian trade restriction. Eg. Power from Nepali projects built by Chinese contractors is refused entry to the Indian market.
      The Fix: Separate the power trade rules from the security screening by publishing objective eligibility criteria, so recovery generation is not blocked by contractor nationality.

    Conclusion

    Nepal’s claim will not be paid, and that was never the whole point of making it. A country responsible for a rounding error in global emissions has converted a disaster into a legal argument, and the argument lands on India rather than only on the West. The precedent it sets is that differentiated responsibility runs downward as well as upward, which is uncomfortable for every middle emitter that has used the doctrine as a shield. What to watch is the fund board’s response to an out of cycle demand, since a refusal establishes that the mechanism handles paperwork rather than emergencies.

    Back2Basics: Common But Differentiated Responsibilities

    1. What the principle holds: All states share responsibility for protecting the global environment, and their obligations differ according to their historical contribution to the problem and their present capacity to act.
    2. Where it is written: It appears as Principle 7 of the 1992 Rio Declaration and in Article 3.1 of the United Nations Framework Convention on Climate Change (UNFCCC), 1992.
    3. How it was first operationalised: The Kyoto Protocol, 1997 split countries into Annex I parties carrying binding emission targets and non Annex I parties carrying none.
    4. How the Paris Agreement restated it: The 2015 text retains the principle “in the light of different national circumstances”, replacing the fixed two group split with nationally determined contributions.

    “[2017, GS3, 15 marks] ‘Climate Change’ is a global problem. How India will be affected by climate change? How Himalayan and coastal states of India will be affected by climate change?

  • [5th September 2026] The Hindu OpED: Warning on warming

    [5th September 2026] The Hindu OpED: Warning on warming

    Question (2025, GS3 – 15 Marks): “Write a review on India’s climate commitments under the Paris Agreement (2015) and mention how these have been further strengthened in COP26 (2021). In this direction, how has the first Nationally Determined Contribution (NDC) intended by India been updated in 2022?
    Linkage: This is the most direct conceptual parallel. To analyze the gap between “climate pledges” and “actual policy trajectory” highlighted by the UNEP, candidates must evaluate India’s specific NDCs under the Paris Agreement, how they were upgraded at COP26, and their final 2022 formalization

    Mentor Comment

    The United Nations Environment Programme (UNEP) has found that breaching the 1.5 degrees Celsius global warming limit brings irreversible losses that adaptation cannot undo. Its report, Limiting Overshoot, accepts that the limit has already been breached. Full delivery of every existing national climate pledge still puts the world on course for 1.8 degrees Celsius, and current policies point to 2.6 degrees Celsius. The report’s new emphasis falls on greenhouse gases other than carbon dioxide, and on methane above all. The disagreement it reopens is between assessments that measure climate progress by mitigation and major developing economies that measure it by the finance and technology they receive. That disagreement now reaches India directly, because a smaller neighbour hit by a glacial disaster has named India among the emitters responsible.

    What is the “overshoot, peak and decline” pathway?

    1. What it describes: Average global temperatures rise above the 1.5 degrees Celsius limit, countries hold that peak as low as they collectively can, and temperatures are brought back below the limit by the end of the century.
    2. Why the peak is the variable that matters: Neutralising the heating effect of even a tenth of a degree is far harder than preventing that rise in the first place, so every fraction avoided at the peak is a fraction that never has to be reversed.
    3. What it refuses to concede: The pathway accepts the scientific reality of a 1.5 degrees Celsius world and rejects the conclusion that nothing further can be done once the threshold is crossed.

    Why has the report shifted attention to gases other than carbon dioxide?

    1. Methane carries a large share of present warming: It is responsible for about 0.5 degrees Celsius of current warming, so cutting it changes the temperature curve within years rather than decades.
    2. It is the fastest available brake: Action on methane is treated as the most effective way to slow warming in the near term, which is precisely the window in which the peak is decided.
    3. The collective instrument already exists: More than 155 countries have joined the Global Methane Pledge, committing to cut anthropogenic methane at least 30 percent below 2020 levels by 2030.
    4. India stands outside it: India has not joined the Pledge, so the single fastest near term lever is not one the country has committed to pull.

    Why do major developing economies resist a mitigation first framing?

    1. They claim the transition is already under way: These economies argue that they are moving away from fossil fuels and should not be assessed as though they were not.
    2. The damage they face comes from someone else’s stock: Their vulnerability arises from historical accumulations of carbon released by richer developed countries, which is the basis of their claim to greater financial support and affordable technology.
    3. The report is silent where they are loudest: Limiting Overshoot has little to say on adaptation finance, so the question these economies bring to every negotiation goes unanswered in the assessment they are asked to act on.

    How does the Bhotekoshi disaster complicate India’s position?

    1. A vulnerable neighbour has named India: Nepal’s Foreign Affairs Minister has said that major industrial emitters such as China, the United States and India must consider the impact of rising temperatures on small countries such as Nepal.
    2. The victim framing no longer holds unchallenged: India’s per capita emissions remain below the world average, and a section of the world nonetheless now places India within the group causing the problem rather than the group suffering it.
    3. The next negotiation is dated: Countries convene in Turkiye in November for COP31, where the familiar disagreements over mitigation and finance are expected to resurface with this new complication attached.

    Challenges to the overshoot, peak and decline pathway

    1. The return leg depends on removal capacity that does not exist at scale: Bringing temperatures back below the limit assumes large volumes of carbon dioxide will be removed from the atmosphere later in the century. Eg. The direct air capture plants operating in Iceland remove tens of thousands of tonnes a year at most, against annual global emissions measured in tens of billions of tonnes.
      The Fix: Treat removal as a supplement to be verified and funded now, and set peak temperature targets that assume no removal beyond capacity already demonstrated.
    2. Some losses do not reverse when the temperature does: Ice sheets, coral reefs and glaciers respond to the peak rather than to the eventual average, so returning below 1.5 degrees Celsius does not restore what the overshoot destroyed. Eg. The August 2026 glacial collapse on the Nepal China border destroyed valleys that no later cooling will reconstitute.
      The Fix: Attach separate thresholds for irreversible systems to the pathway, so peak height is judged against them rather than against the century end average alone.
    3. The methane lever sits with countries that have not pulled it: The largest sources of anthropogenic methane are concentrated in a handful of economies outside the Pledge. Eg. India’s methane arises chiefly from livestock and paddy cultivation, which are livelihood activities rather than industrial infrastructure that can be shut down.
      The Fix: Fund livestock feed and paddy water management programmes that cut methane without cutting output, so the reduction is not paid for by farm incomes.
    4. The pathway offers nothing to those already past adaptation: A framework organised around peak management assumes adaptation absorbs the interim, and for the most exposed countries it does not. Eg. Nepal contributes a negligible share of global emissions and has lost roughly a tenth of its economy to a single event.
      The Fix: Pair every overshoot pathway with a stated adaptation finance figure, so the interim period carries a costed obligation rather than an assumption.

    Conclusion

    The threshold argument is over and the argument about who pays for its consequences is not. India has spent three decades arguing that historical responsibility sits elsewhere, and that argument is now being made about India by a country downstream of the Himalayas. Refusing the mitigation frame no longer settles the question, because the objection is arriving from the Global South rather than from the West. What to watch is whether India carries a methane position and an adaptation finance demand into COP31 as a single package, or continues to press the second while declining the first.

    Back2Basics: United Nations Environment Programme

    1. What it is: The United Nations body responsible for setting the global environmental agenda and coordinating environmental work across the UN system.
    2. When it was created: It was established in 1972, following the United Nations Conference on the Human Environment held at Stockholm that year.
    3. Where it sits: Its headquarters are at Nairobi, making it the first UN agency headquartered in a developing country.
    4. What it publishes: Its recurring assessments include the Emissions Gap Report, the Adaptation Gap Report and the Global Environment Outlook.
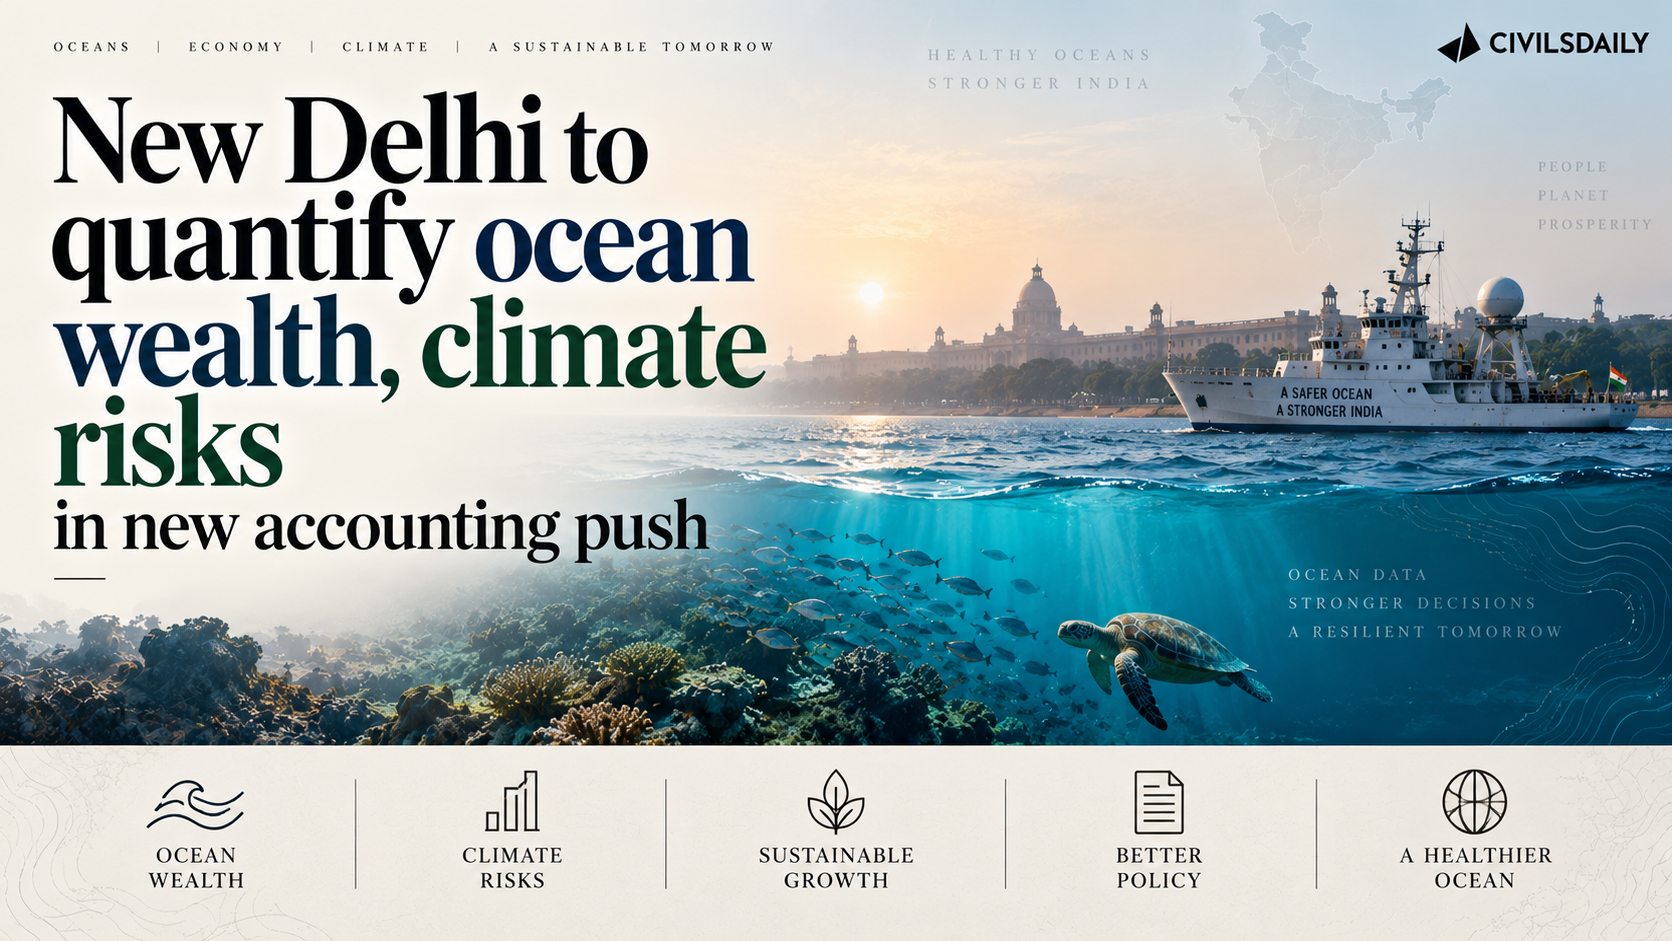
  • New Delhi to quantify ocean wealth, climate risks in new accounting push

    New Delhi to quantify ocean wealth, climate risks in new accounting push

    Why in the News

    The Ministry of Statistics and Programme Implementation (MoSPI) has issued a concept paper proposing to put a monetary value on India’s marine fish stocks and record them as a national asset.

    What is the System of Environmental Economic Accounting?

    1. About: SEEA is a United Nations statistical framework that records a country’s natural resources inside the same accounting structure used for its economy.
    2. The core idea: A natural resource is treated as a capital asset, and what is taken from it in a year is treated as a flow of economic benefit from that asset.
    3. Coverage in India: India has compiled environmental accounts since 2018 through the EnviStats India programme, covering assets such as land, water, forests, minerals and pollination.

    What do India’s current fisheries figures capture?

    1. Global standing: India is the world’s second largest fish producing country and accounts for 8 percent of global production.
    2. The inland and marine split: Total fish production in FY25 was 19.77 million metric tonnes, 77 percent of it from inland sources and 23 percent from the marine sector.
    3. Marine output has expanded: Marine fish production reached 46.15 lakh tonnes in 2024-25, against 34.43 lakh tonnes in 2013-14.
    4. Contribution to the economy: The sector contributed an estimated Rs 1.76 lakh crore in 2023-24, or 1.09 percent of national gross value added.
    5. Export volume and value: Marine product exports in FY25 were 1.7 million metric tonnes valued at Rs 62,408.45 crore, growing 3.11 percent a year in volume.
    6. Reach of the export basket: More than 350 varieties, including frozen fish, squid, cuttlefish and dried items, reach 130 international markets.

    Why do those figures not answer the sustainability question?

    1. Output says nothing about the stock: Aggregate production records how much was landed, not whether commercially important stocks can sustain similar production in future.
    2. Species and regions vanish into the total: A national tonnage figure hides the changing value of individual species and the condition of regional fish stocks.
    3. Fishing pressure leaves no trace: The long term effect of fishing pressure and environmental change does not register in an annual catch series.
    4. No blue economy series exists: India has no regular, comprehensive blue economy GDP series comparable with the series available for agriculture or manufacturing.
    5. Known potential carries a known risk: NITI Aayog puts the exclusive economic zone’s resource potential at about 7.16 million metric tonnes and warns that some deep sea resources are vulnerable to overexploitation.

    How far has this been attempted elsewhere?

    1. Only a handful of countries: The Organisation for Economic Cooperation and Development (OECD) notes that only a handful of countries currently compile monetary asset accounts for aquatic resources.
    2. The group India would join: Australia, the Netherlands, Norway, Canada, the United Kingdom, France, the United States and New Zealand are attempting to bring blue natural capital into national accounts.
    3. The contrast with land based assets: Valuation methods for forests and minerals are mature, and the aquatic equivalent remains at an experimental and pilot stage.
    4. The international guidance is dated: The SEEA-Fisheries conceptual guidance is outdated, so India is building on an incomplete standard rather than a settled one.

    How would a marine fish asset account be built?

    1. Define the accounting units: The first step selects the commercially, economically or ecologically important marine species the account will cover.
    2. Classify each stock: Species wise landing data for the preceding ten years serves as the initial proxy, and current landings are compared with historical peaks to mark a stock as regenerating, stable or depleting.
    3. Estimate the asset life: Each resource is assigned an asset life, which is the bridge between the fisheries science on the stock and its economic treatment.
    4. Calculate the resource rent: Resource rent is the income attributable to the natural resource after deducting labour, operating expenses, depreciation and a normal return on fishing vessels and other capital.
    5. Discount the future rents: Expected future resource rents are projected over the estimated asset life and discounted at a proposed 2 percent real rate to give a present value.
    6. The output: The result is a marine fish asset account, a statistical record carrying both the physical condition of a stock and its estimated economic value.

    What is riding on the outcome?

    1. Livelihoods: Fishing supports nearly 30 million livelihoods and is a cornerstone of the blue economy.
    2. Geography: India’s coastline runs about 11,100 km and carries rich marine biodiversity.
    3. The stated target: Available numbers put the blue economy at about 4 percent of GDP against a target of a $100 billion blue economy by 2030.
    4. Budget support: The latest Union Budget earmarked a record Rs 2,761.8 crore in total annual support, with the Pradhan Mantri Matsya Sampada Yojana (PMMSY) carrying Rs 2,500 crore in 2026-27.
    5. Competing claims on sea space: Fisheries compete with ports, tourism, offshore energy and coastal development for marine space. Integrated accounts give those trade offs one economic and environmental database.
    6. Investment decisions: A valuation would indicate whether to put money into additional fishing capacity, stock restoration or deep sea fisheries. It would also allow the economic cost of climate induced changes in marine resources to be estimated.

    Challenges to valuing marine fish stocks

    1. The asset is living and mobile: A fish stock changes in size and location continuously, which makes it harder to value at a point in time than a forest or a mineral deposit. Eg. Oil sardine landings along the Kerala coast collapsed through the 2010s and then partially recovered, moving the stock’s value within a single decade.
      The Fix: Anchor the account to periodic scientific biomass surveys by the Central Marine Fisheries Research Institute rather than to landing data alone.
    2. Landings measure effort as much as abundance: What boats bring ashore reflects fleet capacity, fuel prices and market demand alongside the size of the stock. Eg. Landings can rise as vessels mechanise and trips lengthen even as the underlying stock thins.
      The Fix: Report effort adjusted catch per unit effort alongside raw landings, so a rise in output is separated from a rise in fishing pressure.
    3. The discount rate decides the answer: A present value calculation is highly sensitive to the rate chosen, so the 2 percent assumption fixes how much weight future stocks carry. Eg. A higher rate values a stock mainly by what it yields in the next few years and makes long term depletion look cheap.
      The Fix: Publish the account across a range of discount rates so the valuation’s dependence on that single assumption is visible to the user.
    4. An account does not restrain a catch: Recording depletion changes no rule about who may fish, since marine fishing within territorial waters is regulated by coastal States under their own legislation. Eg. Monsoon fishing bans and mesh size rules are notified State by State along the coastline.
      The Fix: Require stock classifications from the account to feed directly into the fisheries management plans and catch limits of coastal States.

    Conclusion

    Valuing a fish stock changes what the national accounts can show, not what the fishing fleet is allowed to take. The account will report depletion only as accurately as the biological data underneath it, and that data is the weakest part of the exercise. The test is whether the numbers reach harvesting rules and coastal livelihood decisions rather than stopping at a statistical publication.

    Back2Basics: Exclusive Economic Zone

    1. Legal basis: The exclusive economic zone is established by the United Nations Convention on the Law of the Sea, 1982.
    2. Extent: It reaches up to 200 nautical miles from the baseline from which the territorial sea is measured.
    3. Rights it confers: The coastal State holds sovereign rights to explore, exploit, conserve and manage the living and non living resources of the zone.
    4. India’s zone: India’s exclusive economic zone covers over 2 million square km, which is larger than its land area.

    [2026] At the United Nations Ocean Conference (UNOC) held in June, 2025 in France, the Food and Agricultural Organization (FAO) of the United Nations demonstrated its leading voice on marine and ocean issues, especially on sustainable fisheries and aquaculture for resilient livelihood and ‘Blue Transformation’. Which of the following combinations about the ‘Four Betters’ proposed by FAO for ‘Blue Transformation’ is correct?

    (a) Better production, better nutrition, better environment and better ocean

    (b) Better production, better nutrition, better environment and better life

    (c) Better coral reefs, better nutrition, better environment and better life

    (d) Better estuaries, better nutrition, better environment and better mangrove vegetation

  • Air quality panel holding talks with Punjab govt. and ISRO over tracking of stubble fires

    Air quality panel holding talks with Punjab govt. and ISRO over tracking of stubble fires

    Why in the News

    The Commission for Air Quality Management in the National Capital Region and Adjoining Areas (CAQM), the statutory body that directs anti-pollution action across Delhi and the States around it, has said it is in talks with Punjab, Haryana and the Indian Space Research Organisation (ISRO) to improve how stubble fires are measured.

    How does satellite fire counting work?

    1. Detection by heat signature: Two satellites passing over India during the day register the thermal signature of an active fire and log it as a fire count.
    2. A fixed overpass window: A polar orbiting satellite crosses a given location at roughly the same local time each day, so it sees only the fires burning at that moment.
    3. A count is not a quantity: The record shows that a field was alight. It does not show how much particulate matter the burning released.

    Why has the reported decline in farm fires come under doubt?

    1. The peak moved by three and a half hours: The Space Applications Centre recorded peak fire activity at about 1.30 p.m. in 2020 and at about 5 p.m. in 2024.
    2. The shift tracks the enforcement window: Farmers face fines for being caught setting fire to their fields, and burning after the daytime satellite passes leaves no entry in the record.
    3. Evidence has accumulated since 2024: Doubt over the Punjab government’s claim of a 90 percent reduction in farm fires since 2021 has been mounting since 2024.
    4. A decline that may be an artefact: A fall produced by unrecorded burning leaves the actual acreage burnt unknown, so the reported improvement cannot be checked.

    Why does the measurement matter for the capital’s winter air?

    1. Farm fires are a spike, not the base load: Over a whole winter farm fires contribute no more than 15 percent of particulate matter pollution. In certain weeks that share rises to almost 44 percent.
    2. The weather closes the escape route: Stalled monsoon withdrawal weakens the westerly winds that flush particulate matter out of the region through October and November.
    3. Several sources load the same air: Vehicles, industry, road dust, agricultural waste and Deepavali crackers add to the load in the same weeks.
    4. Paddy residue has a disposal logic: Stubble left after the paddy harvest is burnt to clear the field for wheat sowing, since burning is the quickest and cheapest method available.
    5. The response is calibrated to the number: The winter air quality response for the Delhi National Capital Region is built on this dataset, so a wrong count misdirects the measures taken.

    Why is a replacement protocol difficult to define?

    1. Burnt area measures land, not emissions: Mapping singed acreage gives a better estimate of how much land was burnt. The CAQM Chairman noted it is still not an accurate measure of the particulate matter emitted.
    2. Ground truthing needs the States: Verification on the ground requires Punjab and Haryana to run field checks against the satellite record, which is what the Commission is negotiating with both.
    3. A first protocol has been sought this year: ISRO has been asked to supply a basic protocol this year so that the estimate improves on fire counts.

    Challenges to stubble fire measurement

    1. A single daytime overpass: One pass at a fixed hour cannot capture a fire lit after it. Eg. The Terra and Aqua satellites carrying the Moderate Resolution Imaging Spectroradiometer (MODIS) cross northwest India around the middle of the day.
      The Fix: Pair the polar orbiting record with geostationary imaging from INSAT-3D and INSAT-3DR, which observe the same area every fifteen minutes, and with night time detections from the Visible Infrared Imaging Radiometer Suite.
    2. Cloud and haze block an optical sensor: Smoke and cloud hide active fires at exactly the point in the season when burning peaks. Eg. Detection weakens during the late October haze episodes that trigger emergency curbs in the capital.
      The Fix: Add radar based burnt area mapping from Sentinel-1, which images through cloud, as an independent cross check on the count.
    3. Penalties fall on the cultivator, not on the residue: Environmental compensation and red entries in land records punish the act of burning without funding an alternative to it. Eg. Punjab has recovered environmental compensation from farmers recorded as burning paddy stubble.
      The Fix: Pay a verified per acre amount for residue actually managed, so the incentive attaches to disposal rather than to concealment.
    4. The window between two crops is too short: Roughly two to three weeks separate the paddy harvest from wheat sowing, which makes burning the only method that fits. Eg. The Punjab Preservation of Subsoil Water Act, 2009 pushes paddy transplanting into late June and shortens the gap at the other end.
      The Fix: Expand shorter duration paddy varieties such as PR-126 and guarantee machinery through custom hiring centres so the window becomes workable.
    5. The airshed is governed in pieces: Punjab, Haryana, Rajasthan, Uttar Pradesh and Delhi each report and act separately on pollution that is common to one airshed. Eg. The Graded Response Action Plan is triggered by the air quality index recorded in Delhi.
      The Fix: Build one airshed level emission inventory on a common reporting standard, so source shares are settled by an agreed method rather than disputed each winter.

    Conclusion

    The argument here is not about whether stubble is burnt but about whether the instrument that counts it still works. A performance claim measured by a tool that a farmer can time his way around cannot settle how much of the capital’s winter air the fields are answerable for. The marker to watch is whether a verification protocol is in place before the burning window opens rather than after it closes.

    Back2Basics: Commission for Air Quality Management

    1. Statutory basis: The Commission was established under the Commission for Air Quality Management in National Capital Region and Adjoining Areas Act, 2021.
    2. Jurisdiction: It covers Delhi and the adjoining areas of Haryana, Punjab, Rajasthan and Uttar Pradesh that affect the capital’s air quality.
    3. Powers: It issues directions binding on State governments and State pollution control boards, and its directions prevail where they conflict with a State board’s.
    4. Enforcement: Non-compliance with its directions is punishable with imprisonment of up to five years or a fine of up to one crore rupees.

    [2020, GS3, 15 marks] What are the key features of the National Clean Air Programme (NCAP) initiated by the Government of India?

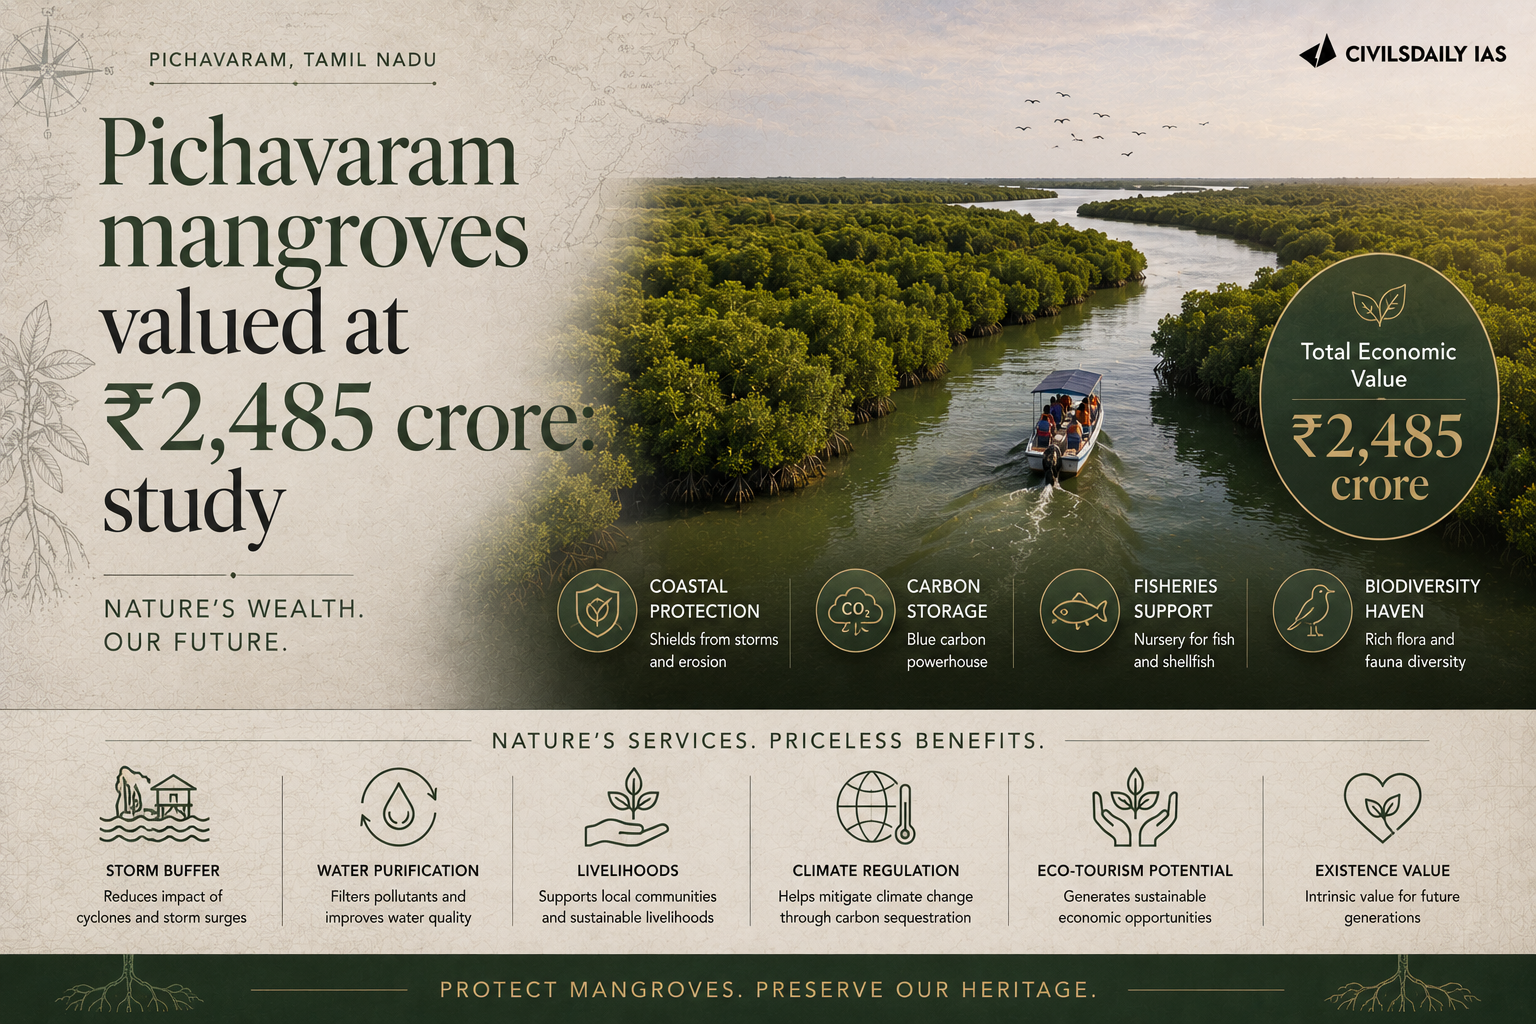
  • Pichavaram mangroves valued at ₹2,485 crore: study

    Pichavaram mangroves valued at ₹2,485 crore: study

    Why in the News

    A study of the Pichavaram mangrove ecosystem in Tamil Nadu has put its total economic value (TEV) at ₹2,485.38 crore, with a per hectare value of ₹1.83 crore. The valuation covers ecological, economic and social benefits together, and includes a separate blue carbon assessment of what the forest stores. The study was carried out at the Centre for Ecological Economics and Natural Resources, Institute for Social and Economic Change, Bengaluru, and was funded by the Forest Genetics Division, Coimbatore. The tension it identifies is that most of what a mangrove supplies is non market in nature, so it never enters the accounts that development planning actually uses.

    What is ecosystem service valuation?

    1. About: Ecosystem service valuation attaches a monetary figure to the benefits a natural system supplies, so that those benefits can be compared against the returns from converting the same land to another use.
    2. The four service categories: Mangrove systems supply provisioning, regulating, supporting and cultural ecosystem services. Provisioning covers physical output such as fish, regulating covers functions such as storm buffering and climate regulation, supporting covers processes such as nutrient cycling, and cultural covers non material benefits.
    3. Total economic value: TEV is the aggregate of all these service flows expressed in one figure, rather than only the marketed output the system yields.

    What did the valuation measure?

    1. The headline value: The total economic value of the Pichavaram mangrove ecosystem stands at ₹2,485.38 crore, and the per hectare value at ₹1.83 crore.
    2. Sediment holds more carbon than the trees: The analysis found that mangrove sediments constitute a more substantial carbon reservoir than the vegetation.
    3. Soil carbon density: Average soil organic carbon stock was estimated at 251.14 tonnes of carbon per hectare, generating an economic value of ₹90.24 lakh per hectare.
    4. Combined blue carbon asset: With vegetation and soil carbon pools taken together, the total blue carbon asset value of the ecosystem is ₹1,612.40 crore. Blue carbon is the carbon captured and stored by coastal and marine vegetation and the sediment beneath it.

    Why do these benefits stay out of development planning?

    1. The services are non market: Several ecological benefits are non market in nature and are not reflected in market transactions, so they generate no price a planner can read.
    2. Undervaluation is the consequence: Many ecosystem services remain undervalued in conventional development planning even where their contribution to ecological sustainability and human well being is established.
    3. Valuation is the bridge: A single expressed figure allows a non market service to be set against a marketed alternative use of the same coastal land.

    What makes Pichavaram ecologically significant?

    1. Status: It is deemed one of the most ecologically significant coastal wetland ecosystems in India.
    2. Biodiversity and fisheries: It supports biodiversity conservation and fisheries productivity.
    3. Coastal protection and climate regulation: It provides coastal protection, climate regulation and blue carbon sequestration.
    4. Livelihood security: It underpins livelihood security for the coastal communities that depend on it.

    How was the study built?

    1. Primary and secondary data: The assessment combined primary field data with secondary sources rather than relying on modelled estimates alone.
    2. Household survey base: Primary information was collected from 302 households across five mangrove dependent villages.
    3. The villages covered: The five are MGR Thittu, Kalaignar Nagar, Chinnavaikal, Patriadi and Mudasalodai.

    What does the study recommend?

    1. Valuation inside planning: Ecosystem service valuation should be integrated into coastal development planning and environmental decision making.
    2. Mangroves as nature based solutions: Mangroves should be recognised as key nature based solutions for climate adaptation and disaster risk reduction.
    3. Finance instruments: Blue carbon financing mechanisms, carbon credit programmes and Payment for Ecosystem Services schemes should be developed for these systems.

    Challenges to using ecosystem service valuation in coastal planning

    1. A non market service produces no cash flow: A protective service is realised only when the hazard it guards against actually occurs, so it never appears in a project’s financial statement. Eg. Mangrove storm buffering shows up as damage avoided during a cyclone landfall, which no project account records.
      The Fix: Require the ecosystem service value of the land to be entered as a stated line item in the cost benefit statement of every coastal infrastructure clearance.
    2. Valuation methods are contested: Survey based techniques such as willingness to pay measure what nearby residents can afford rather than what the service is worth to the wider economy. Eg. Household surveys in poor mangrove dependent villages return low willingness to pay figures for the same service that protects a city downstream.
      The Fix: Publish the method, the sample and the confidence range alongside every headline valuation figure so the number can be contested on its assumptions.
    3. Aquaculture and land conversion drive mangrove loss: The land use that competes with mangrove is profitable, immediate and privately captured, while the service lost is diffuse and public. Eg. Shrimp pond expansion along the Tamil Nadu and Andhra Pradesh coast has cleared mangrove and adjoining back swamp.
      The Fix: Tie Coastal Regulation Zone enforcement to satellite based mangrove cover monitoring with annual public reporting at the district level.
    4. Blue carbon credits lack a settled soil accounting standard: Sediment carbon is the largest pool and the least standardised, so the same forest yields different credit volumes under different protocols. Eg. Soil carbon is measured to one metre depth in some protocols and deeper in others.
      The Fix: Adopt a single national measurement protocol for mangrove soil organic carbon before any credit is issued against Indian mangrove land.
    5. Restoration often replaces hydrology with planting: Plantation drives on sites that were never mangrove habitat produce low survival and no service recovery. Eg. Monoculture planting on open mudflats has repeatedly failed where tidal flushing was never restored.
      The Fix: Restore tidal connectivity and creek hydrology first, and allow natural regeneration to determine species composition.

    Conclusion

    A valuation changes nothing by itself. It changes outcomes only when the figure enters the document that decides land use, and coastal zone plans in India are still written without one. Tamil Nadu’s coastal clearances are the place this will show. The marker to watch is whether an approval order for coastal land begins citing a per hectare service value against the project it is approving.

    Back2Basics

    1. Location: The Pichavaram mangrove forest lies in Cuddalore district on the Tamil Nadu coast.
    2. Setting: It sits in the estuarine complex formed between the Vellar and Coleroon rivers, adjoining the Killai backwater.
    3. Scale: It is among the largest mangrove forests in India and is made up of a network of islets separated by tidal creeks.
    4. Composition: Avicennia and Rhizophora are the dominant mangrove genera across the forest.

    [2023, GS3, 15 marks] Comment on the National Wetland Conservation Programme initiated by the Government of India and name a few India’s wetlands of international importance included in the Ramsar Sites.

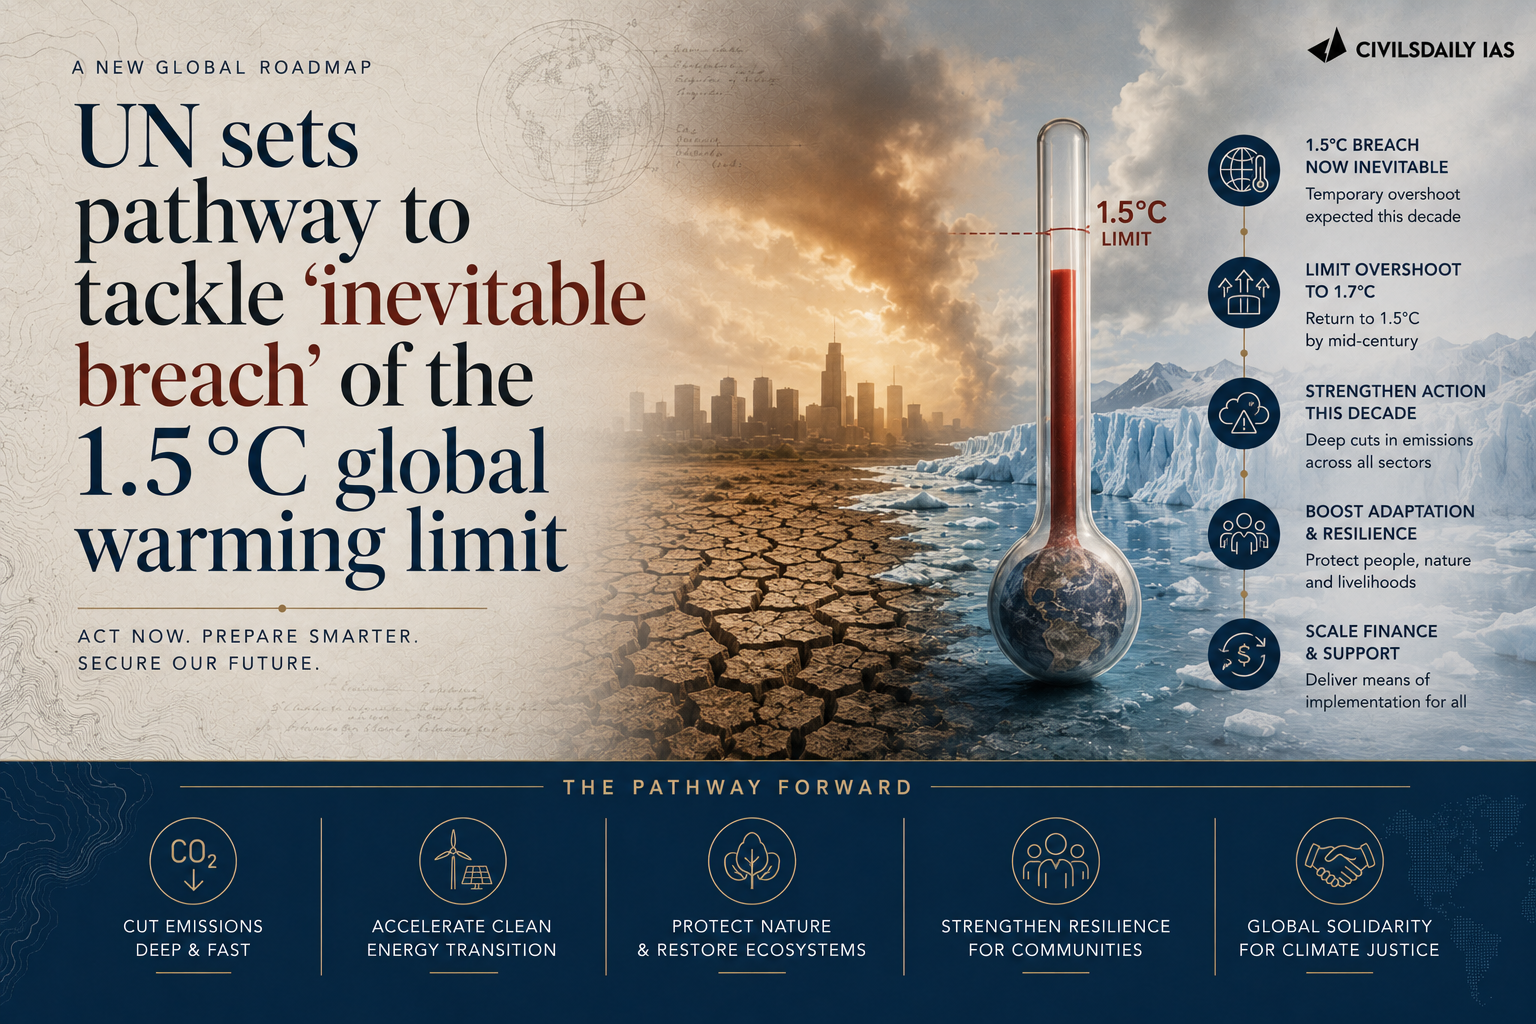
  • UN sets pathway to tackle ‘inevitable breach’ of the 1.5°C global warming limit

    UN sets pathway to tackle ‘inevitable breach’ of the 1.5°C global warming limit

    Why in the News

    The United Nations Environment Programme (UNEP) has for the first time set out a detailed “overshoot, peak, and decline” pathway for global warming. Its report, Limiting Overshoot, states that a breach of the 1.5 degrees Celsius limit is now unavoidable and will bring irreversible ecological losses that no adaptation initiative can undo. That limit is the central goal of the Paris Agreement, 2015, which committed parties to holding the rise in average global temperatures well below 2 degrees Celsius and to pursuing efforts to limit it to 1.5 degrees Celsius above pre industrial levels. The shift is in the framing rather than in the science: the objective being planned for is no longer the prevention of a breach but the management of one, described in the report itself as by no means an acceptable or preferred pathway and simply the best remaining option.

    What is the “overshoot, peak, and decline” pathway?

    1. The sequence it describes: Average global temperature crosses the 1.5 degrees Celsius limit, rises to a peak, and is then brought back down below the limit by 2100.
    2. What it tries to control: With the crossing treated as fixed, the two variables left are the height of the peak and the length of time spent above the limit, and the pathway seeks to hold both as low as possible.
    3. What it requires that mitigation alone does not: Returning below the limit after a peak requires removing carbon dioxide already in the atmosphere, not only stopping additional emissions.

    What do the warming projections show?

    1. The breach is imminent: Global warming will cross 1.5 degrees Celsius in the next few years.
    2. Full delivery of every pledge still overshoots: A scenario in which every country delivers on its national climate plan and its net zero target puts peak warming at 1.8 degrees Celsius.
    3. Current policies point far higher: They point to a rise of about 2.6 degrees Celsius by 2100, within a range of 1.9 to 3.6 degrees Celsius.

    What are the compounding costs of time spent above 1.5 degrees Celsius?

    1. Sea level and ocean systems: Sea level rise accelerates, and coral reefs collapse.
    2. Cryosphere: Glacier loss exceeds a quarter of global glacier mass by 2100.
    3. Food systems: Global food production declines by up to 14% by 2050 without effective adaptation.
    4. Tipping points: The odds rise of irreversible transitions in the West Antarctic and Greenland ice sheets, the Atlantic Meridional Overturning Circulation, the ocean current system that redistributes heat across the Atlantic, and the Amazon.

    Why is reversing an overshoot harder than avoiding it?

    1. Delay adds warming at a fixed rate: Every five years of continued high emissions adds roughly 0.1 degrees Celsius to peak warming.
    2. Removing the same warming costs far more than adding it: Reversing that 0.1 degrees Celsius afterwards means pulling about 220 billion tonnes of carbon dioxide out of the atmosphere, over and above whatever is still being emitted.
    3. Emission cuts alone no longer close the gap: A steep scaling up of nature based removals, such as large reforestation programmes, is required alongside them.

    Why does the report single out methane?

    1. A first for the United Nations: This is the first time a report of this kind has placed significant stress on methane rather than treating carbon dioxide as the only lever.
    2. Its share of the problem is large: Methane contributes about 0.5 degrees Celsius of current warming.
    3. It is the fastest acting lever available: Cutting methane is described as the most effective way to slow warming in the near term, which is precisely what holding down the peak requires.

    How was the diplomatic ground for conceding an overshoot laid?

    1. The concession was made first at a climate conference, not in a science report: The 30th UN Climate Change Conference (COP30), held in 2025 at Belém in Brazil, produced the consensus “Global Mutirão” decision, mutirão being a Portuguese term for collective effort.
    2. What made it significant: It was the first COP text to concede that a temporary overshoot of the 1.5 degrees Celsius limit was likely, given how fast the remaining carbon budget was being spent.
    3. The political framing accompanying the report: This summer’s heat, wildfires and floods have been described as a warning of what lies ahead, with the stated objective now to make the overshoot as small and as short as possible.

    Challenges to an overshoot, peak and decline pathway

    1. Carbon removal at the required scale does not exist: The pathway assumes gigatonne scale removal that current technology and land availability cannot deliver. Eg. Operating direct air capture plants worldwide remove a volume measured in thousands of tonnes a year against a requirement measured in billions.
      The Fix: Separate emission reduction and removal targets in every nationally determined contribution, so removal cannot be used to discount a country’s reduction obligation.
    2. Overshoot creates a moral hazard in near term policy: Once a temporary breach is accepted as planned for, the incentive to cut now weakens, because the shortfall is deferred to a future removal obligation. Eg. Net zero pledges dated to mid century already rely on unspecified future removals to close the residual gap.
      The Fix: Fix binding five year interim carbon budgets, so a country’s compliance is assessed against cumulative emissions rather than against a distant target year.
    3. Tipping points are not reversible when the temperature comes back down: Bringing temperature below the limit later does not restore a system that has already crossed its threshold. Eg. An ice sheet that has begun irreversible retreat continues losing mass even after warming stabilises.
      The Fix: Set the peak temperature, rather than the end of century value, as the headline metric against which climate policy is assessed.
    4. Nature based removal competes with food and land rights: Large reforestation programmes need land that is already used for cultivation, grazing or forest dwelling communities. Eg. Plantation drives on land recorded as degraded have displaced pastoral and forest dependent use in several countries.
      The Fix: Require free, prior and informed consent and a land tenure audit before any removal project is counted towards a national target.
    5. The cost falls on countries that did not cause the overshoot: Adaptation finance to survive the period above the limit is needed by economies with the least capacity to raise it. Eg. Small island developing states face permanent territorial loss from sea level rise they contributed almost nothing to.
      The Fix: Tie disbursement from the loss and damage fund to a published overshoot period schedule, so the finance arrives during the years the harm is being incurred.

    Conclusion

    The value of this pathway is that it makes the cost of delay arithmetic rather than rhetorical. Warming added by continuing to emit is cheap and automatic; warming removed afterwards is expensive, slow and dependent on technology that has not been built at scale. That asymmetry is what converts a distant target year into an immediate operational question about the next few years of emissions. The reform that follows is to shift the metric climate policy is judged on, from a date by which a country claims to reach balance to the height of the peak its emissions in this decade produce.

    [2025, GS3, 15 marks] Write a review on India’s climate commitments under the Paris Agreement (2015) and mention how these have been further strengthened in COP26 (2021). In this direction, how has the first Nationally Determined Contribution (NDC) intended by India been updated in 2022?”

  • Solution for stubble burning lies close to the farm

    Solution for stubble burning lies close to the farm

    Why in the News


    Punjab’s paddy harvesting season is approaching, reviving Delhi’s air-pollution concerns. The focus is shifting from banning stubble burning to creating profitable markets for parali and increasing farmers’ income.

    What is biochar?

    1. Definition: Biochar is a carbon-rich material produced by heating biomass under limited oxygen, so the carbon is retained as char rather than burnt away.
    2. Feedstock: It can be made from crop residues such as paddy, maize, cotton and mustard stalks.
    3. Yield: Roughly 100 kg of dry parali yields around 30 kg of char.
    4. Use in soil: Applied to soil, it improves water retention and nutrient-use efficiency and locks carbon away for a century.

    Why do farmers still burn after years of measures?

    1. Unchanged economics: Residue is bulky, the window before wheat sowing is narrow, and almost every alternative to burning carries a cost.
    2. Burning is quick and cheap: Alternatives involve cost, labour and uncertainty, so burning remains the rational choice at the field.
    3. Limits of enforcement and subsidy: Enforcement and machinery subsidies help, and behaviour changes only when the residue itself becomes valuable.

    What has changed in the economics of parali?

    1. From a cost to a price: Farmers in several locations were paying to have straw removed. Today in parts of Punjab the same straw fetches around Rs 1.5 to 2 per kg.
    2. Who is buying: Demand from power plants, compressed biogas (CBG) units and pellet manufacturers is slowly creating a market for what was treated as waste.
    3. The new question: If parali now has value, the issue is where that value should be created and how much can remain with the farmer.

    Why is biochar different from burning straw for energy?

    1. Carbon fate: Burning biomass as fuel recovers energy and returns much of its carbon to the atmosphere. Biochar applied to soil retains a significant share of the carbon and serves an agronomic purpose.
    2. Punjab’s need: The rice-wheat system is under stress from declining soil quality, intensive fertiliser use and groundwater depletion, and residue generated by the same system could improve its soils.

    Where is the value created, and who captures it?

    1. The processing location problem: Parali has to be collected, baled, stored and transported within the narrow window before wheat sowing. Long-distance transport of a bulky, relatively low-value material quickly eats into its economics.
    2. Farmer as raw material supplier: The farmer supplies the raw material, and most value addition happens after the biomass leaves the village.
    3. The biochar irony: A farmer supplies the straw, sees it processed elsewhere and later buys back a product made from biomass originating on farms like his.
    4. The chakki precedent: Wheat does not travel 100 km merely because flour requires machinery. The village chakki places processing close to where the commodity is produced and consumed.

    How would a village-scale biochar system work?

    1. Build-operate-transfer: A technology provider installs and operates the unit, trains local operators and ensures quality and emission standards. Over time the asset and the capability transfer to a farmer producer organisation (FPO), a self-help group (SHG) or a cooperative.
    2. Government’s role: The government provides standards, training, concessional finance and initial support rather than running thousands of units, and panchayats help with land and coordination.
    3. Farmer’s routine: Farmers bring straw to a nearby processing point much as they bring wheat to a flour mill. Some biochar returns to their fields and the rest is sold where markets exist.
    4. What changes: Raw straw travels less, value addition happens closer to the farmer, and villages are not left with subsidised machinery nobody knows how to operate.

    Challenges to village-scale biochar processing

    1. Emissions from small kilns: A poorly run pyrolysis unit releases methane, carbon monoxide and particulate matter, and so replaces one smoke source with another. Eg. The Kon-Tiki flame curtain kiln, the low-cost design most village pilots use, has no flue gas treatment.
      The Fix: Notify emission standards for small pyrolysis units under the Central Pollution Control Board and make the build-operate-transfer operator liable for them until handover.
    2. Carbon credit verification: Biochar earns carbon removal credits only where permanence is measured, and a village unit cannot measure it alone. Eg. The Puro.earth biochar methodology requires a hydrogen to organic carbon ratio below 0.7 as the test of permanence.
      The Fix: Aggregate village units under an FPO level registry with laboratory testing so that credits are pooled and sold at scale.
    3. Paddy straw is a poor feedstock on its own: Paddy straw carries a high silica content, so its char is ash heavy and lower in fixed carbon than wood char. Eg. Rice straw ash is largely silica, and the char inherits it.
      The Fix: Blend paddy straw with maize, cotton and mustard stalks across seasons so that a unit runs year round on a better mix.
    4. Competition from existing straw buyers: A village unit competes for the same straw as large plants that already pay for it. Eg. The Verbio compressed biogas plant at Lehragaga in Sangrur, Punjab, consumes about one lakh tonnes of paddy straw a year.
      The Fix: Site biochar units in blocks beyond the collection radius of existing CBG and pellet plants, using the State’s straw balance map.
    5. Window mismatch: Straw arrives in three weeks and a unit needs feedstock for months. Eg. Punjab’s paddy harvest runs through late October and wheat sowing closes by mid-November.
      The Fix: Subsidise baling and covered storage at the processing point under the crop residue scheme so that processing continues after the window closes.

    Conclusion

    The policy question on parali has moved from stopping a practice to locating a market, and the location decides who captures the value. Village-scale processing answers that question only if quality, emissions and offtake are secured before the technology provider exits. The next window is the October to November harvest. Whether any State pairs its residue management subsidies with village-level processing points is the thing to watch.

    Stubble Burning in India

    1. What it is: Stubble burning is the practice of setting fire to the straw residue left in fields after harvest, especially paddy, to clear the land quickly for the next sowing.
    2. Where and when: It is concentrated in Punjab, Haryana, Uttar Pradesh and the National Capital Region during the post-monsoon October to November window.
    3. Why it happens: The narrow gap between paddy harvest and wheat sowing pushes farmers toward the cheapest and fastest clearing method.
    4. Scale: Punjab alone generates about 20 million tonnes of paddy straw a year.

    Challenges in Stubble Burning

    1. Episodic air pollution: Burning sharply aggravates the Air Quality Index across the Indo-Gangetic Plain within days. Eg. In December 2025 Delhi’s AQI crossed 500 and over 150 flights were delayed.
      The Fix: Front-load machine deployment in the fortnight before harvest with block-level fire targets monitored by satellite.
    2. Soil degradation: Burning destroys beneficial soil microbes, nitrogen and organic carbon. Eg. Each tonne of burnt paddy straw loses about 5.5 kg of nitrogen, 2.3 kg of phosphorus and 25 kg of potassium.
      The Fix: Pay a per-acre incentive for in-situ incorporation with Happy Seeder or Super Seeder, verified by satellite.
    3. Meteorological trap: Winter temperature inversions and calm winds prevent dispersal and compound the damage. Eg. Delhi invoked Stage IV of the Graded Response Action Plan in November 2024 when the AQI crossed 450.
      The Fix: Time enforcement and straw collection to the weeks before inversions set in rather than to the pollution peak.
    4. Paddy-centric cropping in a water-stressed region: Free farm power and assured procurement lock Punjab into paddy. Eg. About three fourths of Punjab’s groundwater assessment units are over-exploited as per the Central Ground Water Board.
      The Fix: Offer a per-hectare diversification incentive for maize and pulses with assured procurement so that the residue problem shrinks at source.
    5. Penalty without a price: Enforcement fines farmers who have no cheaper alternative. Eg. Environmental compensation for burning was doubled in November 2024 to Rs 5,000 for under two acres, Rs 10,000 for two to five acres and Rs 30,000 above five acres.
      The Fix: Pair the penalty with a guaranteed straw purchase price at the block level so that not burning is the cheaper option.

    “[2025, GS3, 10 marks] What is Carbon Capture, Utilization and Storage (CCUS)? What is the potential role of CCUS in tackling climate change?”