💥Mains Ready By December. Smash Mains & Smash PYQ Admissions Open

GS Paper: GS1-06.Salient features of Indian Society


  • ‘OBC lists were not used for Census as they featured classes, not castes’

    Why in the News

    The Union government has settled the 2027 Census on an open column method of recording caste, under which every caste outside the Presidential Scheduled Caste and Scheduled Tribe lists is written down as the household states it. The Central and State lists of Other Backward Classes (OBCs) were considered as the alternative and rejected, on the recorded ground that the list of OBCs is a list of classes and not a list of castes. The Union Cabinet had approved the inclusion of caste in the Census forms a year after the Opposition campaigned for a caste census, and the need to enumerate the OBC population was that campaign’s main argument. The method now chosen produces no OBC count of its own, which is the point the Leader of the Opposition in the Lok Sabha and the Congress president are contesting. This is the first Census to enumerate caste beyond the Scheduled lists since 1931.

    What is the open column method of caste enumeration?

    1. The household’s own answer is recorded: The enumerator writes the caste name as it is stated, without matching it against a list drawn up in advance.
    2. The Scheduled categories stay list based: Scheduled Caste and Scheduled Tribe communities continue to be enumerated against the corresponding Presidential lists, as has always been done.
    3. Classification is a separate, later step: The raw names collected are grouped into categories after enumeration is complete, rather than at the doorstep.

    Why were the Central and State OBC lists rejected?

    1. Several entries name something other than a caste: The lists carry entries describing occupational groups, settler groups, and a specific class of labourers.
    2. The examples cited are concrete: Officials pointed to “local borns” in the Andaman and Nicobar Islands and tea garden workers in Assam.
    3. Such entries are a minority of the lists: They sit among nearly 3,000 communities classified as OBC across the Central and State lists.
    4. The same community changes category across States: Several communities carried on OBC lists are classified as Scheduled Caste or Scheduled Tribe depending on the State.
    5. The State survey route was assessed on the same test: The problem surfaced when the government examined whether the methodology of State conducted caste surveys, such as those in Bihar and Telangana, could be replicated nationally.

    What is the objection to the open column?

    1. It yields no enumerated list of communities: OBC groups and Opposition leaders want the communities named, listed and counted specifically rather than written in freehand.
    2. The 2011 precedent is the stated worry: The Socio Economic and Caste Census of 2011 threw up over 46 lakh caste names, which critics expect an open column to reproduce.
    3. The government has used that same result before: It cited the 46 lakh names as its reason for not releasing the caste data from that exercise.
    4. The utility of the method is what is questioned: The objection is not that the count will not happen, but that its output will not be usable for policy.

    Does the government’s own record support the reason it gave?

    1. A statutory body concluded the opposite: A 2015 National Commission for Backward Classes document held that a caste can be, and quite often is, a social class in India.
    2. That document treated caste as the workable starting unit: It recorded that caste represents an existing, identifiable social group, and that an exercise can begin there and then extend to other groups, sections and classes.
    3. The choice was made at the top of the system: Officials involved in the methodology recorded that each option carried its own advantages and drawbacks, and that the open column was finalised only after the alternatives were considered at the highest levels.

    Challenges to caste enumeration through an open column

    1. Spelling and synonym variants inflate the count: One community is recorded under several names across districts, dialects and languages, and each variant enters the data as a separate entity. Eg. Bihar’s 2023 caste survey recorded 215 distinct castes because its enumerators worked from a fixed list rather than a blank field.
      The Fix: Publish a standardised State wise caste directory before enumeration and map every write-in entry to it during data processing.
    2. The classification authority is not named in advance: Grouping raw names into Backward Class and other categories is a decision taken after the count by a body the enumeration design does not identify. Eg. An expert group was constituted in 2015 to classify the caste data collected in the 2011 exercise, and that data was never released.
      The Fix: Notify the classifying authority, its composition and its publication timetable before the first form is filled.
    3. Self reported caste responds to incentive: A household may report the name that improves its standing or its eligibility rather than the one it ordinarily uses. Eg. Karnataka’s 2015 socio economic and educational survey drew objections from dominant communities over its recorded counts and stayed unpublished for years.
      The Fix: Verify a sample of write-in entries against household level administrative records before the totals are finalised.
    4. The quality of the answer rests on the enumerator: A caste question asked without a fixed probe sequence produces a sub-caste from one household and a broader cluster name from its neighbour. Eg. Census enumeration is carried out by roughly 30 lakh school teachers and government staff deployed for a few weeks.
      The Fix: Script the caste question with a mandatory probe sequence and test every enumerator on it before deployment.

    Conclusion

    The method of collection is now settled. What is not settled is who converts several lakh written answers into a list of communities, and by what rule. That step, and not the column on the form, is what decides whether the exercise produces a usable Backward Class number at all. It sits outside the methodology the government has announced, and it has no published owner.

    Back2Basics

    1. The Census is conducted under the Census Act, 1948 and the rules framed under it, which make participation compulsory and the individual returns confidential.
    2. It is carried out by the Office of the Registrar General and Census Commissioner of India, which functions under the Ministry of Home Affairs.
    3. It is decennial, and the last completed round was in 2011, the 2021 round having been deferred.
    4. The 2027 round runs in two phases, houselisting followed by population enumeration, with a reference date of 1 March 2027 and 1 October 2026 for snow bound areas.

    [2023, GS1, 15 marks] Why is caste identity in India both fluid and static?
  • Old rules, New rebels — Haryana khap panchayats vs Gen Z

    Why in the News

    Several khap panchayats, unelected community bodies dominated by elderly men from landowning communities, across north Haryana have passed resolutions banning marriage within the same gotra or khap cluster, live-in relationships and same-sex relationships, with violators to be barred from entering their villages. The resolutions followed outrage over a remark by a Naugama khap member at a meeting in Jind district, who said the phones of young women riding pillion in “unsuitable” clothing while using mobile phones should be smashed. Khap leaders describe the resolutions as guidance to preserve social cohesion, while young Haryanvis, women and men, have used social media to argue the diktats target women’s autonomy and carry no constitutional or legal standing.

    What are khap panchayats, and what have they resolved?

    1. An extra-constitutional community body: A khap panchayat is an unelected council, typically drawn from elderly men of a dominant landowning community, that claims authority over marriage, relationships and social conduct within a cluster of villages it oversees. Haryana has more than 130 such khaps.
    2. The August 9 Kandela resolution: Twenty-four khap panchayats meeting at Kandela village in Jind passed a resolution disallowing marriage within the same gotra or cluster, on the belief that members of the network are one extended social family regardless of caste.
    3. Bans on live-in and same-sex relationships: The khaps also passed resolutions against live-in and same-sex relationships and against content they consider obscene, while urging the government to regulate love marriages.
    4. No legal enforcement power: Khap members themselves acknowledge that khaps hold no legal authority. Fix. The stated penalty for disobedience, social ostracisation and exclusion from the village, is enforced through community pressure rather than any legal process.

    What triggered the current backlash?

    1. The viral remark on women’s mobility: Virender Dhull, a khap member and a school director of physical education, said at the Naugama khap meeting on August 1 that young women’s phones should be smashed if they rode pillion with legs astride while using phones or wearing clothes the khap found unsuitable.
    2. Local khap leaders disputed the characterisation: Naugama khap president Jaivir Lohan said the remark was an individual’s opinion, not a khap ban, and that parents, not the khap, should decide what is appropriate for their children.
    3. Same-gotra marriage was defended on genetic grounds: Lohan justified the ban on same-gotra marriage by citing a shared gene pool leading to genetic disorders and weak offspring, a claim not supported by the resolution’s actual social rationale of treating khap members as kin.

    How has Gen Z pushed back?

    1. Satire and direct criticism on social media: An M.A. student from Jind posted a video imagining a “Gen Z panchayat” that restricts elderly men’s card-playing and hookah use, questioning why moral scrutiny falls only on women.
    2. A generational and constitutional framing: A journalism graduate from Jind argued the diktats are illegal and violate constitutional rights, including freedom of movement, expression and privacy, and said the views of a few khap members should not be taken as representative of Haryana.
    3. The backlash cuts across gender: Content creators, including men, have criticised the khaps, though some responses have relied on derogatory personal attacks on khap members rather than constitutional argument.
    4. Data cited by critics: Commentators have linked the diktats to Haryana’s skewed sex ratio, noting the state’s Sex Ratio at Birth fell to 898 girls for every 1,000 boys in the first four months of 2026, alongside high youth unemployment.

    Challenges to khap panchayats’ authority

    1. Conflict with constitutional guarantees: Khap resolutions restricting marriage choice, mobility and relationships run against the fundamental rights to equality, personal liberty and freedom of movement. Eg. The Shakti Vahini v. Union of India (2018) ruling directed states to prevent khap panchayats from interfering with marriages between consenting adults. Fix. State governments should operationalise the safe-house and police-protection directions already laid down in that ruling rather than reacting only after a controversy goes viral.
    2. Exclusion of women from decision-making: Khap leadership remains almost entirely male; the Naugama khap’s 42 members are all men. Eg. Women were first elected as sarpanches in Haryana only in the 1980s, decades after khaps themselves had been functioning. Fix. Institutionalise the recently convened women-led mahapanchayats as standing bodies with actual resolution-making power, rather than as one-off gatherings.
    3. Selective moral policing: Restrictions target women’s clothing, mobility and phone use, while comparable scrutiny is not applied to men’s conduct, including drug use and crime among Haryana’s male youth. Eg. Critics have pointed out that no khap resolution has targeted male youth involved in drug abuse or crime, even as such resolutions are passed against women’s dress and mobility.

    Conclusion

    The wave of khap resolutions has sharpened a long-running collision in Haryana between a community-based order that claims authority over marriage and relationships and a legal system built around individual rights, now amplified by a socially connected Gen Z that is contesting these diktats openly online. The khaps have no legal power to enforce their rulings, but social ostracisation remains a real cost for those who defy them, leaving the underlying tension between custom and constitutional right unresolved.

    Back2Basics

    Gotra: A patrilineal clan or lineage group traditionally believed to descend from a common ancestor; marriage within the same gotra is customarily prohibited in parts of north India, the belief the Kandela resolution draws on.

      (GS2-07, 2015, 12.5 marks) Discuss critically the actions taken by the legislative, executive and the judiciary to set the things right in this regard.”

    1. Rules at tribal hostels undermining dignity of students, says Rahul Gandhi

      Why in the News

      The Leader of the Opposition, Rahul Gandhi, raised concerns over conditions at government tribal hostels, known as Ashram Shalas, in Maharashtra and Madhya Pradesh, citing hunger strikes by students and reported malnutrition and snakebite deaths at a hostel in Gadchiroli. Ashram Shalas are residential schools set up specifically to house tribal students, often from remote forested areas, so they can access schooling that would otherwise require an impractical daily commute. Reports of hunger strikes and deaths at these hostels raise the question of whether the facilities meant to widen tribal access to education are instead exposing students to conditions that undermine their basic dignity and safety.

      What specific conditions have been raised at the hostels?

      1. Hunger strikes reported by students: Students at tribal hostels in Maharashtra and Madhya Pradesh have gone on hunger strikes to protest hostel conditions, an extreme form of protest by residents that itself signals that ordinary grievance channels were not working.
      2. Malnutrition deaths reported at a Gadchiroli hostel: Deaths attributed to malnutrition among students at a hostel in Gadchiroli, a tribal-majority district in Maharashtra, point to a failure in the hostel’s food quality or quantity standards.
      3. A snakebite death reported at the same hostel: A student death from snakebite at the Gadchiroli hostel points to inadequate hostel infrastructure and the absence of timely medical evacuation in a forested, remote location.
      4. Concerns framed as a dignity issue, not only a facilities issue: The complaint frames the hostel rules themselves, not merely infrastructure gaps, as undermining student dignity, pointing to disciplinary or restrictive practices inside the hostels as part of the problem.

      Why do tribal hostels carry this specific set of risks?

      1. Remote locations limit emergency response: Ashram Shalas are deliberately located in or near tribal habitations, which are often in forested, hard-to-access terrain where the nearest primary health centre may be hours away, turning a treatable snakebite into a fatality.
      2. Chronic underfunding of hostel messing and staffing: Tribal welfare hostels are frequently reported to run on messing grants that have not kept pace with food costs, and with warden-to-student ratios too thin to catch early signs of malnutrition or illness.
      3. Weak grievance redress inside a residential, closed setting: Students living inside the hostel have limited means to escalate a complaint beyond the hostel’s own staff, which is part of why a hunger strike, rather than a formal complaint, became the mode of protest.

      Conclusion

      The Leader of the Opposition’s intervention puts political attention on a welfare infrastructure gap that had, until the hunger strikes and deaths came to light, received limited scrutiny. Whether the State governments of Maharashtra and Madhya Pradesh respond with an audit of hostel messing, staffing and medical-evacuation arrangements will determine if this becomes a one-time political exchange or a lasting reform.

      Back2Basics: Ashram Shalas

      1. Residential schools established specifically for children from Scheduled Tribe communities, run by State tribal welfare departments with central assistance under centrally sponsored schemes for tribal education.
      2. Intended to widen access to schooling for tribal children in remote, forested habitations where a daily commute to a regular school is not feasible.
      3. Provide free boarding, lodging and schooling, funded through State messing and infrastructure grants supplemented by central tribal welfare allocations.
      4. Have periodically drawn scrutiny over understaffing, poor food quality, and inadequate health and safety infrastructure.

      Matching Previous Year Question

      “[2025, GS1, 15 marks] Does tribal development in India centre around two axes, those of displacement and of rehabilitation? Give your opinion.”

    2. Count caste by all means, but abandon the belief that counting settles anything

      Why in the News

      Survey evidence shows the recorded Other Backward Class share of India's population rising at a rate no human fertility can produce, which points to reclassification rather than births. The finding shifts the caste census debate from the design of the question to the incentives the question creates, since a self declared category that carries an entitlement will be answered strategically.

      What is the fertility test for auditing a group's growth?

      1. The logic: A group's population can rise only through births exceeding deaths, through migration, or through people newly identifying with it, so an implausible growth rate isolates reclassification as the cause.
      2. The demographic fingerprint: Fertility leaves a mark on the age structure, because a group growing through births must be over represented among children relative to adults.
      3. The diagnostic that follows: Where a group's share rises among adults as fast as among children, the growth is not coming from births, since adults are not born.
      4. Why it is decisive: The test needs no assumption about honesty, only the arithmetic relationship between fertility, age structure and growth.

      What is the Hutterite fertility benchmark?

      1. Who they are: The Hutterites are an Anabaptist community of the North American plains who married early, used no contraception, and had good nutrition and medical care.
      2. Why they are the benchmark: Their total fertility rate of 10.9 children per woman is treated as the outer limit of human fertility, and their population growth from 443 in 1880 to 8,542 by 1950, a rate of 4.32 percent a year, is the ceiling against which any other group's growth is indexed.

      What is the NSS and PLFS caste share series?

      1. What the surveys are: The National Sample Survey (NSS) and its successor, the Periodic Labour Force Survey (PLFS), are the government's large sample household surveys, which record the social group each household reports itself as belonging to.
      2. Why the series matters: These surveys are the only continuous national record of self reported caste category shares between censuses, so the trend in the OBC share is read from them.

      Why do the recorded OBC numbers imply impossible growth?

      1. The starting point: In 1999-2000, 35.7 percent of Indians said they were Other Backward Class.
      2. Five years on: By 2004-05, 40.9 percent did, while India's population grew at 1.8 percent a year.
      3. The implied rate: The OBC population moved from 357 million to 447 million in five years, a growth rate of 4.6 percent a year.
      4. The mirror movement: The General category, meaning those who are neither OBC nor Scheduled Caste nor Scheduled Tribe, fell from 359 million to 342 million, shrinking at 0.95 percent a year.
      5. Above the human ceiling: A rate of 4.6 percent a year exceeds the Hutterite rate of 4.32 percent, so on the survey evidence India's OBCs out reproduced the outer limit of human fertility.
      6. Not a five year aberration: Between 1999 and 2025 the OBC population nearly doubled, from 357 million to 674 million, while the General category shrank from 359 million to 350 million.
      7. The share of all growth: India added 456 million people over those 26 years, so a group that was 36 percent of the country in 1999 accounted for 70 percent of every person added since.

      What does the age structure show?

      1. The 2004 gap: The OBC share among children under 15 exceeded the OBC share among adults by just 2.0 percentage points.
      2. The 2025 gap: That gap had narrowed to 1.2 percentage points, even as the OBC share climbed a further five points.
      3. What real growth would look like: At Hutterite fertility, OBCs would account for three quarters of all births and be over represented among children by more than 30 percentage points.
      4. Even at a lower fertility: A total fertility rate of six would still require an over representation of 20 percentage points.
      5. A genuine differential for comparison: Muslims, who do have higher fertility, were over represented among children by 3.2 points in 2004, widening to 4.3 by 2025.
      6. The conclusion the data force: The OBC share is rising almost as fast among adults as among children, which is the signature of reclassification, not of births.

      Why would households reclassify?

      1. The entitlement attached to the answer: India allocates reserved places in education and public employment on the basis of caste category, so the category recorded carries a measurable benefit.
      2. The answer is self chosen: A survey or census question that asks for the category invites the respondent to select her own entitlement rather than state a fact about herself.
      3. No dishonesty is required: The claim is not about the honesty of Indians, it is the standard proposition that people respond to incentives.
      4. The response is invisible to the rule maker: Those who design the classification rarely observe the behavioural response the classification produces.
      5. The result for the data: The recorded category becomes a measure of the incentive structure rather than a measure of the population.

      What does the Christian and Sikh comparison show?

      1. The fertility baseline: Christians have the highest female education in India and among the lowest fertility, at 2.4 children per woman, against 2.8 for Hindus and 3.6 for Muslims on the 1998-99 National Family Health Survey.
      2. The only lower group: Sikhs were lower still, at 2.3 children per woman.
      3. What Sikhs did: Between 1991 and 2011 Sikhs grew at 1.2 percent a year, exactly as their fertility predicts.
      4. What Christians did: With virtually the same fertility, Christians grew at 1.9 percent a year, faster than Hindus and matching the national average.
      5. The arithmetic mismatch: Achieving that growth demographically would need a fertility rate near 3.3, not the recorded 2.4.
      6. The incentive behind it: A Christian of backward caste origin can sit on State and central OBC lists and claim reservation while simultaneously holding notified minority status with the institutional protections of Article 30, under which minority institutions set their own admissions and are exempt from quota obligations.
      7. The limit on that position: What such a person cannot claim is Scheduled Caste status, which is why the incentive runs towards the OBC and minority combination.
      8. The separate question: Whether that double classification is an anomaly or a form of justice is a distinct argument, but that it creates an incentive is not arguable.

      Where else does the same incentive logic appear?

      1. Capital leaving: Indian promoters sent a record 33.3 billion dollars abroad last year while domestic private investment stagnated.
      2. Investment falling: Net foreign direct investment has fallen to 0.18 percent of gross domestic product.
      3. The usual explanation rejected: The outcome is attributed to a failure of animal spirits, with appeals to industrialists to invest at home, though no participant is behaving badly.
      4. The dispute resolution cost: A firm choosing between a factory in India and one abroad faces a bilateral investment treaty requiring 60 months in Indian courts before arbitration can begin.
      5. The compliance cost: It faces 765 Quality Control Orders, against 14 in 2014.
      6. The market access cost: It faces no trade agreement with the United States, the market that absorbs 42 billion dollars of Indian exports.
      7. The common explanation: The firm responds exactly as the incentives instruct, and so do the households that discovered they were OBC in 2004.

      Does counting caste settle what it is meant to settle?

      1. The case for counting: India allocates education and employment on caste, so the state must know the distribution it is allocating against.
      2. What counting cannot do: A count of a self declared category measures the response to an entitlement, not the underlying social structure.
      3. The prior diagnosis it revises: An earlier commentary held that the caste census had been killed by the technical choice of an open ended question, which in 2011 produced 4.7 million caste names, and proposed a dropdown menu in its place.
      4. Why a dropdown is not the fix: Confusion about caste names is not the binding problem, the incentive attached to the category is, and a cleaner menu does not remove it.
      5. The tension stated plainly: The exercise must be conducted and its result must not be treated as settling the question of who is backward.

      How should the caste question be designed instead?

      1. Ask for the fact, not the entitlement: Ask for caste, sub caste and surname, and never for the category, so the respondent is not invited to choose her own entitlement.
      2. Move the classification downstream: Let the statistical office, with professional sociologists rather than commentators, map the responses to categories after enumeration.
      3. Publish the microdata: Release the unit level records so the mapping and its consequences can be independently checked.
      4. Audit every count against fertility: Test each group's recorded growth against the fertility its own surveys report, since a group whose growth requires Hutterite fertility has not grown.
      5. Treat the result as evidence, not verdict: Use the count as one input into allocation decisions rather than as a settlement of the claim to backwardness.

      Challenges to relying on self reported caste data

      1. The category is self selected: A question that offers the reservation category records the choice, not the identity. e.g. the OBC share rose 5.2 percentage points between 1999-2000 and 2004-05 with no corresponding change in the age structure.
      2. The age structure test is not applied: Statistical offices publish category shares without checking them against the fertility those shares would require. e.g. an OBC growth rate of 4.6 percent a year exceeds the Hutterite ceiling of 4.32 percent and was published unremarked.
      3. Multiple classifications can be held at once: A person can hold benefits flowing from two separate classifications simultaneously. e.g. a Christian of backward caste origin can hold OBC listing along with minority status protected by Article 30.
      4. State lists differ from the central list: The same community may be backward in one jurisdiction and not in another, so a national count is not additive. e.g. the 105th Constitutional Amendment, 2021 was enacted to restore the States' power to maintain their own backward class lists.
      5. Microdata is withheld: Without unit level records, no independent check on the classification is possible. e.g. the raw caste data of the 2011 Socio Economic and Caste Census were never released.
      6. Counting raises the stakes of the count: Publication of group shares immediately becomes an argument for revising quota percentages. e.g. State caste surveys have been followed by demands to raise reservation beyond the 50 percent ceiling.
      7. Survey and census definitions diverge: Survey social group codes and census caste entries are not the same instrument, so the two series cannot be spliced. e.g. the NSS records four social group codes while the Census will record open ended caste names.

      Conclusion

      The recorded growth of India's Other Backward Classes is arithmetically impossible as a demographic event and is explicable only as reclassification in response to entitlement. The same logic explains the Christian growth rate that fertility cannot support and the investment that leaves a jurisdiction charging 60 months of litigation and 765 Quality Control Orders. Counting caste is still necessary, because the state allocates on caste and must know what it is allocating against. What must be abandoned is the belief that the count settles the question, since a self declared count measures the incentive as much as the population.

      What are the Other Backward Classes?

      1. About: Other Backward Classes are communities identified by the state as socially and educationally backward, distinct from the Scheduled Castes and Scheduled Tribes, and entitled to reservation in education and public employment.
      2. Rationale: The category exists to extend substantive equality to groups whose backwardness arises from social and educational disadvantage rather than from untouchability or geographical isolation.
      3. The identification test: Backwardness is determined on social, educational and economic indicators, with caste permitted as a starting point but not as the sole criterion.
      4. The named typology in use:
      5. Central List: Maintained by the Union government for reservation in central government posts and central educational institutions, now referenced by Article 342A.
      6. State Lists: Maintained by each State for its own posts and institutions, with membership frequently differing from the Central List.
      7. Creamy layer: The economically advanced section within an OBC household, excluded from reservation, with the income and status criteria revised periodically.
      8. The reservation quantum: 27 percent of central government posts and central educational institution seats are reserved for non creamy layer OBCs.

      Key Concerns Regarding the Other Backward Classes Framework

      1. Absence of an authoritative count: No caste wise population figure for OBCs has been published since 1931, so the 27 percent quantum rests on an estimate rather than a count.
      2. Unequal distribution within the category: A small number of dominant communities capture a disproportionate share of reserved places, which is the basis of the sub categorisation demand.
      3. Self declaration and the creamy layer: Creamy layer exclusion relies on income and status certificates whose verification is weak, so the exclusion is imperfectly enforced.
      4. Pressure on the 50 percent ceiling: Successive State enactments raising total reservation above the ceiling laid down in Indra Sawhney have been struck down, leaving the demand unresolved.
      5. Confusion between category and caste: Administrative records capture the reservation category rather than the community, which prevents any assessment of which communities the benefit actually reaches.
      6. Federal friction over list making: The power to identify backward classes moved between the Union and the States through the 102nd and 105th Constitutional Amendments, leaving two parallel lists in operation.

      Constitutional Provisions Related to Caste Based Classification

      1. Article 15(4): Enables the State to make special provision for socially and educationally backward classes and for Scheduled Castes and Scheduled Tribes.
      2. Article 15(5): Enables reservation in admission to private educational institutions, aided or unaided, excluding minority institutions.
      3. Article 15(6) and Article 16(6): Inserted by the 103rd Constitutional Amendment, 2019, providing 10 percent reservation for economically weaker sections.
      4. Article 16(4): Enables reservation in appointments for any backward class not adequately represented in State services.
      5. Article 16(4A) and 16(4B): Provide for reservation in promotion with consequential seniority for Scheduled Castes and Scheduled Tribes, and for carrying forward unfilled reserved vacancies.
      6. Article 30: Guarantees minorities the right to establish and administer educational institutions of their choice, the provision that exempts minority institutions from quota obligations.
      7. Article 335: Requires that claims of Scheduled Castes and Scheduled Tribes be considered consistently with the maintenance of efficiency of administration.
      8. Article 338B: Establishes the National Commission for Backward Classes as a constitutional body, inserted by the 102nd Constitutional Amendment, 2018.
      9. Article 340: Empowers the President to appoint a Commission to investigate the conditions of socially and educationally backward classes.
      10. Article 342A: Provides for the Central List of socially and educationally backward classes, with the 105th Constitutional Amendment, 2021 restoring the States' power to maintain their own lists.

      Commissions and Official Initiatives on Backward Classes

      1. Kalelkar Commission, 1953: The first Backward Classes Commission appointed under Article 340, whose report was not acted upon by the Union government.
      2. Mandal Commission, 1979: The second Backward Classes Commission, which reported in 1980 and recommended 27 percent reservation for OBCs, implemented from 1990.
      3. National Commission for Backward Classes: Set up in 1993 following the Indra Sawhney judgment, given constitutional status in 2018 by the 102nd Constitutional Amendment.
      4. Rohini Commission, 2017: Appointed under Article 340 to examine sub categorisation of OBCs within the 27 percent quota, so that benefits are distributed more evenly across communities.
      5. Creamy layer income ceiling revisions: Periodic revisions by the Department of Personnel and Training of the income and status criteria that exclude the advanced section within OBCs.
      6. National Family Health Survey and Periodic Labour Force Survey: The two national survey instruments that carry social group identifiers and are the source of the caste category share series between censuses.

      Key Facts about Caste, Reservation and Fertility Data

      1. The 50 percent ceiling on total reservation was laid down in Indra Sawhney v Union of India (1992), which also introduced the creamy layer exclusion for OBCs.
      2. 27 percent is the OBC reservation in central government posts and central educational institutions, and 10 percent is the economically weaker sections quota introduced in 2019.
      3. 1931 was the last Census whose caste data were released, recording 4,147 castes.
      4. Replacement level fertility is a total fertility rate of about 2.1 children per woman, the level at which a generation exactly replaces itself once child mortality is accounted for.
      5. India's total fertility rate fell to 2.0 in the fifth National Family Health Survey, 2019-21, below replacement level.
      6. Total fertility rate is the average number of children a woman would bear over her lifetime at prevailing age specific fertility rates, which is why it is comparable across groups of different age structures.

      Challenges in Caste Based Affirmative Action

      1. No current population base: Quotas are fixed against estimates rather than an enumerated caste population. e.g. the 27 percent OBC quota rests on the Mandal Commission's estimate derived from the 1931 Census.
      2. Unequal capture within categories: A few communities within a category take most of the reserved places. e.g. the Rohini Commission was appointed in 2017 precisely because benefits within the OBC quota were found to be concentrated.
      3. Creamy layer enforcement: Income and status certificates are issued without effective verification, so the excluded section is not consistently excluded. e.g. repeated departmental instructions have been issued on the correct computation of the creamy layer income ceiling.
      4. Litigation over the ceiling: State laws raising reservation above 50 percent are struck down, leaving political demands unmet and entitlements unstable. e.g. the Maratha reservation enactment was set aside by the Supreme Court in 2021 for breaching the ceiling.
      5. Reservation without expansion of opportunity: The quota redistributes a shrinking pool of public sector posts rather than creating new ones. e.g. government employment has grown far more slowly than the number of aspirants competing in public examinations.
      6. Category based data collection: Administrative systems record the reservation category rather than the community, so outcomes by community cannot be measured. e.g. no published dataset shows which OBC communities occupy the reserved posts filled each year.
      7. Minority institution exemption: Institutions covered by Article 30 stand outside the quota framework, which creates unequal obligations across comparable institutions. e.g. minority educational institutions set their own admissions and are exempt from the reservation applied to other aided institutions.

      Back2Basics: Mandal Commission

      1. Formal name: The Second Backward Classes Commission, appointed in 1979 under Article 340 of the Constitution.
      2. Chairperson: Headed by B. P. Mandal, from whom the Commission takes its name.
      3. Report submitted: Reported in 1980, recommending 27 percent reservation for Other Backward Classes in central government services and public sector undertakings.
      4. Basis of its estimate: Estimated the OBC share of the population at about 52 percent, extrapolating from the 1931 Census, since no later caste count existed.
      5. Method of identification: Used eleven indicators grouped under social, educational and economic heads to identify backwardness, with social indicators weighted highest.
      6. Implementation: Recommendations were implemented for central government posts from 1990 and extended to central educational institutions by the 93rd Constitutional Amendment, 2005.
      7. Judicial outcome: Upheld in Indra Sawhney v Union of India (1992), which fixed the 50 percent ceiling, excluded the creamy layer, and barred reservation in promotions for OBCs.

      Way Forward

      1. Record community, not category: Design the schedule to ask for caste, sub caste and surname and leave category mapping to the statistical office.
      2. Publish unit level microdata: Release anonymised records so the classification and its consequences can be independently verified.
      3. Institutionalise the fertility audit: Require the statistical office to publish, alongside every group share, the fertility rate that the recorded growth would require.
      4. Reconcile survey and census series: Align social group codes in the National Sample Survey and the Periodic Labour Force Survey with the Census code frame so the two series are comparable.
      5. Complete sub categorisation: Act on the sub categorisation exercise so the benefit is distributed within the OBC category rather than captured by dominant communities.
      6. Verify creamy layer certification: Link income and status certificates to tax and employment records so the exclusion is enforced rather than declared.
      7. Separate the count from the quota decision: Treat the enumeration as an evidence gathering exercise, with quota revision decided through the constitutional process rather than triggered automatically by the count.

      Matching Previous Year Question

      “[2023, GS1, 15 marks] Why is caste identity in India both fluid and static?”

    3. How India plans to count caste now, and what went wrong earlier

      Why in the News

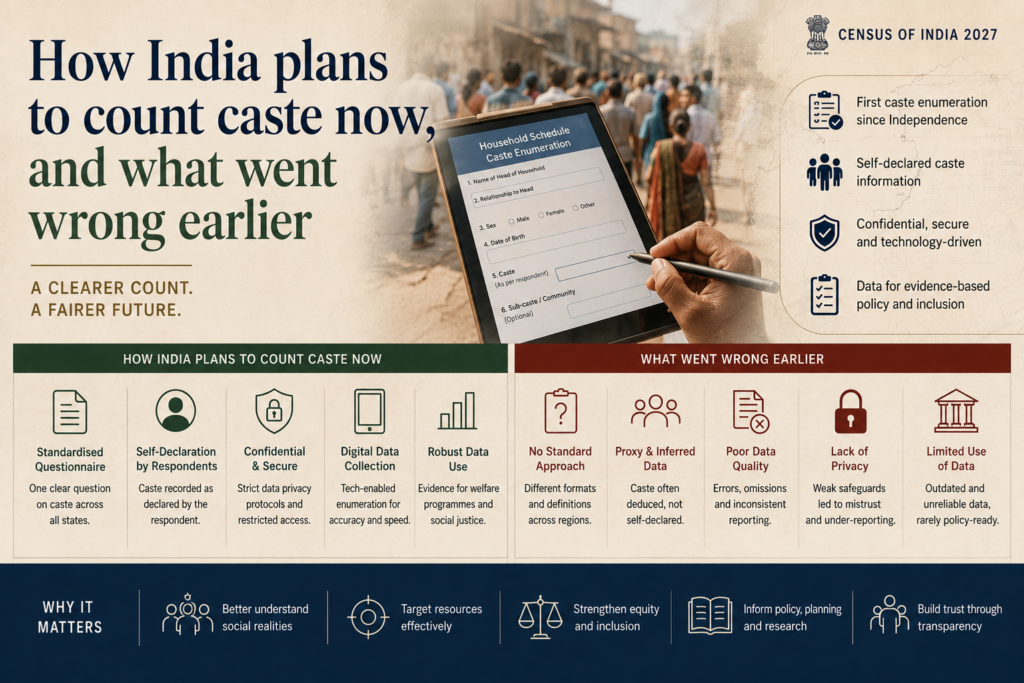
      The Registrar General of India has settled on an open ended question on caste for the ongoing Census, with no predetermined list of castes supplied to the enumerator. The same method in 2011 returned nearly 46.7 lakh distinct caste names and produced no usable table, which places the design of the question, rather than the decision to count, at the centre of the exercise.

      What is an open ended caste question?

      1. How it works: The respondent states a caste in their own words and the enumerator records that answer as given, with no dropdown list or code frame to select from.
      2. No verification step: The enumerator is duty bound to enter what is stated, including a surname offered in place of a caste name.
      3. Errors become data: A misspelling of the stated name becomes an entry in the caste column in its own right.
      4. The colonial precedent: The same open method was used until the 1931 Census, the last census whose caste data were released.

      Why does an open ended question produce unusable data?

      1. Interchangeable names for one group: Rajput, Thakur, Singh and Kshatriya may be used interchangeably by the same respondent for the same identity.
      2. The same name meaning different groups: Rajput in the Bundelkhand region cutting across Uttar Pradesh and Madhya Pradesh may also refer to the Other Backward Class Lodh community.
      3. Surnames that cross categories: Singh is a surname running across castes and across reservation categories, so it identifies nothing on its own.
      4. Volume without structure: The result is a very large number of entries that may all belong to a single caste, with no rule for collapsing them afterwards.
      5. The 2011 outcome: The open method returned nearly 46.7 lakh distinct caste names, against the 4,147 castes recorded in the last comprehensive caste census of 1931.

      What did the 1931 Census reveal about counting caste?

      1. Caste as a subjective category: The 1931 Census report itself recorded the difficulty of enumerating caste once respondents were free to name their own.
      2. New identities appearing between rounds: Sections of the leather working caste among Dalits in Punjab assumed a new religious identity as Aad Dharmis, meaning people of the original, pre Aryan religion of India.
      3. The scale of that shift: 418,789 persons enumerated themselves as Aad Dharmis, roughly the same number as Christians in Punjab at that time, in a category that did not exist in 1921.
      4. The pattern was not local: Similar names appeared in other regions, including Adi Dravida, Adi Andhras and Adi Karnatakas.
      5. Consolidation to bolster numbers: The report recorded grazier castes combining under the term “Yadava” the Ahirs, Goalas, Gopis, Idaiyans and other milkmen castes, a movement already effective in 1921.
      6. What both moves show: Caste counts respond to claims of new social status and to the arithmetic advantage of a larger group, not only to who people are.

      How did caste enumeration lapse after 1931?

      1. 1941: Caste details were collected but caste was dropped from the final tabulation.
      2. 1951: The government led by the first Prime Minister decided there would be no caste enumeration, in a newly independent India shaped by the ideals of equality and secularism.
      3. 2011: The Socio Economic and Caste Census conducted under the then government failed to produce usable caste data because of open ended enumeration.
      4. The data withheld: The Union government eventually withheld the raw caste data from the 2011 exercise.

      What did the Bihar caste survey show about using a list?

      1. The exercise: A statewide caste survey was ordered by the then Chief Minister of Bihar in 2023.
      2. The administrative choice made: State officials compiled a list of castes for the purpose, on the view that enumerating without a list would create an administrative nightmare.
      3. The contest that followed: Questions were raised after the data were released about how the lists were prepared and about the methodology used.
      4. What it establishes: A list makes tabulation possible and simultaneously makes the list itself the contested object, since inclusion and placement decide entitlement.

      What alternative design do experts propose?

      1. A predetermined list: A former chairman of the Indian Council of Social Science Research, who was a member of the expert committee on Telangana’s caste data, holds that a predetermined list is necessary.
      2. Building on lists that already exist: Scheduled Caste, Scheduled Tribe and Other Backward Class lists are already recognised by the government, so only a similar list of castes in the general category is needed for the list to be exhaustive.
      3. The error trade off: Such a list may still carry a margin of error of about 2 to 3 percent, which is smaller than the error produced by open ended enumeration.
      4. Columns for non identification: Separate columns for “no caste” and “no religion” are needed for people who do not identify with either.
      5. Separate questionnaires by group: Distinct questionnaires are proposed for Scheduled Castes and Scheduled Tribes, because the exclusion each faces differs, untouchability related for the former and physical and geographical isolation for the latter.
      6. No separate schedule for Other Backward Classes: A separate questionnaire is held to be unnecessary for OBCs, since social and educational backwardness would be captured by the Census exercise anyway.
      7. Questions on internal hierarchy: A Valmiki community activist campaigning for sub categorisation holds that the schedule must ask about hierarchies and exclusions within the Scheduled Castes and Scheduled Tribes, since some castes within them are more deprived than others.

      How many caste groups does the state already recognise?

      1. Scheduled Castes: The Ministry of Social Justice and Empowerment lists 1,208 Scheduled Castes, with different castes appearing in the category in different States.
      2. Scheduled Tribes: A Press Information Bureau year end release of 2022 lists exactly 730 Scheduled Tribes.
      3. What the two lists prove: A workable, State specific enumeration frame already exists for the reserved categories, which is why the general category is the only gap in a list based design.
      4. The residual problem: The lists are State specific, so a single national code frame still has to reconcile the same caste appearing in different categories across States.

      Challenges to caste enumeration in the Census

      1. Self declaration cannot be verified: No enumerator can test a stated caste against any record, so the count is a record of claims. e.g. the 1931 appearance of 418,789 Aad Dharmis in Punjab was a reclassification, not a demographic change.
      2. Category and caste are conflated: Respondents answer with a reservation category rather than a caste, which destroys the disaggregation the exercise exists to produce. e.g. an entry of “OBC” or “General” tells the statistical office nothing about the specific community.
      3. State specific lists break national aggregation: The same caste name sits in different categories in different States. e.g. a community listed as OBC in one State appears in the general category in a neighbouring one, so a national total is not additive.
      4. Political stakes shape the answer: Enumeration takes place while reservation and sub categorisation demands are live, which gives groups a reason to consolidate. e.g. the Yadava consolidation of Ahirs, Goalas, Gopis and Idaiyans recorded in 1931 combined several castes into one larger head.
      5. Enumerator discretion at the point of entry: With no code frame, spelling, phrasing and abbreviation decisions rest with the field functionary. e.g. a misspelt surname entered as a caste becomes a distinct caste in the final dataset.
      6. Publication risk: Caste tables invite legal and political contest, which creates an incentive to withhold rather than release. e.g. the raw caste data of the 2011 exercise were never published.
      7. Sub caste invisibility: A single caste head hides sharp deprivation differences within it. e.g. sub categorisation demands within the Scheduled Castes rest on the claim that a few communities capture most of the benefit.

      Conclusion

      The choice of an open ended caste question repeats the design that failed in 2011 and that the 1931 report had already flagged as unstable. A predetermined list built on the existing Scheduled Caste, Scheduled Tribe and Other Backward Class rolls, extended to the general category, is the correction experts have placed on record, along with separate questionnaires for Scheduled Castes and Scheduled Tribes and questions on internal hierarchy. The self enumeration window is currently open, so the question design is close to being frozen. Whether the exercise yields a usable caste table will be settled by the code frame, not by the decision to count.

      “[2009] Consider the following statements:

      1. Between Census 1951 and Census 2001, the density of the population of India has increased more than three times.

      2. Between Census 1951 and Census 2001, the annual growth rate (exponential) of the population of India has doubled.

      Which of the statements given above is/are correct?

      (a) 1 only

      (b) 2 only

      (c) Both 1 and 2

      (d) Neither 1 nor 2

    4. Three girls die of a krait bite in a Gadchiroli ashram school, triggering a third party audit of all 513 private aided residential tribal schools in Maharashtra

      Why in the News

      A common krait entered the girls’ dormitory of a private aided Ashram School at Japtalai in Dhanora taluka of Gadchiroli district, Maharashtra, on the night of 9 and 10 August, bit six girls aged 8 to 14 and killed three. The deaths expose how a residential school built to carry tribal children out of poverty had neither the beds and nets to prevent the bite nor the road and ambulance to survive it.

      What is an Ashram School?

      1. About: An Ashram School is a residential school for Scheduled Tribe children, providing free education, boarding and lodging, run either directly by a State tribal development department or by a private body on government aid.
      2. Purpose: They exist because tribal habitations are scattered across remote forest hamlets where a day school is not viable. e.g. most children on the rolls of the Japtalai school come from Etapalli, a village at least five hours away by road.
      3. Funding route: Central support flows largely through grants in aid under Article 275(1) of the Constitution and through State tribal sub plan funds.

      What is a common krait?

      1. About: The common krait is a nocturnal, highly venomous snake of the Elapidae family and one of India’s Big Four venomous species, alongside the Indian spectacled cobra, Russell’s viper and the saw scaled viper.
      2. Why the bite goes unnoticed: Its venom is neurotoxic, attacking the nervous system, and its bite feels like a mosquito bite with fang marks often impossible to locate. Treating clinicians place it at at least ten times more venomous than the king cobra.

      What is anti snake venom and why does timing decide survival?

      1. About: Anti snake venom (ASV) is an antibody preparation that neutralises circulating venom, and India uses a polyvalent formulation raised against the Big Four species.
      2. The golden hour: The effective window for administering ASV is about half an hour after the bite. Beyond it neurotoxic paralysis of the respiratory muscles progresses even after the correct dose is given.

      What happened at the Japtalai Ashram School?

      1. The dormitory: Anu Koreti, aged 8, and 111 other girls from Classes 1 to 10 were sleeping on the floor of a hall measuring about 850 square feet when the krait entered.
      2. The bite: The snake bit six girls aged between 8 and 14. Three died and three survived.
      3. The alarm: The snake coiled around the leg of a fourth child, who woke screaming, and the children woke the cook. The cook struck the snake with a stick and called the peon, the only school employee on campus, who killed it.
      4. The transport: The first two girls reached Dhanora Rural Hospital, 9 km away, at about 2.20 a.m. in a vegetable delivery van. Three more arrived at 2.40 a.m., and over 12 panicked girls were taken directly to Gadchiroli.
      5. The deaths: Two girls were declared dead at about 4.10 a.m. after all protocol doses and cardiopulmonary resuscitation. The 8 year old died on the way to Gadchiroli’s main hospital after referral for ventilator support.
      6. The survivors: One girl was airlifted to Nagpur and is home recovering, one remains on ventilator support at Gadchiroli but out of danger, and one is recovering.

      What do the hostel’s living conditions reveal about residential school standards?

      1. Sleeping arrangements: Over 100 girls slept on mattresses on the floor with no beds. The only bed in the hall belonged to the cook, a contractual worker.
      2. No mosquito nets until after the deaths: Nets were fitted only afterwards, and the cook states the demand had been raised repeatedly in the past with no response.
      3. Snake habitat at the window: Piles of bricks and wooden logs stood next to open windows and were removed only after the incident. Moist, cool wood is the most conducive environment for a krait.
      4. Supervision gap: The school’s woman supervisor had allegedly gone on leave without the principal’s approval, which is why the cook was sleeping with the girls that night. She is absconding after a first information report for negligence.
      5. Scale against space: The campus is about half a football field, with a two storied classroom block and a separate building of halls, holding 233 enrolled children.

      Why did the emergency response fail?

      1. The unusable highway: The 9 km stretch on National Highway 930 was so potholed it was unmotorable, forcing a 35 km detour and consuming the ASV golden hour.
      2. No ambulance: The first children were moved in a vegetable delivery van, since the school had no ambulance and no accessible emergency medical service.
      3. Delayed information to parents: A peon reached one father at 9 a.m., hours after the death, and did not tell him his daughter had died. He learnt it from a policeman outside the post mortem room.
      4. Referral without capacity assessment: The 8 year old was referred onward for ventilator support even though the rural hospital had a ventilator, and she died in transit.
      5. Seasonal isolation as a standing condition: Residents state the same highway stretch stays shut for three months every monsoon and the State bus service is suspended annually on that stretch.
      6. The official position: The district Collector’s position is that responding quickly and bringing children in during an emergency is the school’s responsibility.

      Why is Gadchiroli particularly exposed to snakebite?

      1. Forest cover: Gadchiroli is Maharashtra’s easternmost district with dense forest cover of over 75 percent and a scattered tribal population across remote hamlets.
      2. Reptile diversity: The dry deciduous forests and river basins of Gadchiroli and neighbouring Chandrapur support over 21 species of snakes, including all four of the Big Four venomous species.
      3. The mortality record: 99 people have died of snakebite in Gadchiroli in the last five years.
      4. Development profile: The district was earlier part of the Red Corridor and remains among the most underdeveloped and remote parts of the State, with the Chief Minister as its guardian minister.

      What has the State done in response?

      1. Criminal action: Separate first information reports have been registered against five persons, including the former Member of Parliament who ran the school, under several bailable sections.
      2. Licence cancellation: The State government has said the school’s licence will be cancelled.
      3. Systemwide audit: A third party has been appointed to audit all 513 private aided residential tribal schools in Maharashtra.
      4. Physical fixes: Mosquito nets have been fitted and the brick and log piles near the windows have been cleared.
      5. Road repair on ministerial visit: Contractors were called overnight to patch the road with gravel once ministers announced visits, after years of complaints produced nothing.

      Why does closing the school not solve the problem for these families?

      1. All children are now home: All 233 enrolled children have returned to their villages, with the academic year interrupted.
      2. No affordable alternative: Parents who work as farm labour say they cannot afford schools that require them to buy books and uniforms, so closure ends schooling rather than relocating it.
      3. The parents’ demand: Parents are asking the government to provide facilities in the same school and let it function rather than shut it down.
      4. Access was already fragile: One parent reports her daughter has lost three months of school every year for the last two years because the road is unusable in the monsoon.
      5. What the school represented: For two generations of Gonds, a Scheduled Tribe, the school was the only route out of poverty, and the 8 year old who died wanted to become an Anganwadi Sevika.

      What does the wider ashram school record show?

      1. Scale of the system: Maharashtra runs 1,056 ashram schools for tribal children, of which 513 are private and aided.
      2. The death toll: Opposition leaders cite reports that 584 students have died in these schools in the past two years, with the education system described as obsolete.
      3. Accountability inversion: The project officer whose lapse is alleged to have led to the incident is the complainant in the case, which is the specific objection raised against the State’s response.
      4. Supervision of quality: The demand is for action against senior government officials responsible for overseeing the quality of these schools, not only against school staff.

      Challenges to the Ashram School system

      1. Overcrowded residential infrastructure: Dormitory space is allotted by headcount rather than by norm, so basic safety fails. e.g. over 100 girls from Classes 1 to 10 sleeping on the floor of an 850 square feet hall at Japtalai.
      2. Absent or unqualified wardens and supervisors: Residential care depends on a single staff member who may be absent without sanction. e.g. the woman supervisor at Japtalai who left on unapproved leave, leaving a contractual cook in charge overnight.
      3. No emergency medical linkage: Schools in remote blocks have no ambulance, no tie up with a rural hospital and no protocol for night emergencies. e.g. children carried to Dhanora Rural Hospital in a vegetable delivery van.
      4. Road connectivity failure in the monsoon: Physical access collapses for months every year, breaking both schooling and emergency evacuation. e.g. National Highway 930 between Dhanora and Japtalai, which is motorable in adjoining Chhattisgarh but not on the Maharashtra stretch.
      5. Weak inspection and grant conditionality: Aid continues without verified compliance with hostel norms until a death forces an audit. e.g. the third party audit of Maharashtra’s 513 aided residential tribal schools ordered only after three girls died.
      6. Political and private control of aided schools: Management by politically connected trusts blunts enforcement. e.g. the Japtalai school was run by a former Member of Parliament, and a first information report followed only after the deaths.
      7. Nutrition and health monitoring gaps: Residential schools carry a documented record of student deaths from disease, suicide and accidents. e.g. the reported 584 student deaths across Maharashtra’s 1,056 ashram schools in two years.

      Conclusion

      The krait was the immediate cause of death, and every other cause was an administrative decision taken long before that night. A hall with no beds and no nets, a supervisor absent without sanction, a highway that turns 9 km into 35 km, and a vegetable van standing in for an ambulance together consumed the half hour in which anti snake venom works. The State’s response so far is a licence cancellation, five first information reports and a third party audit of 513 aided residential schools. The families most affected are asking for the school to be fixed rather than closed, since closure removes the only schooling their children have.

      Tribal Education in India

      1. About: Tribal education policy relies on residential schooling, since Scheduled Tribe habitations are dispersed across forest and hill terrain where a viable day school catchment does not exist.
      2. Population base: Scheduled Tribes number about 10.45 crore, roughly 8.6 percent of India’s population as per Census 2011, spread across more than 700 notified communities.
      3. The persistent gap: Scheduled Tribe literacy and school retention remain below the national average, with the steepest dropout at the transition from upper primary to secondary.
      4. Institutional structure: Delivery runs through State run and aided Ashram Schools, centrally supported Eklavya Model Residential Schools, and hostels funded under Article 275(1) grants.
      5. Administrative frame: Scheduled Areas are governed under the Fifth Schedule, with Tribes Advisory Councils and a Governor’s report to the President on their administration.

      Constitutional Framework Governing Tribal Welfare

      1. Article 15(4): Enables the State to make special provisions for the advancement of socially and educationally backward classes and Scheduled Tribes.
      2. Article 21A: Makes free and compulsory education for children aged 6 to 14 a fundamental right.
      3. Article 46: Directs the State to promote the educational and economic interests of Scheduled Castes and Scheduled Tribes and protect them from social injustice and exploitation.
      4. Article 244 and the Fifth Schedule: Provide for the administration and control of Scheduled Areas and Scheduled Tribes outside the North East.
      5. Sixth Schedule: Provides for autonomous district and regional councils in the tribal areas of Assam, Meghalaya, Tripura and Mizoram.
      6. Article 275(1): Provides grants in aid from the Union to States for tribal welfare schemes and administration of Scheduled Areas, which funds ashram schools and hostels.
      7. Article 338A: Establishes the National Commission for Scheduled Tribes to investigate and monitor safeguards for Scheduled Tribes.
      8. Article 342: Empowers the President to specify the tribes deemed to be Scheduled Tribes in each State and Union Territory.

      Laws and Rules Governing Tribal Welfare and Child Safety

      1. Panchayats (Extension to the Scheduled Areas) Act, 1996: Extends Panchayati Raj to Fifth Schedule areas with adaptations.
      2. Makes the Gram Sabha competent to safeguard community resources and mandates its consultation before land acquisition.
      3. Scheduled Tribes and Other Traditional Forest Dwellers (Recognition of Forest Rights) Act, 2006: Recognises individual and community forest rights of forest dwelling Scheduled Tribes.
      4. Recognises the right to community forest resources and to convert forest villages into revenue villages.
      5. Right of Children to Free and Compulsory Education Act, 2009: Guarantees free and compulsory elementary education and prescribes school infrastructure and pupil teacher norms.
      6. Juvenile Justice (Care and Protection of Children) Act, 2015: Regulates institutions housing children and prescribes standards of care and mandatory reporting.
      7. Residential facilities housing children in need of care require registration and inspection under the Act.
      8. Scheduled Castes and the Scheduled Tribes (Prevention of Atrocities) Act, 1989: Penalises offences against Scheduled Castes and Scheduled Tribes and provides for special courts.
      9. Protection of Children from Sexual Offences Act, 2012: Applies to residential institutions and imposes mandatory reporting duties on staff.

      Back2Basics: Eklavya Model Residential Schools (EMRS)

      1. Ministry: Ministry of Tribal Affairs, implemented through the National Education Society for Tribal Students (NESTS).
      2. Launch: Introduced in 1997 to 1998 and restructured in 2018 to expand coverage.
      3. Norm: An EMRS in every block with more than 50 percent Scheduled Tribe population and at least 20,000 tribal persons.
      4. Design: Fully residential co educational schools from Class 6 to Class 12, with a sanctioned capacity of about 480 students each.
      5. Objective: Provide quality education comparable to Navodaya Vidyalayas to Scheduled Tribe children in remote areas, covering boarding, lodging and academic costs.
      6. Funding: Central capital and recurring grants, with construction and running costs met from the Ministry of Tribal Affairs budget and Article 275(1) grants.

      Government Initiatives for Tribal Welfare and Snakebite Control

      1. Eklavya Model Residential Schools: Central residential schools for Scheduled Tribe children in tribal majority blocks.
      2. Pre Matric and Post Matric Scholarships for Scheduled Tribe students: Fee and maintenance support to reduce dropout at the secondary and higher education stages.
      3. Pradhan Mantri Janjati Adivasi Nyaya Maha Abhiyan (PM JANMAN): Saturation approach for Particularly Vulnerable Tribal Groups covering housing, roads, electricity, water and mobile connectivity.
      4. Dharti Aaba Janjatiya Gram Utkarsh Abhiyan: Saturation of basic amenities and services across tribal majority villages.
      5. National Action Plan for Prevention and Control of Snakebite Envenoming (NAPSE), 2024: Aims to halve snakebite deaths and disabilities by 2030 through ASV availability, training and surveillance.
      6. Snakebite as a notifiable condition: States have been advised to make snakebite cases and deaths notifiable so that the true burden is captured.
      7. Van Dhan Vikas Kendras: Value addition and marketing support for minor forest produce collected by tribal households.
      8. Ashram School scheme under Article 275(1) grants: Central assistance to States for construction and upgradation of tribal residential schools and hostels.

      Key Facts about Tribal Welfare and Snakebite in India

      1. World Tribal Day, the International Day of the World’s Indigenous Peoples, is observed on 9 August.
      2. Janjatiya Gaurav Divas is observed on 15 November, the birth anniversary of Birsa Munda.
      3. India accounts for roughly half of global snakebite deaths, with about 58,000 deaths a year estimated by large mortality studies.
      4. The World Health Organization classifies snakebite envenoming as a neglected tropical disease and targets halving deaths and disabilities by 2030.
      5. The Big Four venomous snakes responsible for most Indian envenomations are the Indian spectacled cobra, common krait, Russell’s viper and saw scaled viper.
      6. Gadchiroli has over 75 percent forest cover and is Maharashtra’s easternmost district.
      7. Scheduled Tribes constitute about 8.6 percent of India’s population as per Census 2011.

      Challenges in Tribal Residential Education

      1. Distance between habitation and school: Enrolment forces children to live five hours or more from home, which raises both dropout and vulnerability. e.g. most children at the Japtalai school come from Etapalli, at least five hours away by road.
      2. Infrastructure norms that exist on paper: Hostel space, bedding, sanitation and boundary walls are prescribed but unverified. e.g. no beds and no mosquito nets for 112 girls at Japtalai despite repeated staff requests.
      3. Staffing and warden accountability: Residential care is left to contractual or unqualified staff at night. e.g. a contractual cook and a peon were the only adults handling a mass envenomation emergency.
      4. Health and emergency infrastructure deficit in Scheduled Areas: Primary health centres lack ASV stocks, ventilators and trained staff, and referral chains are long. e.g. 99 snakebite deaths in Gadchiroli in five years in a district with over 75 percent forest cover.
      5. Road and connectivity failure: Monsoon isolation cuts both schooling and evacuation for months. e.g. the kuccha forest road to Kehakawahi hamlet in Murumgaon, blocked by fallen trees and unusable in the monsoon.
      6. Language and curriculum mismatch: Instruction in the State language alienates first generation tribal learners in early grades. e.g. Gond speaking children entering Class 1 in Marathi medium ashram schools.
      7. Weak grievance and reporting culture: Parents learn of serious incidents late and through informal channels. e.g. a father informed at 9 a.m. by a peon who did not disclose that his daughter had died.

      Way Forward

      1. Make grant release conditional on a safety audit: Tie continued aid to each residential school to an annual verified certification of beds, nets, sanitation, boundary walls and fire and snake proofing.
      2. Post a qualified resident warden and a nurse in every hostel: Replace overnight cover by contractual staff with trained residential staff and a mandatory night duty roster.
      3. Stock anti snake venom and train staff at the nearest facility: Ensure every rural hospital and primary health centre in a high burden block holds polyvalent ASV and can begin treatment within the golden hour.
      4. Attach a dedicated ambulance or emergency vehicle to remote residential schools: Provide a defined emergency transport arrangement rather than relying on whatever vehicle is available.
      5. Prioritise all weather road connectivity in Scheduled Areas: Complete and maintain the Dhanora to Japtalai type stretches under road connectivity schemes so monsoon isolation ends.
      6. Repair rather than close failing schools: Upgrade facilities in place where closure would end schooling for children with no affordable alternative.
      7. Fix accountability upward: Ensure inquiries name the supervising project officers and departmental officials, and bar an official whose lapse is under examination from acting as complainant.
      8. Notify and monitor snakebite: Make snakebite reporting mandatory across the district and publish block level data so preventive investment follows the burden.

      PYQ:

      “`

      [2025, GS1, 15 marks] Does tribal development in India centre around two axes, those of displacement and of rehabilitation? Give your opinion.

      “`

    5. Should India incentivise bigger families

      Why in the News?

      Andhra Pradesh recently announced cash incentives of ₹30,000-₹50,000 for women having a third or fourth child. India’s demographic policy debate has entered a new phase as several states are considering incentives for larger families after decades of promoting smaller families. The trigger is the sustained decline in fertility rates, with India’s TFR falling to 1.9, below the replacement level of 2.1, and states such as Andhra Pradesh recording TFRs as low as 1.3.

      What is the Demographic transition?

      1. It refers to the shift from high birth and death rates to low birth and death rates as societies develop economically and socially. 
      2. Historically, fertility declines have accompanied rising incomes, urbanisation, female education, and workforce participation. 
      3. India has now entered a phase where fertility rates have fallen below replacement levels, prompting discussions on whether public policy should move from population control to population stabilisation or even population encouragement in certain regions.

      Is India Experiencing a Significant Fertility Decline?

      1. Below-Replacement Fertility: India’s Total Fertility Rate has declined to 1.9, below the replacement level of 2.1.
      2. Sharp Regional Variations: Several southern states have reached extremely low fertility levels. Andhra Pradesh’s TFR has fallen to around 1.3.
      3. Long-Term Trend: Fertility decline has been occurring steadily since economic liberalisation and social transformation accelerated.
      4. Demographic Transition: Falling fertility reflects increasing urbanisation, higher female education levels, delayed marriages, and changing family preferences.
      5. Individualistic Social Behaviour: Smaller family norms have become socially embedded and are difficult to reverse through financial incentives alone.

      What Factors Are Driving Calls for Larger Families?

      1. Population Ageing: Falling fertility rates increase the share of elderly citizens relative to the working-age population.
      2. Shrinking Workforce Concerns: Fewer births today may reduce future labour force availability.
      3. Federal Representation Debate: Concerns exist that states with slower population growth may face reduced political representation after future delimitation exercises.
      4. Economic Sustainability: A shrinking working-age population may affect savings, investments, productivity, and economic growth.
      5. Dependency Burden: Lower worker-to-retiree ratios increase pressure on pension systems and healthcare expenditure.

      Can Financial Incentives Reverse Fertility Decline?

      1. Limited International Success: Evidence suggests fertility incentives have produced only modest improvements in fertility rates.
      2. Behavioural Transformation: Fertility decisions are increasingly influenced by lifestyle choices rather than financial considerations.
      3. Rising Cost of Child-Rearing: Education, healthcare, housing, and childcare expenses discourage larger families.
      4. Women’s Workforce Participation: Increased female employment often correlates with delayed childbirth and smaller family sizes.
      5. Economic Trade-Offs: Families increasingly prefer investing more resources in fewer children.
      6. Structural Constraints: Fertility decline is linked to broader social and economic transformations that cannot be reversed solely through cash transfers.
      7. Andhra Pradesh Initiative: The state announced incentives of ₹30,000-50,000 for women having a third or fourth child to encourage larger families.

      What Lessons Emerge from International Experience?

      Poland

      1. Cash Incentives: Introduced financial support programmes to encourage childbirth.
      2. Limited Impact: Fertility rates improved marginally but failed to sustain long-term reversal.

      Hungary

      1. Tax Benefits: Implemented extensive tax incentives and family support policies.
      2. Mixed Outcomes: Temporary increases in births were observed, but fertility remained below replacement level.

      Sweden and France

      1. Comprehensive Family Support: Combined childcare facilities, parental leave, and work-life balance measures.
      2. Better Results: Recorded relatively higher fertility rates compared to many European countries.

      South Korea

      1. Massive Public Spending: Invested heavily in pro-natalist policies.
      2. Persistent Low Fertility: Fertility rates remain among the lowest globally.

      Singapore and Japan

      1. Demographic Ageing Challenge: Despite policy interventions, ageing and low fertility continue to persist.

      Why Is Fertility Decline Difficult to Reverse?

      1. Socio-Cultural Change: Fertility behaviour changes permanently after societies become economically advanced.
      2. Urbanisation: Urban lifestyles increase living costs and reduce preference for larger families.
      3. Career Aspirations: Education and employment opportunities alter family planning decisions.
      4. Delayed Marriage: Rising marriage age directly reduces fertility levels.
      5. Changing Family Structure: Nuclear families increasingly replace traditional joint-family support systems.
      6. Quality-over-Quantity Preference: Parents prioritise greater investment in fewer children.

      How Does Fertility Decline Affect India’s Federal Structure?

      1. Uneven Demographic Transition: Different states are at different stages of demographic transition.
      2. Divergent Economic Needs: Younger states may prioritise job creation, while ageing states may prioritise pensions and healthcare.
      3. Policy Asymmetry: States may require different social and economic policies based on demographic profiles.
      4. Delimitation Concerns: States with lower population growth fear reduced parliamentary representation.
      5. Inter-State Demographic Imbalances: Population trends could reshape political and fiscal dynamics within the federation.

      Does India Face an Immediate Labour Shortage?

      1. Current Labour Surplus: India continues to have a large working-age population.
      2. Low Female Labour Participation: A substantial share of working-age women remain outside the workforce
      3. Labour Market Vacancies: Some vacancies persist despite available labour, indicating skill mismatches rather than absolute shortages.
      4. Underemployment Challenge: Employment generation remains a larger concern than workforce scarcity.
      5. Demographic Dividend Window: India continues to benefit from a sizeable youth population.

      Can Migration Offset Regional Population Decline?

      1. Labour Mobility: Interstate migration can help address workforce shortages in ageing states.
      2. Economic Integration: Workers move towards regions with greater employment opportunities.
      3. Historical Experience: Migration has supported economic growth in rapidly developing regions.
      4. Political Sensitivities: Large-scale migration may generate social and political concerns in receiving state
      5. Labour Market Adjustment: Migration often serves as a natural response to demographic imbalances.

      Is Population Growth the Best Solution to Ageing?

      1. Healthcare Investments: Strong healthcare systems can mitigate ageing-related challenges.
      2. Pension Reforms: Sustainable pension systems reduce dependency burdens.
      3. Human Capital Development: A skilled workforce can compensate for slower population growth.
      4. Productivity Enhancement: Technological advancement can offset labour shortages.
      5. Silver Economy: Ageing populations create new economic sectors related to healthcare, caregiving, and elderly services.
      6. Alternative Policy Choice: Investment in education, skills, and productivity may yield better outcomes than incentivising higher fertility.

      Conclusion

      India’s fertility decline reflects an advanced stage of demographic transition rather than a population crisis. While ageing and workforce concerns require attention, international experience shows that fertility incentives alone have limited impact. India’s priority should be strengthening human capital, productivity, healthcare, and social security to ensure sustainable demographic and economic growth.

      Value Addition

      Demographic Transition Model (DTM)

      Stage I

      1. High birth rate and high death rate.
      2. Population growth remains low.

      Stage II

      1. Death rate declines due to healthcare improvements.
      2. Population grows rapidly.

      Stage III

      1. Birth rate starts declining.
      2. Population growth slows.

      Stage IV

      1. Low birth rate and low death rate.
      2. Stable population.

      Stage V

      1. Birth rate falls below death rate.
      2. Population ageing and decline begin.

      India: Transitioning between Stage III and Stage IV.

      Replacement Level Fertility

      1. Average number of children required per woman to maintain population stability.
      2. Generally estimated at 2.1 children per woman.

      National Family Health Survey (NFHS-5)

      1. India’s TFR: 2.0
      2. Several southern states have fertility rates significantly below replacement level.
      3. Reflects continuing demographic transition.

      PYQ Relevance

      [UPSC 2024] What is the concept of a ‘demographic winter’? Is the world moving towards such a situation? Elaborate

      Linkage: The PYQ directly examines declining fertility, ageing populations, and shrinking workforce concerns. The article debates whether India should respond to below-replacement fertility by incentivising larger families to avoid a future demographic winter.

    6. India’ future demographic challenges 

      Why in the News?

      A new report ‘Unravelling India’s Demographic future: Population Projections for States and Union Territories, 2021-2051, by the International Institute of Migration and Development (IIMAD) and the Population Foundation of India projects, for the first time, that India will move beyond a youth-dominated demographic profile into an ageing society. This marks a sharp departure from earlier fears of population explosion. The elderly population is set to double to 20.5% (325.3 million) by 2051, while the demographic dividend window will begin closing after 2041, making this transition a critical policy challenge with long-term economic implications.

      How is India’s demographic structure fundamentally changing?

      1. Population Growth Slowdown: Decline in growth rate to 0.5% annually, indicating demographic stabilisation.
      2. Shift from Youth Bulge: Transition from youth-heavy to ageing population structure.
      3. Median Age Increase: Rise from 28 years (2021) to 40 years (2051), signalling advanced demographic transition.
      4. Balanced Demography: Movement toward a more urbanised and ageing society

      How is the demographic dividend window evolving and why is it time-bound?

      1. Working-age Population Growth: Rise to 65.5% (1,009 million) by 2041.
      2. Post-2041 Decline: Fall to 62.8% by 2051, indicating end of demographic advantage.
      3. Economic Opportunity: Larger workforce enables higher productivity and growth (example: China, Japan, South Korea).
      4. Urgency Factor: Limited window necessitates rapid skill and employment generation policies.
      5. Workforce Share: Nearly 60% population expected in workforce by 2051.

      What are the implications of India’s rapidly ageing population?

      1. Elderly Population Growth: Increase from 130.5 million (9.62%) in 2021 to 325.3 million (20.5%) in 2051.
      2. Healthcare Pressure: Rising demand for geriatric care and chronic disease management.
      3. Social Security Burden: Increased strain on pensions and welfare systems.
      4. Fiscal Stress: Growing elderly dependency ratio impacts state finances.
      5. Silver Economy Potential: New economic opportunities in elder care, healthcare services, and assisted living.

      Why is declining fertility creating structural challenges for the education system?

      1. Falling Child Population: Reduction from 113.5 million (2021) to 86 million (mid-century) in the 0-4 age group.
      2. Declining Government Schools: Drop from 11.07 lakh (2014-15) to 10.18 lakh (2023-24) (~90,000 schools).
      3. Rise of Private Schools: Increase from 2.88 lakh to 3.31 lakh, reflecting shift in parental preferences.
      4. Uneconomic Schools: Lower enrolments threaten viability of government institutions.
      5. Kerala Example: Long-term trend of declining fertility impacting school infrastructure.

      How are socio-economic shifts influencing schooling and human capital formation?

      1. Parental Preference Shift: Movement toward private schools due to perceived quality differences.
      2. Smaller Families: Improved affordability increases investment per child.
      3. Reduced Enrolment: Lower fertility reduces demand for schooling infrastructure.
      4. Quality Gap: Government schools perceived to lag in education quality.

      What policy signals emerge from declining fertility and ageing trends?

      1. Education Reform Need: Strengthens skill development and quality education systems.
      2. Healthcare Reorientation: Facilitates resource optimisation and improved healthcare delivery.
      3. Women Workforce Participation: Expands the labour force by reducing gender gaps.
      4. Reproductive Rights: Ensures access to family planning and prevents unintended pregnancies.
      5. Employment Expansion: Supports formal employment generation to offset workforce decline.

      Conclusion

      India’s demographic trajectory signals a transition from opportunity to responsibility. The closing demographic dividend window, combined with rapid ageing, requires immediate investments in human capital, healthcare systems, and employment generation. Effective policy adaptation will determine whether India sustains growth or faces structural stagnation.

      PYQ Relevance

      [UPSC 2016] “Demographic Dividend in India will remain only theoretical unless our manpower becomes more educated, aware, skilled and creative.” What measures have been taken by the government to enhance the capacity of our population to be more productive and employable?

      Linkage: Demographic dividend potential is time-bound, with workforce share peaking around 2041, requiring urgent investment in skills and human capital. The article highlights declining fertility and ageing trends, reinforcing the need to enhance productivity before the demographic window closes.

    7. [23rd December 2025] The Hindu OpED: Right to disconnect: Drawing the line after work

      PYQ Relevance

      [UPSC 2022] Explore and evaluate the impact of ‘Work from Home’ on family relationships. 

      Linkage: The expansion of work-from-home has blurred boundaries between professional and personal life, altering family roles, care responsibilities, and work–life balance. This directly links to GS-I themes of family as a social institution and supports GS-II discussions on labour regulation and the Right to Disconnect in a digital economy.

      Why in the News

      The Right to Disconnect Bill has been introduced as a private member’s bill, a legislative route rarely resulting in enactment, yet symbolically significant. The Bill arrives amid India’s recent consolidation of labour laws into four labour codes, which regulate working hours, overtime, and employer control primarily through time-based constructs. In contrast, digital work has extended employer engagement beyond the physical workplace and prescribed hours.

      Introduction

      Indian labour law historically regulates work through fixed hours, physical workplaces, and employer supervision. Digitalisation has disrupted these assumptions by enabling continuous connectivity. The Right to Disconnect Bill attempts to recognise this shift by allowing employees to disengage from work-related communication beyond working hours. However, the Bill operates within an unchanged legal framework, raising questions about enforceability, coherence, and constitutional grounding.

      What does the Right to Disconnect Bill seek to regulate?

      1. After-hours communication: Grants employees the right not to respond to work-related calls or messages beyond prescribed working hours.
      2. Behavioural norm framing: Treats disconnection as a conduct-related entitlement rather than a measurable labour standard.
      3. Limited legal integration: Does not redefine “work” under existing labour codes governing hours and overtime.

      What ambiguities arise regarding the definition of ‘work’?

      1. Conceptual gap: Fails to clarify whether digital engagement after hours constitutes “work” under labour law.
      2. Regulatory inconsistency: Operates alongside the Occupational Safety, Health and Working Conditions Code, 2020, without alignment.
      3. Employer control question: Leaves unresolved whether employer-initiated digital communication amounts to control over employee time.

      How does the Bill interact with existing labour codes?

      1. Time-based regulation: Labour codes regulate work through fixed hours and overtime thresholds.
      2. Unaddressed overlap: The Bill does not specify whether after-hours engagement triggers overtime or compensatory mechanisms.
      3. Contractual ambiguity: Does not clarify whether the right is mandatory or modifiable through contracts and workplace policies.

      How have other jurisdictions addressed the right to disconnect?

      1. European Union: Expands the definition of working time through judicial interpretation, including standby and on-call periods.
      2. Employer control test: European Court of Justice equates employer control with working time.
      3. France: Integrates digital disconnection through collective bargaining rather than redefining work.
      4. Germany: Enforces strict working-time and rest-period regulations.
      5. Indian contrast: Lacks jurisprudential clarity on when employee time belongs to the employer.

      Does the Bill have a constitutional dimension?

      1. Article 21 linkage: Right to disengage has an evident relationship with individual autonomy and dignity.
      2. Legislative silence: The Bill neither articulates nor traces this constitutional foundation.
      3. Unresolved character: Leaves unclear whether the right is statutory, indicative, or constitutionally derived.

      Why does the Bill risk remaining ineffective?

      1. Framework mismatch: Relies on a labour law architecture designed for physical workplaces.
      2. Absence of enforceability: Does not integrate digital engagement into working time calculations.
      3. Interpretive uncertainty: Opens the field to divergent judicial interpretations.

      Conclusion:

      Work from home has redefined family relationships by simultaneously enabling greater presence at home and intensifying work-family conflicts due to constant digital connectivity. Its long-term social impact depends on balanced labour norms that protect family life while accommodating flexible work arrangements.

    8. Guru Tegh Bahadur Ji: Martyrdom Day

      Why in the news?

      On the eve of the 350th Martyrdom Day of Guru Tegh Bahadur Ji, the President of India, Smt. Droupadi Murmu paid tribute to the ninth Sikh Guru, highlighting his supreme sacrifice for the protection of righteousness, humanity and freedom of faith.

      Who was Guru Tegh Bahadur?  

      • Ninth Guru of Sikhism (1621–1675).
      • Youngest son of Guru Hargobind Sahib, the sixth Guru.
      • Known as “Hind di Chadar” (Shield of India) for defending religious freedom.
      • Key teachings recorded in the Guru Granth Sahib, including hymns on detachment, courage, and equality.

      Why is His Martyrdom Significant?

      • Guru Tegh Bahadur opposed forced conversions under Mughal Emperor Aurangzeb.
      • He defended the rights of Kashmiri Pandits, who sought his protection.
      • Arrested and executed in Chandni Chowk, Delhi, on 24 November 1675.
      • His martyrdom represents:
        • Protection of freedom of conscience
        • Defence of pluralism and interfaith harmony
        • Upholding justice and truth

      President of India’s 2025 Message: Key Highlights

      • Tribute to his valour, sacrifice, and principles.
      • Emphasised his role in preserving: Righteousness, Humanity, Truth.
      • Called upon citizens to imbibe his values to strengthen harmony and unity in India.

      Guru Tegh Bahadur’s Contributions  

      • Spiritual Teachings: Advocated nirbhau (fearlessness) and nirvair (compassion). Stressed spiritual liberation through humility and service.
      • Establishment of Sikh Centres: Founded the city of Anandpur Sahib (1665). Travelled widely across the Indian subcontinent, spreading Sikh philosophy.
      • Guru Granth Sahib Contribution: Composed 116 hymns, including shaloks on detachment and moral courage.
      (2009) With reference to the cultural history of medieval India, consider the following statements: 

      1. Siddhas (Sittars) of Tamil region were monotheistic and condemned idolatry. 

      2. Lingayats of Kannada region questioned the theory of rebirth and rejected the caste hierarchy. 

      Which of the statements given above is/are correct? 

      (a) 1 only (b) 2 only (c) Both 1 and 2 (d) Neither 1 nor 2