Mains Ready By December. Smash Mains & Smash PYQ Admissions Open

GS Paper: GS3-18.Conservation, Environmental Pollution and Degradation, Environmental Impact Assessment.

  • Species in news: Swamp Wallaby


    Researchers reported that the swamp wallaby, a marsupial related to the kangaroo, is pregnant throughout its adult life. It typically conceives a new embryo days before delivering the newborn from its previous pregnancy.

    Swamp wallaby

    IUCN Status: Least Concerned

    • The swamp wallaby is a small macropod marsupial of eastern Australia. It is likely the only mammal pregnant and lactating all lifelong.
    • Female wallabies and kangaroos have two uteri and two separate ovaries.
    • At the end of a pregnancy in one uterus, a new embryo develops in the other uterus.
    • Kangaroos and wallabies regularly have an embryo in the uterus, a young joey in the pouch, and a third semi-dependent young at foot, still drinking its mother’s milk.

    How it is different from Kangaroo?

    • In kangaroos, the new embryo is conceived a day or two after the previous birth.
    • In the swamp wallaby (Wallabia bicolor), the new conception happens one or two days before the previous joey is delivered.

    What happens after?

    • As soon as the mature foetus is born and settles in the pouch, the swamp wallaby arrests the development of the new embryo.
    • This is called embryonic diapause, which happens in many animals to pause reproduction until the conditions are right — season, climate, food availability.
    • For wallabies, this is also to ensure that the new one is born only when the pouch is free again.
    • If this did not happen, the swamp wallaby would be birthing new young every 30 days — it has a short gestation period — and its pouch could not support that.
  • Hazards of using fertilizers in Punjab

    Studies have pegged consumption of phosphatic fertilizers in Punjab at ten times higher than the national average. Thence media has consistently reported on cancer deaths in the Malwa region of Punjab.

    What are phosphatic fertilizers?

    • Phosphatic fertilizers are chemical substances that contain the nutrient phosphorus in an absorbable form (Phosphate anions) or that yield after conversion in the soil.
    • Phosphates help plants store energy, root well, flower and produce fruit.
    • The DAP or Diammonium Phosphate is the widely used phosphatic fertilizer in our country.
    • The total fertilizer consumption in India is 27 million tones, out of which about 20-25 per cent of phosphorous and nitrogen-based nutrients are dependent on imports from the United States, Jordan, Iran, Oman, China, Russia, Morocco, Israel, Lithuania and Egypt.

    Hazards of phosphatic fertilizers

    • Pursuant to the disquieting reports from the area, BARC in 2013 analysed fertilizer and soil samples from the Malwa region and discovered heavy concentration of Uranium.
    • According to the report, Uranium concentration in DAP was around 91.77 parts per million (ppm), which was way beyond the permissible limit.
    • It is also a fact that the fertiliser industry in India does not follow all procedures and protocols essential for decontamination of imported phosphatic rock associated with traces of Uranium.
    • There is yet another theory which does not support the fertiliser route for Uranium ingestion through food chain, but emphasises on the geogenic factors for the possible presence of Uranium in the groundwater samples.
    • Higher concentrations of Uranium are present in certain types of soils and rocks, especially granite.
    • All the three isotopes of Uranium (U-234, U-235, U-238) have a half-life period ranging from 0.25 million years to 4.47 billion years, indicating their relative stability.

    Increasing Uranium contamination

    • Presence of Uranium is widespread, and according to the United Nations Scientific Committee on the Effects of Atomic Radiation, its normal concentration in soil is between 300 microgram per kg (ug/kg) and 11.7 milligram per kg (mg/kg).
    • In the Indian context, contamination of Uranium in Punjab’s groundwater has been a problem since the early 2000s.
    • High levels of uranium found in the fertile Malwa region along with industrial effluents leads to a bigger problem as it contaminates the groundwater.
    • The presence of bicarbonates, nitrate, chloride anions and soil is calcareous since the carbonic acid created in the process enhances leaching efficiency of uranium from soils and sediments.

    Matter of urgent importance

    • With no guidelines or acceptable standards by Central Pollution Control Board (CPCB) regarding the amount of uranium in fertilizers produced in India, we are on a dead track.
    • Authorities’ concerned need to take cognizance and invest in less expensive R&D of the decontamination process.
    • At the same time, it is also necessary to specify the acceptable limit of Uranium in groundwater.

    Back2Basics

    Complete details of fertilizers

    http://agritech.tnau.ac.in/agriculture/agri_nutrientmgt_fertilizers.html

  • Bharat Stage (BS) VI emission norms

    Oil marketing companies have informed that there will definitely be a marginal increase in retail prices of the fuels from April 1. Starting April 1, Bharat Stage (BS) VI emission norms come into force. This will be an upgrade on the currently prevalent BS-IV and BS-III norms.

    Why rise in Oil prices?

    • In effect, as India moves up the BS scale, automobiles become cleaner and greener but fuel will go costly.
    • Oil refiners have invested heavily to upgrade their refineries to produce the cleaner, BS-VI compliant fuel.
    • The increase in the pump price of fuel will partially offset this cost that the oil marketing companies have paid.
    • In effect, consumers will have to pay a little extra for auto fuel that is cleaner, and which, ultimately, is expected to lead to cleaner air.

    The BS norms

    • The BS emission standards are norms instituted by the Indian government to regulate the output of air pollutants from internal combustion engine equipment, including motor vehicles.
    • India has been following the European (Euro) emission norms, although with a time lag.
    • The more stringent the BS norm, lower is the tolerance for pollutants in automobile tailpipe emissions. Lower tailpipe emissions are the function of both more efficient engines, and cleaner fuels.

    How is BS-VI fuel different from BS-IV fuel?

    • The main difference between BS-IV and BS-VI (which is comparable to Euro 6) is in the amount of sulphur in the fuel.
    • The lower the sulphur, the cleaner the fuel, so BS-VI fuel is essentially low-sulphur diesel and petrol.
    • BS-VI fuel is estimated to bring around an 80% reduction in sulphur content — from 50 parts per million (ppm) to 10 ppm.
    • Also NOx emissions from diesel cars are expected to come down by nearly 70% and, from cars with petrol engines, by 25%.

    How will things change with the new fuels?

    • Cleaner fuel alone will not make a dramatic difference to air pollution.
    • For the full benefits to be experienced, the introduction of the higher grade fuel must go hand in hand with the rollout of BS-VI compliant vehicles as well.
    • While automakers will sell only BS-VI vehicles from April 1, all BS-IV vehicles sold before that date will stay on the road for as long as their registration is valid.
    • This, however, could be a concern because using BS-VI fuel in the current BS-IV engines (or conversely, running BS-VI engines on the current-grade fuel), may be both ineffective in curbing vehicular pollution, as well as damage the engine in the long run.

    Back2Basics

    History of BS norms in India

    • India introduced emission norms first in 1991, and tightened them in 1996, when most vehicle manufacturers had to incorporate technology upgrades such as catalytic converters to cut exhaust emissions.
    • Fuel specifications based on environmental considerations were notified first in April 1996, to be implemented by 2000, and incorporated in BIS 2000 standards.
    • Following the landmark Supreme Court order of April 1999, the Centre notified Bharat Stage-I (BIS 2000) and Bharat Stage-II norms, broadly equivalent to Euro I and Euro II respectively.
    • BS-II was for the National Capital Region and other metros; BS-I for the rest of India.
    • From April 2005, in line with the Auto Fuel Policy of 2003, BS-III and BS-II fuel quality norms came into existence for 13 major cities, and for the rest of the country respectively.
    • From April 2010, BS-IV and BS-III norms were put in place in 13 major cities and the rest of India respectively.
    • As per the Policy roadmap, BS-V and BS-VI norms were to be implemented from April 1, 2022, and April 1, 2024 respectively.
    • But in November 2015, the Road Transport Ministry issued a draft notification advancing the implementation of BS-V norms for new four-wheel vehicle models to April 1, 2019, and for existing models to April 1, 2020.
  • Migratory species in India


    With new additions to the wildlife list put out by the Convention on the Conservation of Migratory Species (CMS), scientists say that the total number of migratory fauna from India comes to 457 species.

    Migratory species in India

    • Globally, more than 650 species are listed under the CMS appendices and India, with over 450 species, plays a very important role in their conservation.
    • The Zoological Survey of India (ZSI) had for the first time compiled the list of migratory species of India under the CMS before the Conference of Parties (COP 13) held in Gujarat recently.
    • It had put the number at 451. They are the Asian elephant, great Indian bustard, Bengal florican, oceanic white-tip shark, urial and smooth hammerhead shark.
    • Birds comprise 83% (380 species) of this figure.

    Various species mentioned

    • India has three flyways (flight paths used by birds): the Central Asian flyway, East Asian flyway and East Asian–Australasian flyway.
    • In India, their migratory species number 41, followed by ducks (38) belonging to the family Anatidae.
    • The estimate of 44 migratory mammal species in India has risen to 46 after COP 13.
    • The largest group of mammals is definitely bats belonging to the family Vespertilionidae. Dolphins are the second highest group of mammals with nine migratory species of dolphins listed.
    • Fishes make up another important group of migratory species. Before COP 13, the ZSI had compiled 22 species, including 12 sharks and 10 ray fish.
    • Seven reptiles, which include five species of turtles and the Indian gharial and salt water crocodile, are among the CMS species found in India. There was no addition to the reptiles list.
  • Species in news: Eurasian Otters


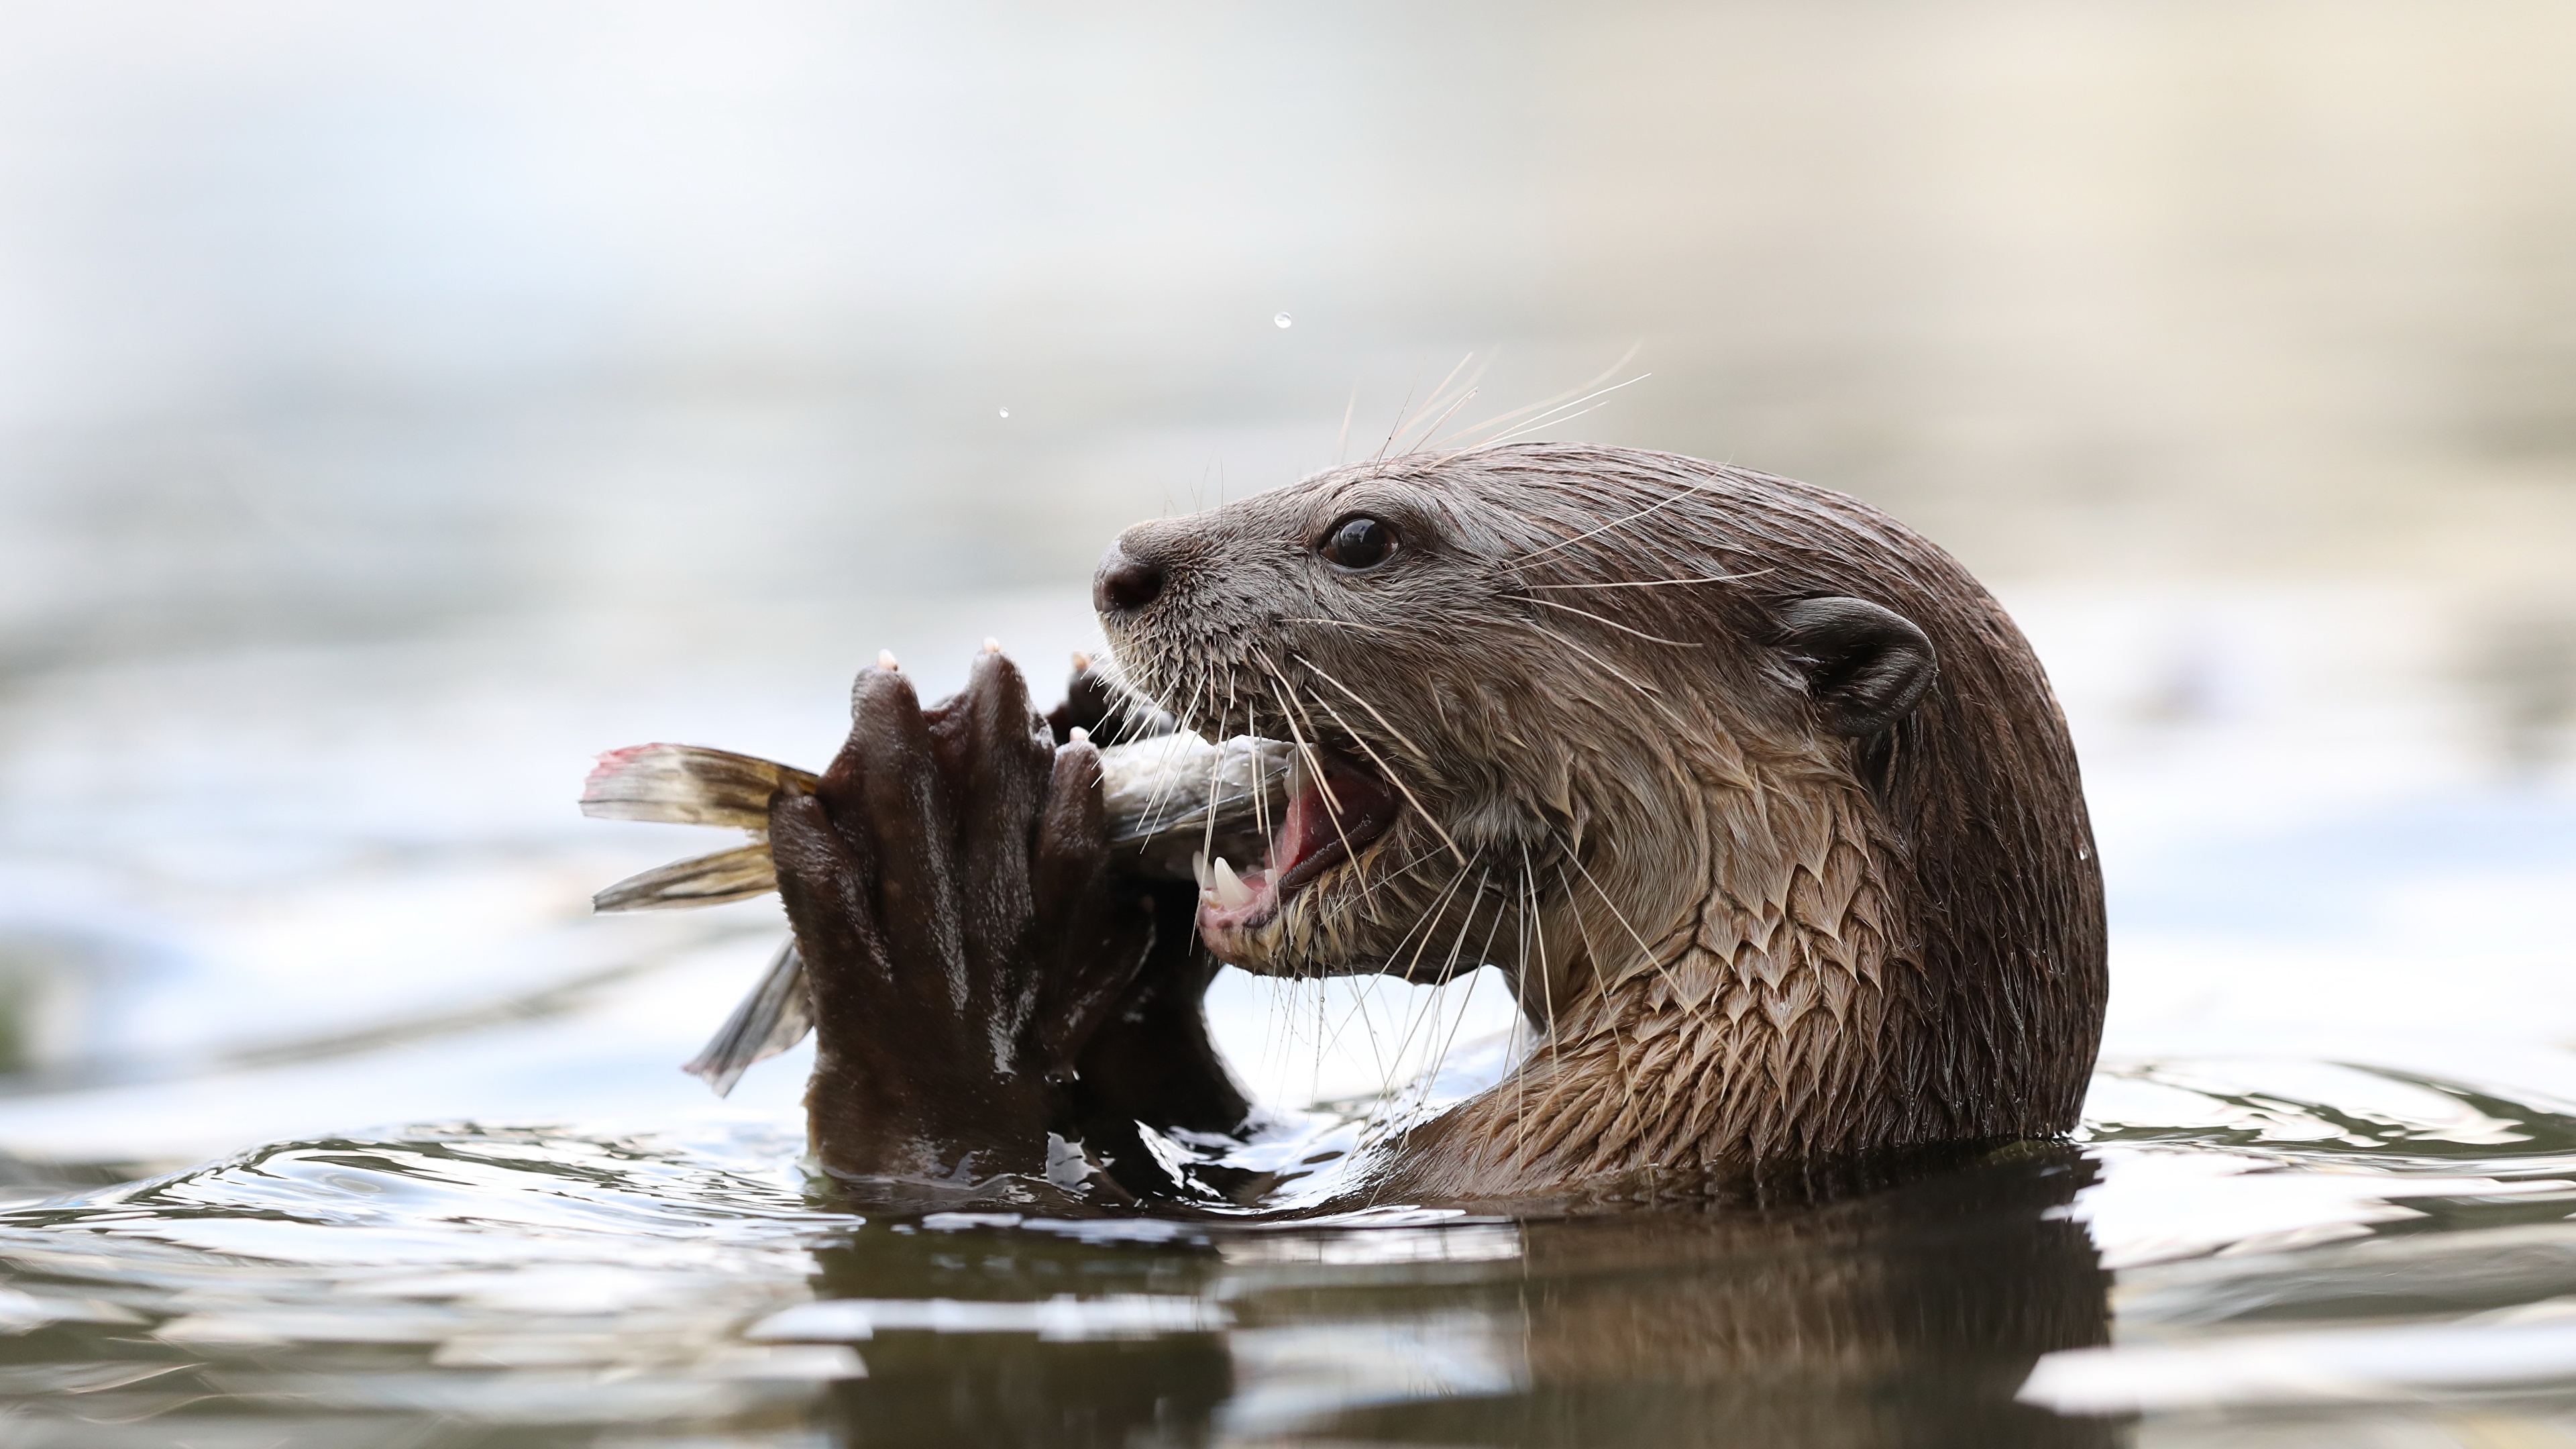
    Researchers conducting a study in Odisha’s Chilika Lake have found the presence of a viable, breeding population of Eurasian Otters, a fishing cat in the brackish water lagoon.

    Eurasian Otters

    • IUCN Status: Near Threatened
    • Species in India: Smooth-coated, Asian small-clawed and Eurasian Otters
    • Habitat: Smooth-coated — all over India; Asian small-clawed — only in the Himalayan foothills, parts of the Eastern and southern Western Ghats; Eurasian — Western Ghats and Himalayas.
    • Diet comprises several small animals, mainly crabs and small fishes.
    • Lives in small packs, is mostly nocturnal, but can be diurnal in areas which are less disturbed.
  • [pib] ‘1000 Springs’ Initiative


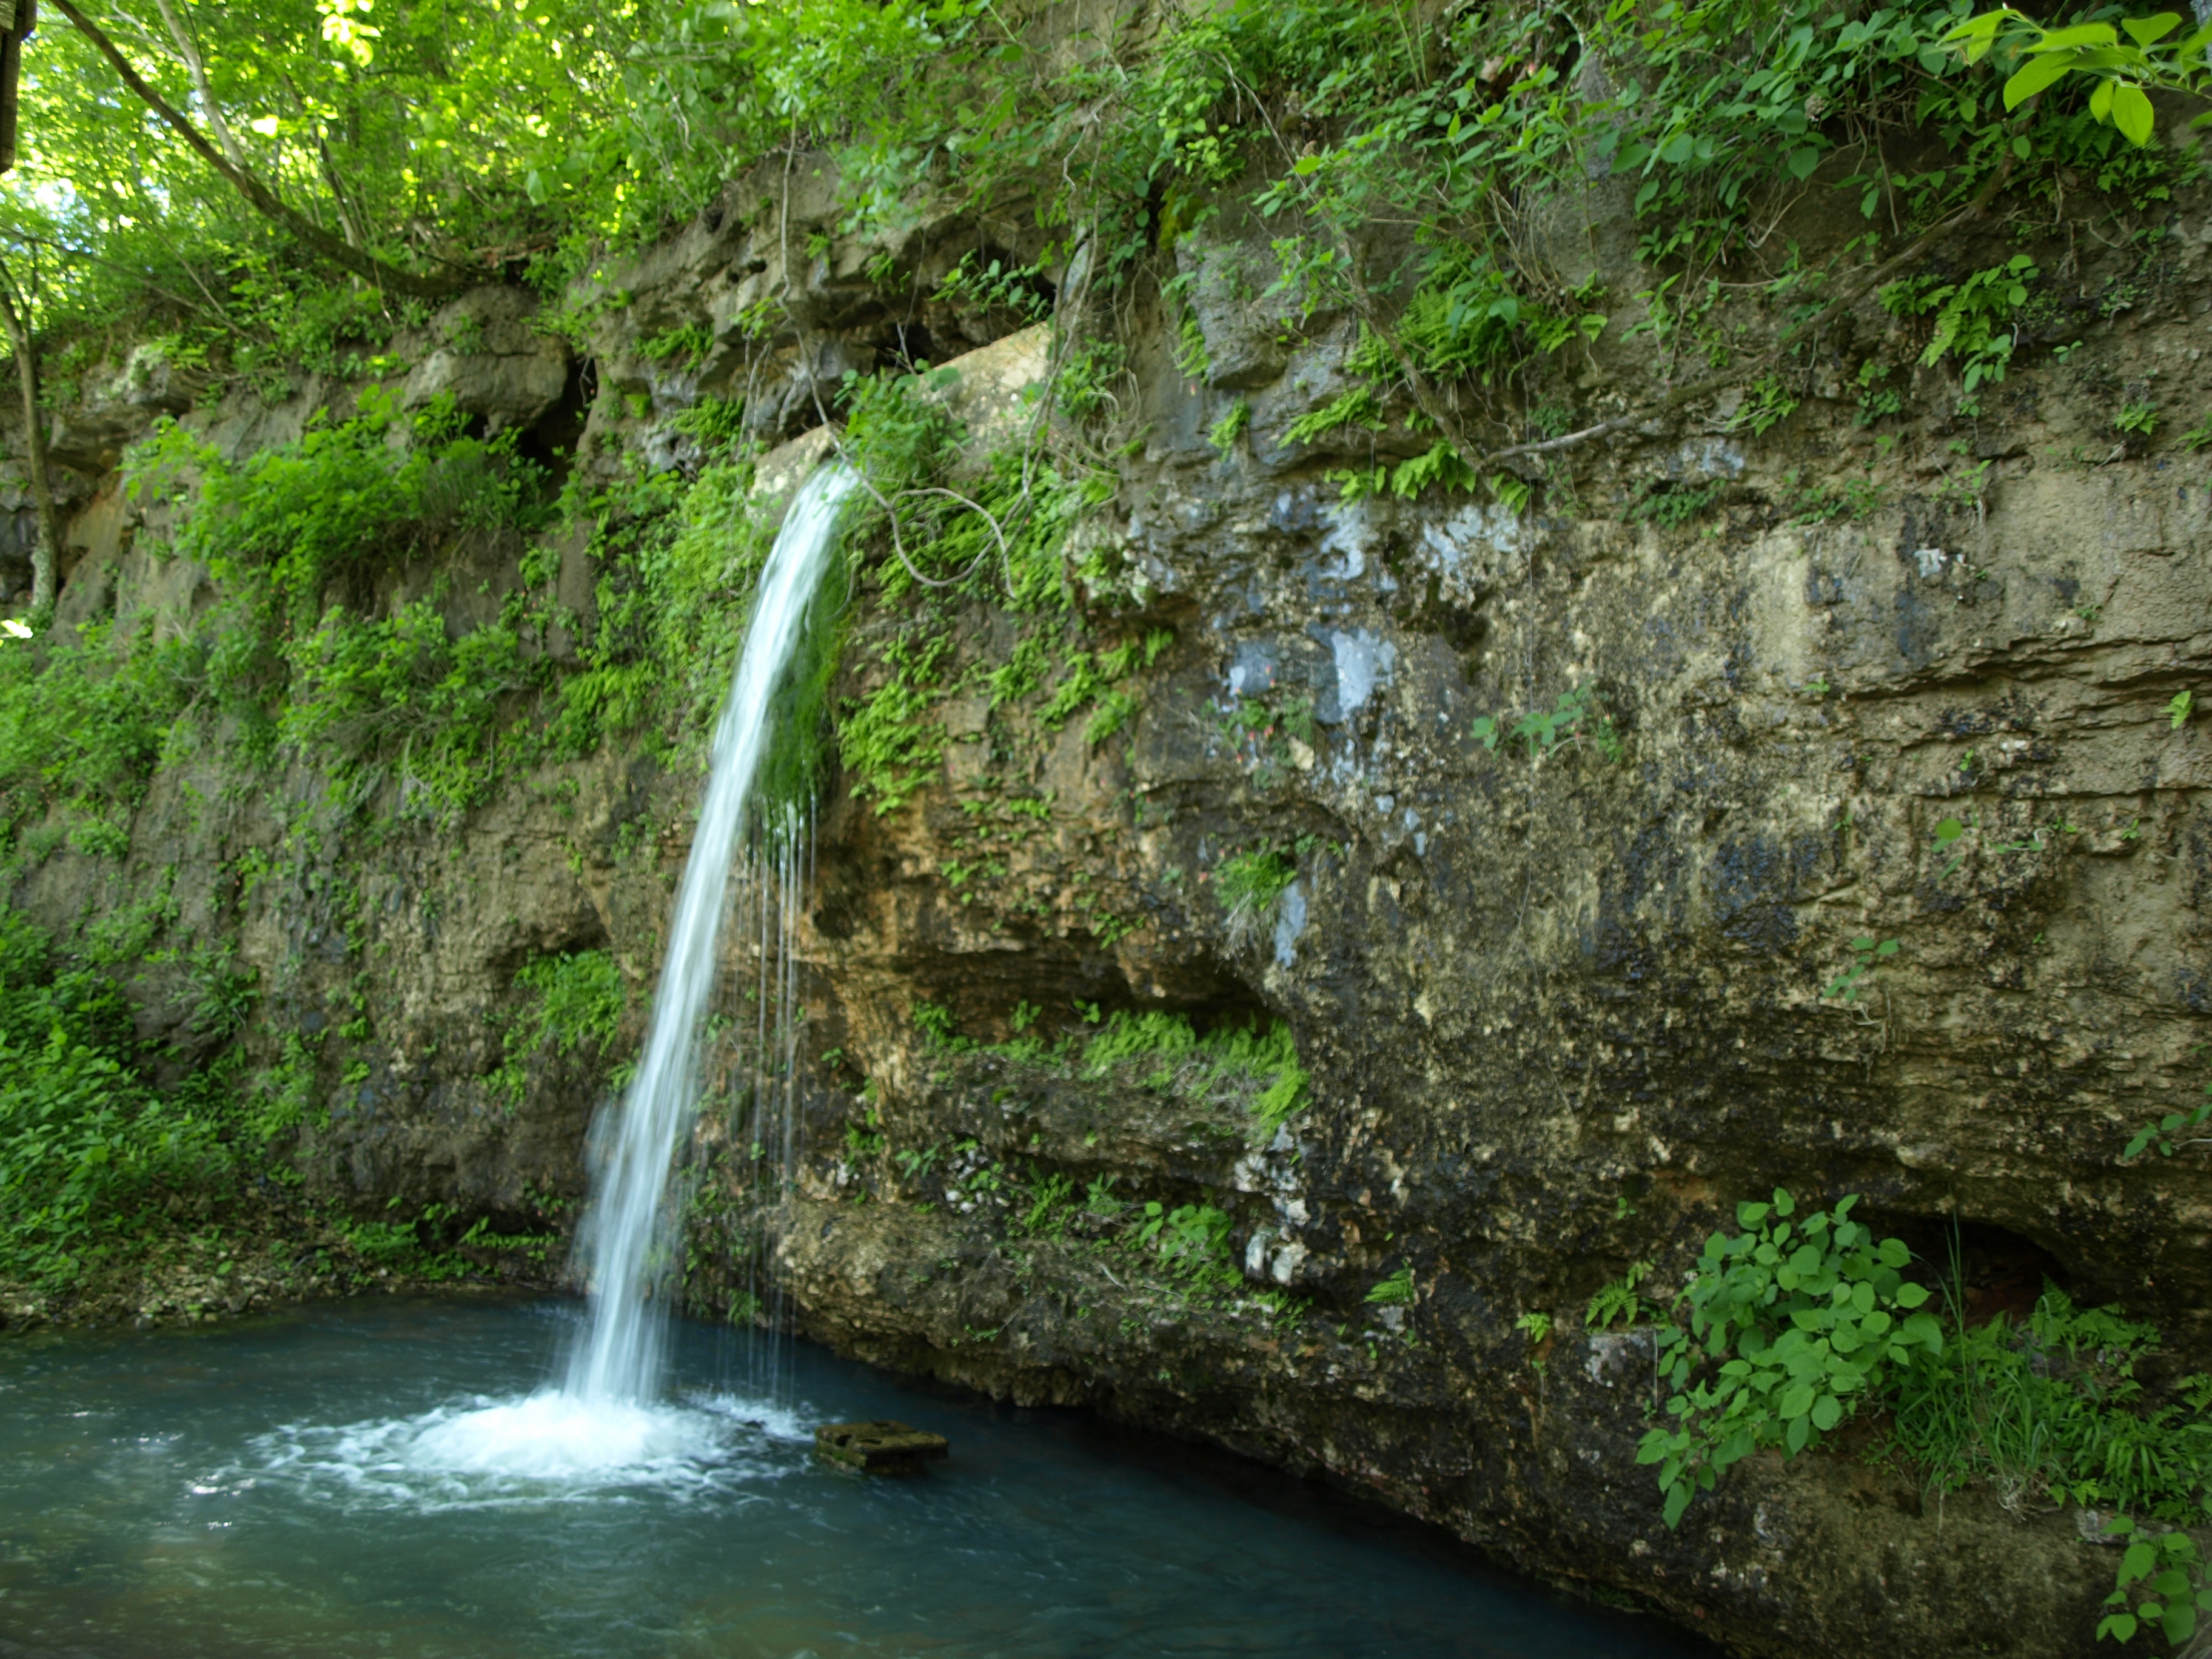
    Union Tribal Affairs Ministry has launched “1000 Spring Initiatives” and an online portal on GIS-based Spring Atlas with hydrological and chemical properties of the Springs on the occasion.

    ‘1000 Springs’ Initiative

    • The ‘1000 Springs Initiative’ aims at improving access to safe and adequate water for the tribal communities living in a difficult and inaccessible part of rural areas in the country.
    • It is an integrated solution around natural springs.
    • It includes the provision of infrastructure for piped water supply for drinking; provision of water for irrigation; community-led total sanitation initiatives; and provision for water for backyard nutrition gardens, generating sustainable livelihood opportunities for the tribal people.
    • It will help in harnessing the potential of perennial springs’ water to address the natural scarcity of water in tribal areas.

    Spring Atlas

    • Springs are natural sources of groundwater discharge and have been used extensively in the mountainous regions across the world, including India.
    • However, in the central and eastern Indian belt with more than 75% tribal population, it remains largely unrecognized and under-utilized.
    • An online portal on GIS-based Spring Atlas has been developed to make these data easily accessible from an online platform.
    • Presently, data of more than 170 springs have been uploaded on the Spring Atlas.
  • World Air Quality Report, 2019


    The 2019 World Air Quality Report was recently released

    World Air Quality Report

    • The World Air Quality Report is released by the pollution tracker IQAir and Greenpeace.
    • The report focuses on PM2.5 as a representative measure of air pollution.

    Highlights of the report

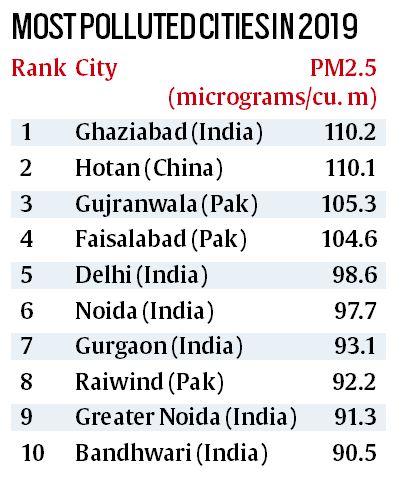
    • India accounts for two-thirds of the world’s most polluted cities — 21 of the most polluted 30 cities; 14 of the highest 20; and 6 of the highest 10 — in the report.
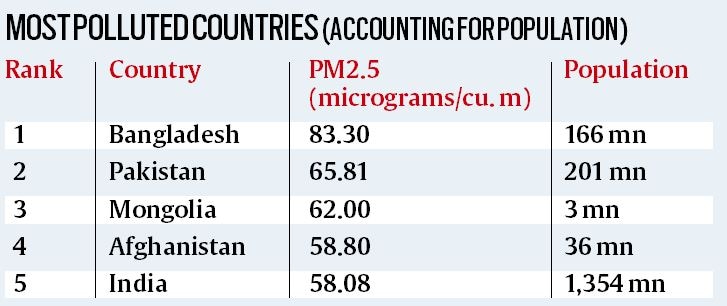
    • Among countries, when population is taken into account, average PM2.5 pollution is highest in Bangladesh, followed by Pakistan, while India is at number 5.
    • China is at number 11 in the list of countries affected by population, with population factored in. Chinese cities achieved a 9% average decrease in PM2.5 levels in 2019.
    • While cities in India, on average, exceed the WHO target for annual PM2.5 exposure by 500%, national air pollution decreased by 20% from 2018 to 2019, with 98% of cities experiencing improvements.
    • It said 90% of the global population breathing unsafe air.

    Top polluted Indian Cities


    Back2Basics

    PM 2.5

    • PM 2.5 refers to particulate matter (ambient airborne particles) which measure up to 2.5 microns in size and has a range of chemical makeups and sources.
    • It is widely regarded as the pollutant with the most health impact of all commonly measured air pollutants.
    • Due to its small size PM2.5 is able to penetrate deep into the human respiratory system and from there to the entire body, causing a wide range of short- and long-term health effects.
    • Particulate matter is also the pollutant group which affects the most people globally. It can come from a range of natural as well as man-made sources.
    • Common sources of PM include combustion (from vehicle engines, industry, wood and coal burning), as well as through other pollutants reacting in the atmosphere.
  • Pakke Tiger Reserve


    The government in Arunachal Pradesh is planning to build a 692.7 km highway through the 862 sq km Pakke Tiger Reserve (PTR). Named the East-West Industrial Corridor, the highway aims to connect Bhairabhunda in West Kameng district and Manmao in Changlang district along Arunachal Pradesh’s border with Assam.

    About Pakke Tiger Reserve (PTR)

    • Pakke Tiger Reserve, also known as Pakhui Tiger Reserve, is a Project Tiger reserve in the East Kameng district of Arunachal Pradesh.
    • The 862 km2 reserve is protected by the Department of Environment and Forest of Arunachal Pradesh.
    • This Tiger Reserve has won India Biodiversity Award 2016 in the category of ‘Conservation of threatened species’ for its Hornbill Nest Adoption Programme.
    • It falls within the Eastern Himalaya Biodiversity Hotspot.
  • Jalyukta Shivar Abhiyan

     Jalyukta Shivar, the flagship water conservation project launched by the earlier government has been officially scrapped by the present Maha government.

    What is Jalyukta Shivar?

    • Launched in December 2014 after Maharashtra experienced consecutive droughts, the project aimed at rolling out measures that could potentially mitigate water scarcity in the most drought-prone villages in a systematic manner.
    • Nearly 52 per cent of the state’s geographical area is prone to drought, either naturally or due to poor rainfall.
    • This includes Marathwada and adjoining areas of Madhya Maharashtra and large parts of Vidarbha.
    • The project targeted strengthening and streamlining existing water resources like canals, bunds and ponds by arresting maximum run-off rainwater during monsoon.
    • Tasks to widen and deepen natural water streams and connect them to nearby water storage facilities like earthen or concrete check-dams were proposed.
    • In the first phase, planned during 2015 – 2019, Jalyukta Shivar envisaged making 5,000 villages drought-free, every year.
    • During its proposed tenure, the government eyed at making 25,000 drought-prone villages water-sufficient.

    Was Jalyukta Shivar beneficial?

    • While the exact number of villages that were declared drought-free remains unknown, the programme attempted to bring water stress down in a majority of the most water-scarce villages in the state.
    • In January last year, then CM had announced that the scheme had transformed 16,000 drought-prone villages of Maharashtra.

    What is the future of water conservation in the state?

    • Geologists and hydrologists, who worked on implementing the project, shared similar views and hailed Jalyukta Shivar.
    • This was mainly due to the interventions undertaken in the existing water reserves, planned de-silting activities, among many others.
    • However, experts agreed that the scheme was not appropriately implemented.
    • Now with Jalyukta Shivar no longer in existence, focused efforts of the past five years, in most likelihood, will go down the drain unless a similar scheme is introduced.
    • With rainfall variations getting more pronounced, in addition to depleting groundwater reserves, the state will need concrete interventions to tackle future water requirements.
  • Future for the World’s Children Report 2020

    The Future for the World’s Children Report 2020 was recently released.

    About the report

    • The report was released by a commission of over 40 child and adolescent health experts from around the world after assessing 180 countries.
    • It was commissioned by the World Health Organization (WHO), UN Children’s Fund (UNICEF) and The Lancet medical journal.

    What is Flourishing Index?

    • Flourishing is the geometric mean of Surviving and Thriving.
    • For Surviving, the authors selected maternal survival, survival in children younger than 5 years old, suicide, access to maternal and child health services, basic hygiene and sanitation, and lack of extreme poverty.
    • For Thriving, the domains were educational achievement, growth and nutrition, reproductive freedom, and protection from violence.

    Threats to Children

    • The report highlights the distinct threat posed to children from harmful marketing.
    • Evidence suggests that children in some countries see as many as 30,000 advertisements on television alone in a single year, while youth exposure to vaping (e-cigarettes) advertisements increased by more than 250% in the U.S. over two years, reaching more than 24 million young people.
    • Studies in Australia, Canada, Mexico, New Zealand and the U.S. — among many others — have shown that self-regulation has not hampered commercial ability to advertise to children.
    • Children’s exposure to commercial marketing of junk food and sugary beverages is associated with the purchase of unhealthy foods and overweight and obesity, linking predatory marketing to the alarming rise in childhood obesity.
    • The number of obese children and adolescents increased from 11 million in 1975 to 124 million in 2016 — an 11-fold increase, with dire individual and societal costs, the report said.

    What is Sustainability Index?

    • Under the Sustainability Index, the authors noted that promoting today’s national conditions for children to survive and thrive must not come at the cost of eroding future global conditions for children’s ability to flourish.
    • It ranks countries on excess carbon emissions compared with the 2030 target.
    • This provides a convenient and available proxy for a country’s contribution to sustainability in future.

    Highlights of the SI

    • The report noted that under realistic assumptions about possible trajectories towards sustainable greenhouse gas emissions, models predict that global carbon emissions need to be reduced from 39·7 gigatonnes to 22·8 gigatonnes per year by 2030 to maintain even a 66% chance of keeping global warming below 1·5degrees C.
    • No country in the world is currently providing the conditions we need to support every child to grow up and have a healthy future alarmed the report.

    India’s performance

    India ranked 77th on a sustainability index that takes into account per capita carbon emissions and ability of children in a nation to live healthy lives and secures 131st spot on a flourishing ranking that measures the best chance at survival and well-being for children.

    Performance of nations in SI

    •  Norway leads the table for survival, health, education and nutrition rates – followed by South Korea and the Netherlands.
    • The central African Republic, Chad and Somalia come at the bottom.
    • However, when taking into account per capita CO2 emissions, these top countries trail behind, with Norway 156th, the Republic of Korea 166th and the Netherlands 160th.
    • Each of the three emits 210 per cent more CO2 per capita than their 2030 target, the data shows, while the U.S., Australia, and Saudi Arabia are among the 10 worst emitters.
    • The lowest emitters are Burundi, Chad and Somalia.
    • According to the report, the only countries on track to beat CO2 emission per capita targets by 2030, while also performing fairly — within the top 70 — on child flourishing measures are Albania, Armenia, Grenada, Jordan, Moldova, Sri Lanka, Tunisia, Uruguay and Vietnam.