💥Join UPSC 2027,2028 Mentorship (July Batch) + XFactor Notes & Microthemes PDF

GS Paper: GS3-02.Inclusive growth and issues therein

  • “Investment in infrastructure is essential for more rapid and inclusive economic growth.”Discuss in the light of India’s experience

    The World Bank defines infrastructure as “the basic physical and organizational structures and facilities needed for the operation of a society, enterprise, or system.” It is prerequisite for rapid, inclusive and sustainable growth.

    Importance of Investment in Infrastructure for Rapid Growth

    A 1% increase in infrastructure investment can raise output by 0.4% in the same year and by 1.5% in 4 years. (IMF)

    Modern transport, logistics and energy infrastructure reduce time and transaction costs and increase competitiveness.

    Boosts Manufacturing & Exports – Eg- Port led development under Sagarmala project

    Crowds in domestic private investment and FDI

    Facilitates Urbanisation and industrialization- Eg- industrial corridors, and smart cities support agglomeration economies and higher output.

    Energy Security through investments in renewables (48 % of the total installed capacity).

    Importance of Investment in Infrastructure for Inclusive Growth

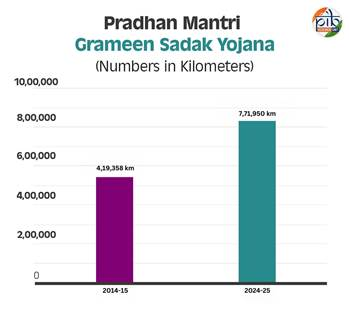
    Bridges Rural-Urban Divide- Rural roads, irrigation networks and decentralised energy systems enhance market access and livelihoods. Eg- PMGSY

    Access to Basic Services – Water supply, sanitation, healthcare facilities, and DPI ensure equitable access for vulnerable groups. Eg- Jal Jeevan Mission

    Balanced Regional Growth- Connectivity in tribal, hilly, and northeastern regions improves mobility, education access, and economic opportunity.

    Employment Generation for low-skilled and semi-skilled workers. Eg- The PM Gati Shakti initiative is expected to create 1 crore+ jobs by 2030.

    Improves standard of living – Eg- over 4Cr houses constructed under PMAY

    Women Empowerment – Eg- SBM improving access to sanitation

    India’s Experience – Achievements and Challenges

    India has the second largest road network in the world (1.5 lakh km National Highway)

    Ports & Logistics: Sagarmala increased port capacity beyond 2,600 MTPA.

    Digital Infrastructure: Aadhaar, UPI, BharatNet deepened digital inclusion.

    Energy: Renewable capacity crossed 240+ GW, improving energy security.

    Challenges

    Lack Of Integrated Policy- India has the second largest infrastructure deficit in the world (after Brazil)

    Financing Constraints: NIP requires Rs 111 lakh crore.

    Delays in Land Acquisition & Clearances slowing project execution. Eg- Mumbai Metro

    Urban Infrastructure Deficits: Eg- 17% population living in slums

    Logistics Inefficiencies: 13-14% logistics cost compared to 8-10% global average

    Poor concession agreements and litigation in PPP projects

    Neglect of social infrastructure – Eg- health and education spending at 1.9% and 4% of GDP only

    Inadequate R&D expenditure (0.7% of GDP) hinder the adoption of innovative solutions.

    Way Forward

    Strengthen PPP Models with better risk-sharing and transparent concession agreements. (Kelkar Committee recommendations)

    Accelerate Gati Shakti Platform for integrated planning and faster clearances.

    Increase Sustainable Financing via green bonds, NIIF, and development finance institutions.

    Focus on Climate-Resilient Infrastructure in coastal, drought-prone and flood-prone regions.

    Sustainable and high-quality infrastructure is a essential for realisation of a $40 Trillion economy by 2047.

  • Is inclusive growth possible under market economy? State the significance of financial inclusion in achieving economic growth in India.

    As per OECD, inclusive growth is economic growth distributed fairly across society and creates opportunities for all. A market economy drives efficiency and innovation, but without corrective policies it can widen inequalities.

    Inclusive Growth under Market Economy

    Efficient Resource Allocation- improve productivity, reduce costs, and expand economic opportunities.

    Market economies enable entrepreneurship, MSME growth and innovation-driven jobs. Eg- Indian start-up ecosystem.

    State as an Enabler- Government gets resources to invest in public goods.

    Property rights, contract enforcement and regulatory frameworks ensure fairness.

    Technological development enabling inclusive development – Eg- DBT.

    Challenges to Inclusive Growth under a Market Economy

    Rising inequality– Eg- the top 1% control 40% of net personal wealth.

    Regional disparities due to unequal investment and infrastructure. Eg- BIMARU States

    Jobless growth – Service sector contributes 55% of GDP but employs less than 30% workforce

    Weak social protection for informal workers (over 85% of India’s workforce).

    Market failures in public goods. Eg- Digital Apartheid in Education

    Significance of Financial Inclusion in Achieving Economic Growth in India

    Enhanced credit access for MSMEs, SHGs – boosts investment and employment. Eg. PM MUDRA has sanctioned over since inception.

    Greater savings through Jan Dhan accounts (53 crore accounts) ensures financial stability

    Formalisation of the economy via UPI, GSTN, Aadhaar – wider tax base and better compliance.

    Poverty reduction through targeted DBT, eliminating leakages and improving consumption.

    Women’s economic empowerment through SHG-bank linkage, Stand-Up India, digital microcredit – raises household productivity.

    Rural economic growth through Kisan Credit Cards, PM-Kisan and digital banking in villages.

    Improved risk management via insurance (PMJJBY, PMSBY) and pensions (PM-SYM) – stabilises vulnerable households.

    Boost to digital economy with UPI handling over – strengthens service sector growth.

    Inclusive growth under a market economy is possible when markets are balanced with public investment, regulation and financial inclusion.

  • Examine the pattern and trend of public expenditure on social services in the post-reforms period in India. To what extent this has been in consonance with achieving the objective of inclusive growth?

    Since the 1991 reforms, India shifted to a market-oriented growth model. Public expenditure on social services increased from 5% of GDP (1990s) to 8% (2024-25)

    Trend of Public Expenditure on Social Services in the Post-Reforms Period

    Early Post-Reform Phase (1991-2005)

    Low and stagnant spending around 5% of GDP due to fiscal consolidation.

    Prioritisation of basic education – expansion of SSA, mid-day meal.

    Health expenditure remained low at 1% of GDP, high OOPE.

    Rights-Based Expansion Phase (2005-2015)

    Public expenditure rose to 6-7% of GDP.

    Introduction of major rights-based entitlements: MGNREGA (2005), RTI, RTE (2009), NFSA (2013).

    Focus on rural livelihood missions, inclusion programmes. Eg- DAY-NRLM

    Post-2015 Period

    Social sector spending increased to 8% of GDP (2021-22).

    Health spending reforms – decline in OOPE from 65% to 40% (2014-2024).

    Women Specific schemes: Eg- Ujjwala (10 crore LPG connections)

    Emphasis on social security. Eg- e-Shram, PM Garib Kalyan Anna Yojana.

    Increased focus on skill development, digital inclusion. Eg- JAM Trinity, PM-KVY

    In consonance with Inclusive Growth

    Extreme poverty fell from 16.2 % in 2011-12 to just 2.3 % in 2022-23

    MGNREGA, NFSA ensured income security and food security (67% population coverage).

    Human Capital Improvement – Life expectancy increased from 58 years (1990) to 73 years.

    Regional Inclusion – Aspirational Districts improved health, education, and infrastructure indicators in 112 lagging districts.

    Women Empowerment – Eg- 45% women representation in PRIs

    Limitations and Challenges

    Rural-Urban Divide Persists – Urban per capita income is 2x rural.

    Only 24-25% of the population has any formal social protection.

    Poor Learning Outcomes

    50% of Class 5 students cannot read Class 2 text (ASER).

    50% of graduates are employable only (India Skills Report).

    Low Public Health Spending – Still around 1.9% of GDP, below the global average of 6%.

    Inclusion-Exclusion errors and Leakages in PDS.

    High Inequality – Top 10% hold 77% of national wealth (Oxfam).

    Capability Approach (Amartya Sen) by increasing Education and health spending to 6% and 2.5% of GDP respectively is needed for ‘Sabka Saath, Sabka Vikas.’
  • Distinguish between the Human Development Index (HDI) and Inequality-adjusted Human Development Index (IHDI) with special reference to India. Why is the IHDI considered a better indicator of inclusive growth?

    The Human Development Index (HDI), introduced by UNDP in 1990, measures a country’s progress in terms of health, education, and income. The Inequality-adjusted Human Development Index (IHDI), introduced in 2010, refines HDI by factoring in inequality of distribution of these achievements.

    India’s Human Development Performance

    Human Development Index (HDI)

    Rank improved from out of 193 countries.

    Since 1990, HDI improved by 53%, outpacing global and South Asian averages.

    Inequality-adjusted Human Development Index (IHDI)

    India suffers a 30.7% loss due to inequality.

    Poorest 40% hold only 20.2% of income, while the richest 10% hold 25.5%.

    Why IHDI is a Better Indicator of Inclusive Growth

    Accounts for Inequality – Unlike HDI, IHDI reduces scores based on income, education, and health disparities, showing the real distribution of gains.

    Closer to Ground Reality – Reflects what people actually experience, not just national averages. For India, 30.7% loss of human development due to inequality.

    Reveals Hidden Gaps – Exposes divides across region, caste, class, and gender that HDI alone masks. Eg- gender gap in Labour Force Participation Rate

    Guides Policy Better – Eg- targeted schemes like PM Poshan Abhiyan or Eklavya Model Schools

    Captures Inter-generational Equity – By highlighting disparities, it stresses need for equal opportunities for long-term human development.

    Comparative Value – Countries with similar HDI can differ widely in IHDI, revealing which societies are more inclusive.

    Supports SDGs – Aligns with SDG 10 (Reduce Inequality) and SDG 1 (No Poverty) by showing inequality-adjusted outcomes.

    As Amartya Sen observed, “Development is about expanding freedoms.” HDI shows progress, but IHDI shows whether that progress is fairly shared.

    Government Budgeting

  • Increasing coverage, growing distress

    Why in the News?

    Recent NSS 80th Round (2025) data reveals a striking contradiction: health insurance coverage has increased significantly since 2017-18, yet hospitalisation rates have not improved and out-of-pocket expenditure has sharply increased, especially in private hospitals. This is significant because, for the first time, empirical evidence shows that government-funded insurance schemes are not delivering financial protection, and may even be benefiting relatively better-off groups.

    Why has increased insurance coverage not improved healthcare utilisation?

    1. Stagnant hospitalisation rates: NSS data shows hospitalisation rates remain below 2014 levels in rural areas and only marginally higher in urban areas.
    2. Shift to private care: Public hospital usage declined, while private sector reliance increased.
    3. Access barriers: Unavailability of medicines, diagnostics, and high transport costs reduce public healthcare utilisation.
    4. Inefficiency in coverage translation: Coverage expansion does not ensure actual service delivery or utilisation.

    Why is out-of-pocket expenditure increasing despite insurance schemes?

    1. Rising private sector costs: OOP expenditure increased >70% (rural) and ~80% (urban).
    2. Partial coverage: Insurance schemes often exclude diagnostics, medicines, and indirect costs.
    3. Additional charges: Despite coverage, patients are frequently charged extra in private hospitals.
    4. Low reimbursement rates: Below-market rates under PMJAY incentivise informal billing practices.

    Why are insurance schemes disproportionately benefiting the better-off?

    1. Urban bias: Only 13% of urban beneficiaries belong to the poorest class.
    2. Awareness gap: Poor households have lower awareness and utilisation capacity.
    3. Private sector access: Better-off groups are more capable of accessing empanelled private hospitals.
    4. Structural inequality: Insurance design fails to address social determinants of access.

    What fiscal and systemic challenges are emerging from insurance-led healthcare?

    1. State fiscal stress: Increased hospitalisation under schemes leads to budgetary pressure on states.
    2. Delayed reimbursements: States like Haryana report delays in payments to private providers.
    3. Dependence on private sector: Weak public infrastructure leads to over-reliance on private providers.
    4. Market distortion: Insurance subsidies indirectly support private healthcare expansion.

    Is insurance-based Universal Health Coverage (UHC) viable for India?

    1. Profit-driven incentives: Private providers focus on high-margin treatments, undermining equity.
    2. Limited preventive care: Insurance model emphasises hospitalisation, not primary care.
    3. Weak regulation: Insufficient oversight leads to overcharging and unnecessary procedures.
    4. Public system neglect: Investment in primary healthcare remains inadequate.

    What alternative model is suggested for effective healthcare delivery?

    1. Strengthening public healthcare: Emphasis on universal, tax-funded public health systems.
    2. Primary care focus: Initiatives like Ayushman Arogya Mandir (AAM) offer comprehensive primary care, including NCDs.
    3. Integrated approach: Combining preventive, promotive, and curative care
    4. Regulation of the private sector: Ensures accountability and cost control.

    Conclusion

    India’s health insurance expansion highlights a structural paradox: coverage without care and protection without affordability. A shift from insurance-led to system-strengthening approaches, especially in primary healthcare, is essential for achieving equitable and sustainable Universal Health Coverage.

    PYQ Relevance

    [UPSC 2022] Is inclusive growth possible under market economy? State the significance of financial inclusion in achieving economic growth in India.

    Linkage: The PYQ highlights the gap between coverage expansion (financial inclusion) and actual welfare outcomes, similar to health insurance failing to ensure real protection. This is directly relevant to analysing whether insurance-led healthcare promotes inclusive growth or deepens inequality.

  • Behind worker’s protest: High costs, stagnant wages

    Why in the News?

    Recent protests by factory workers in Noida, Ghaziabad and Manesar have brought attention to a sharp divergence between rising inflation and stagnant wages. CPI-IW (base year 2016) shows industrial worker inflation rising by 24.8% nationally (Feb 2021-Feb 2026), while key industrial clusters recorded even higher inflation: 27.9% in Gurugram, 27.2% in Faridabad, and ~27.4% in Ghaziabad, Noida, and Delhi. In contrast, minimum wages increased at a much slower pace, Haryana (~15%), Delhi (~20.6%), Uttar Pradesh (~24.6%). This widening gap has reduced real wages, triggering protests.

    Why are workers protesting despite periodic wage revisions?

    1. Real Wage Erosion: Indicates decline in purchasing power; inflation (24.8%) exceeded wage growth across states.
    2. Regional Inflation Spike: Shows concentrated distress; Gurugram (27.9%), Faridabad (27.2%), Noida/Delhi (~27.4%).
    3. Inadequate Wage Growth: Reflects disparity. In Haryana, wages saw a lower increase (~15%) compared to the ~27.9% inflation rate before the April 2026 revision. Similarly, in Uttar Pradesh, the 10-year wage increase (42%) is significantly lower than the cost of living increase, resulting in lower real wages compared to a decade ago.
    4. Cost of Living Pressures: Includes rent, LPG, food; example, workers report LPG cylinder costs exceeding ₹4,000 in informal markets.
    5. Expectation Gap: Indicates mismatch between announced revisions and actual income improvements.

    How has inflation outpaced wages structurally?

    Inflation has structurally outpaced wage growth in India by creating a persistent gap where rising living costs (food, rent, fuel) consistently exceed nominal salary adjustments, leading to a decline in real purchasing power. This phenomenon is driven by a failure in the wage-indexation mechanism, regional disparities in inflation, and a shift towards variable pay that does not match the rapid rise of essentials.

    1. CPI-IW Linkage Failure: Shows weak adjustment of wages with CPI-IW (base 2016).
      1. Weak Adjustment: Wage revisions, particularly in manufacturing, often lag behind CPI-IW movements, meaning workers feel the price rise long before they receive any compensation.
      2. Time Lag: The 6-monthly Variable Dearness Allowance (VDA) adjustment is often too slow during high-inflation periods, leaving workers vulnerable
    2. National vs Regional Gap: Demonstrates divergence; national inflation (24.8%) lower than industrial clusters (~27%).
    3. Nominal vs Real Wages: Indicates nominal increase but real decline.
      1. While nominal salaries have increased (often 8-10% annually), the “real wage” (purchasing power) has remained flat or declined because essential costs have risen faster.
    4. Multi-component Inflation: Includes housing, fuel, food simultaneously rising.
      1. Housing & Fuel: Fuel costs rise and feed into logistics and travel, increasing costs of goods. Rent in urban industrial areas also frequently spikes, placing pressure on lower income brackets.
      2. Food and Beverages: This category, taking a high weight in worker consumption, often witnesses high volatility and consistent upward pressure, hitting low-income households hardest
    5. Labour Bureau Data: Labour Bureau data highlights that corporate profits in many sectors (e.g., manufacturing/engineering) have grown much faster than wage shares.
      1. Wage-Share Decline: Between 2015 and 2023, corporate profits as a share of GDP rose from 3.8% to 5.2%, while the wage share declined.
      2. Productivity Gap: Indian workers are becoming more productive (higher output per worker), but these gains are translating into corporate profits rather than increased wage rates, resulting in a structural gap

    What are the new Labour Codes and what do they assure?

    1. Code on Wages, 2019: Ensures universal minimum wage and timely payment across sectors.
    2. Industrial Relations Code, 2020: Regulates hiring, firing, and dispute resolution mechanisms.
    3. Code on Social Security, 2020: Extends social protection to unorganised and gig workers.
    4. Occupational Safety, Health and Working Conditions Code, 2020: Ensures safety standards, working hours, and welfare provisions.
    5. Assurance Framework: Establishes 8-hour workday norm, 48-hour weekly cap, overtime compensation, and safe working conditions.

    What is happening in implementation on the ground?

    1. Delayed Notification: While effective from Nov 2025, not all state rules are fully notified or uniformly enforced, leading to partial implementation.
    2. Employer Discretion: The flexibility provided has seen reports of increased working hours (up to 12 hours/day) and worker complaints about non-payment or underpayment of overtime, particularly in manufacturing hubs.
    3. Worker Complaints: Highlights non-payment or underpayment of overtime in factories in Noida and Manesar.
    4. Administrative Gaps: Demonstrates lack of inspection and enforcement capacity.
      1. There is a notable lack of enforcement capacity, with a shift from “Inspector Raj” to an “Inspector-cum-Facilitator” system.
    5. Transition Uncertainty: Reflects confusion during shift from old laws to new codes.

    Why is there confusion around working hours and overtime?

    1. Definition Gaps: Shows ambiguity between “working hours” and “spread-over”; example-12-hour presence including breaks treated as normal shift in some factories.
    2. State-Level Rules: Indicates variation; example: different states interpreting overtime eligibility differently under draft rules.
    3. Spread-over Norms: Includes rest intervals within 12-hour cap; example: worker present for 12 hours but paid for 8 hours citing breaks.
    4. Overtime Ambiguity: Highlights unclear thresholds; example: workers exceeding 8 hours not always compensated at double rate.
    5. Inspection Challenges: Demonstrates weak monitoring; example: industrial clusters with limited labour inspections.

    What are the structural issues in wage determination?

    1. Irregular Revision Cycle: Shows failure of annual revision mechanism.
    2. State Disparity: Indicates uneven wage standards across Haryana, UP, Delhi.
    3. Categorisation Complexity: Includes multiple wage categories (skilled/unskilled).
    4. Pandemic Disruption: Highlights delayed revisions during Covid-19 period.
    5. Weak Enforcement: Demonstrates gaps in compliance monitoring.

    What are the broader economic implications?

    1. Demand Compression: Reduces consumption due to declining real incomes.
    2. Labour Unrest: Increases frequency of industrial protests.
    3. Productivity Impact: Affects industrial output in key clusters.
    4. Informalisation: Encourages off-the-books employment practices.
    5. Inequality Expansion: Widens gap between labour and capital incomes.

    Way Forward

    1. CPI-Linked Wage Indexation: Ensures automatic revision of minimum wages with CPI-IW; prevents real wage erosion amid 24-28% inflation trends.
    2. Clear Labour Code Rules: Defines working hours, overtime, and spread-over explicitly; removes ambiguity in 12-hour shift interpretation.
    3. Uniform National Floor Wage: Establishes enforceable baseline wage across states; reduces disparities such as Haryana vs Uttar Pradesh.
    4. Overtime Enforcement Mechanism: Ensures double wages beyond 8 hours; strengthens compliance in industrial clusters like Noida-Manesar.
    5. Strengthened Labour Inspection System: Deploys digital inspections and audits; improves enforcement and reduces informal labour practices.

    Conclusion

    The divergence between inflation and wage growth reflects structural inefficiencies in India’s labour economy. Strengthening CPI-linked wage revision, ensuring clarity in Labour Code rules, and improving enforcement mechanisms remain essential.

    PYQ Relevance

    [UPSC 2024] Discuss the merits and demerits of the four ‘Labour Codes’ in the context of labour market reforms in India. What has been the progress so far in this regard?

    Linkage: The PYQ directly aligns with the article’s focus on Labour Codes, especially issues of implementation, wage protection, and working-hour ambiguities. It extends the debate from policy intent (merits) to ground realities (demerits), including wage stagnation, enforcement gaps, and labour unrest.

  • Startup India Fund of Funds (FoF) 2.0  

    Why in the News?

    • Government notified Startup India FoF 2.0 (April 13, 2026) with a ₹10,000 crore corpus to boost startup funding.

    About FoF 2.0

    What it is

    • A government-backed Fund of Funds
    • Invests in: Alternative Investment Funds
    • These AIFs then invest in startups
      • Indirect funding mechanism (not direct investment)

    Institutional Framework

    • Nodal Department: Department for Promotion of Industry and Internal Trade
    • Implementation Agency: Small Industries Development Bank of India
    • Regulator for AIFs: Securities and Exchange Board of India

    Background

    • FoF 1.0 (2016) under Startup India Action Plan
    • FoF 2.0 builds on it with:
      • More focus on advanced technologies
      • Stronger capital mobilization
    [2025] With reference to investments, consider the following: 
    I. Bonds 
    II. Hedge Funds 
    III. Stocks
    IV. Venture Capital 
    How many of the above are treated as Alternative Investment Funds? 
    (a) Only one (b) Only two (Hedge Funds and Venture Capital) (c) Only three (d) All the four
  • AI’s impact on labour market: Anthropic’s report flags high exposure 

    Why in the News?

    Artificial Intelligence is increasingly reshaping labour markets worldwide. A recent report by Anthropic shows that jobs involving digital tasks, cognitive work, and routine analysis face higher automation risks due to large language models (LLMs). This shift has implications for skills, education, and employment policies, especially for countries like India, where millions work in IT, services, and BPO sectors.

    What does the Anthropic report reveal about AI exposure in labour markets?
    The Anthropic report marks one of the first systematic attempts to measure real-world labour market exposure to AI rather than relying only on theoretical predictions.

    1. New Measurement Metric- “Observed Exposure”: Introduces a framework combining LLM technical capabilities with real-world usage data from Claude AI systems, enabling more accurate estimation of AI’s impact on jobs.
    2. High Exposure in Digital Occupations: Identifies sectors such as business and finance, management, computer science, engineering, legal services, and office administration as highly exposed to AI-driven automation.
    3. Striking Capability Statistic: Finds that LLMs are theoretically capable of performing up to 94% of tasks performed by computer and mathematics workers.
    4. Real Adoption Gap: Notes that despite this capability, Claude currently performs only about 33% of such tasks, indicating that technological potential exceeds current adoption.
    5. Declining Hiring Trends: Observes a 14% decline in hiring for younger professionals (22-25 years) in highly exposed occupations.
    6. Gender Dimension: Highlights that women constitute 54.4% of high-exposure roles compared to 38.8% of low-exposure roles, indicating potential gendered labour market impacts.
    7. Indian Context: A NITI Aayog report titled “Roadmap for Job Creation in the AI Economy” warns that over 60% of formal-sector jobs, particularly in IT services and BPO sectors employing over 6 million people, could face automation risks by 2030.

    How does the report measure AI exposure in the labour market?

    1. Observed Exposure Metric: Measures the extent to which AI is actually used in real work tasks by analysing usage patterns of Anthropic’s Claude AI model.
    2. Combination Approach: Integrates theoretical capability of LLMs with empirical usage data, creating a realistic understanding of labour market disruption.
    3. Correlation with Job Trends: Tests exposure levels against US government employment projections and unemployment survey data to identify links between AI exposure and labour market trends.
    4. Evidence-Based Findings: Establishes that higher AI exposure correlates with weaker job growth and rising job losses in certain occupations.

    Which sectors face the highest AI disruption risks?

    1. Business and Finance: AI systems can perform financial analysis, data interpretation, and report generation, increasing automation potential in financial services.
    2. Management Occupations: AI supports strategic planning, data analytics, and decision-support tools, reducing reliance on routine managerial tasks.
    3. Computer and Mathematical Jobs: LLMs show the highest capability in coding, debugging, and software documentation tasks, with theoretical capability covering 94% of such tasks.
    4. Legal Sector: AI assists in contract analysis, legal research, and document drafting, increasing exposure in legal professions.
    5. Office and Administrative Work: Routine administrative functions such as documentation, scheduling, and record management are highly susceptible to automation.

    Why are digital and knowledge-sector jobs more vulnerable than manual jobs?

    1. Digitisation of Work: Tasks performed in digital environments are easier for AI systems to replicate using algorithms and machine learning models.
    2. Routine Cognitive Tasks: AI excels in pattern recognition, data processing, and repetitive analytical tasks.
    3. Physical Constraints: Manual occupations involving physical movement, craftsmanship, or real-world interaction remain difficult for AI systems to automate.
    4. Lower AI Applicability in Manual Sectors: Industries such as construction, agriculture, protective services, and personal care show relatively lower AI exposure.

    How could AI affect employment patterns and demographics?

    1. Impact on Young Workers: Hiring in highly exposed occupations for workers aged 22-25 years has declined by 14%, suggesting reduced entry-level opportunities.
    2. Gender Disparity: Women represent 54.4% of high-exposure jobs, indicating disproportionate vulnerability in AI-driven labour market changes.
    3. Highly Educated Workforce Exposure: AI disruption is concentrated in graduate-level occupations, highlighting risks for knowledge workers rather than low-skilled labour.
    4. Occupational Polarisation: AI may lead to growth in high-skill innovation roles and low-skill manual jobs, while shrinking middle-skill occupations.

    What implications does AI disruption have for India?

    1. IT and BPO Sector Risks: Over 60% of formal-sector jobs in IT services and BPO industries may face automation pressures by 2030.
    2. Employment Scale: These sectors currently employ over 6 million people in India, making AI disruption economically significant.
    3. Stock Market Response: Shares of TCS, Wipro, and Infosys declined nearly 20% over the past year, reflecting investor concerns about AI-driven automation.
    4. Skill Gap Challenge: Limited mathematical and scientific skill levels among large segments of the population could hinder adaptation to AI-driven economies.
    5. Low R&D Investment: India’s low spending on research and development compared to the US and China reduces its capacity to lead in AI innovation.

    Can AI also create opportunities in traditional sectors?

    1. Precision Agriculture: AI-enabled analysis of satellite imagery, weather forecasts, soil data, and crop patterns enables farmers to optimise sowing and harvesting decisions.
    2. Agricultural Risk Reduction: AI systems provide early warnings about pests and diseases, improving crop protection.
    3. Resource Optimisation: AI helps farmers determine fertiliser use, irrigation requirements, and input efficiency.
    4. Policy Initiatives: The Union Budget 2026–27 proposed the Bharat-VISTAAR system (Virtually Integrated System to Access Agricultural Resources) to integrate AgriStack platforms with ICAR research data.

    Conclusion

    Artificial Intelligence is reshaping the nature of work by transforming how tasks are performed rather than simply eliminating jobs. The Anthropic report highlights that occupations involving digital and cognitive tasks face the greatest exposure to AI-driven automation. For India, where millions depend on knowledge-sector employment, the challenge lies in strengthening skills, promoting AI innovation, and ensuring that technological progress complements rather than displaces human labour.

    PYQ Relevance

    [UPSC 2023] Introduce the concept of Artificial Intelligence (AI). How does AI help clinical diagnosis? Do you perceive any threat to privacy of the individual in the use of AI in healthcare?

    Linkage: This question directly relates to the applications and societal implications of AI, similar to how the article discusses AI transforming labour markets and professional work.

  • How did the space sector fare in the budget?

    Why in the News

    The Union Budget shows stable funding for the space sector after post-pandemic adjustments, following a 182% increase in allocations over the last decade. This reflects a shift from rapid expansion to fiscal consolidation. For the current year, the Budget has maintained broadly similar allocations for space activities, ensuring continuity for ISRO’s core programmes rather than announcing a major increase. However, industry bodies such as SatCom Industry Association (SIA)-India and Indian Space Association (ISpa) note that this stability has come without structural reforms, particularly in GST rationalisation, downstream enablement, and private sector incentives. The article highlights a gap between India’s space liberalisation framework, led by IN-SPACe, and the limited fiscal and regulatory support provided in the Budget.

    Has budgetary support for the space sector stabilised?

    1. Stabilised Allocations: Reflect a post-pandemic correction after a 182% increase in space spending over the past decade, signalling fiscal consolidation rather than retrenchment.
    2. Institutional Continuity: Ensures operational stability for ISRO, whose budget had earlier faced compression during COVID-19 years.
    3. Limited Expansion Signal: Indicates absence of new large-scale mission announcements or funding surges, reinforcing a maintenance-oriented fiscal posture.

    Does the Budget address structural reforms in the space ecosystem?

    1. Reform Gap: Ignores long-standing demands raised by SIA-India for taxation and policy rationalisation to support private and downstream firms.
    2. Public-sector Bias: Continues to prioritise ISRO’s upstream capabilities while underplaying ecosystem-wide enablement.
    3. Missed Alignment: Fails to integrate fiscal measures with the institutional role of IN-SPACe, which was created precisely to facilitate private participation.

    How does GST affect space industry competitiveness?

    1. GST Burden: High GST incidence on specialised inputs and imported components raises production costs for satellite and launch manufacturers.
    2. Cash-flow Stress: Refund delays under GST disproportionately affect private firms and startups operating under thin margins.
    3. Export Competitiveness: Weakens India’s cost advantage in global launch and satellite service markets, a concern explicitly flagged by industry bodies.

    What challenges exist for downstream space applications?

    1. Neglect of Applications: Budgetary focus remains skewed towards upstream launch and satellite programmes, with minimal fiscal support for applications.
    2. Commercial Bottlenecks: Affects communication, navigation, earth observation, and data analytics sectors that rely on satellite services.
    3. Innovation Constraints: Absence of PLI-type incentives for space manufacturing and services limits scale-up and market absorption.

    Is private participation adequately supported?

    1. Policy-Finance Disconnect: While liberalisation has been institutionalised through IN-SPACe, fiscal incentives remain absent.
    2. Investment Uncertainty: The Budget does not build upon the ₹1,000 crore venture capital fund announced in the previous Budget, offering no clarity on deployment or expansion.
    3. Ecosystem Imbalance: Growth remains anchored to state-led capabilities rather than a diversified commercial space economy.

    Conclusion

    The Budget secures stability for India’s space programme but does not translate liberalisation intent into fiscal or regulatory support. By overlooking GST reform, downstream incentives, and private investment facilitation, it risks slowing the transition from an ISRO-centric model to a competitive, market-driven space economy.

    PYQ Relevance

    [UPSC 2016] Discuss India’s achievements in the field of Space Science and Technology. How has the application of this technology helped India in its socio-economic development?

    Linkage: Space science and technology is a recurring GS-III theme, testing India’s indigenous technological capacity and its role in national development. The current Budget debate on space highlights the shift from mission achievements to ecosystem sustainability, making the socio-economic application and commercialisation of space technologies a critical evaluative dimension.

  • PFRDA forms high-level committee for assured payouts under NPS

    Why in the news?

    The Pension Fund Regulatory and Development Authority (PFRDA) has constituted a high-level committee to frame guidelines and regulations for assured pension payouts under the National Pension System (NPS), aimed at strengthening retirement income security.

    About the committee

    • Chairperson: Dr. M. S. Sahoo, Former Chairperson, Insolvency and Bankruptcy Board of India (IBBI)
    • Composition: 15 members from legal, actuarial, finance, insurance, capital markets and academia
    • Flexibility: Power to invite external experts and intermediaries as special invitees
    • Nature: Standing advisory committee on structured pension payouts

    Key objectives and terms of reference

    • Assured payout framework: Draft regulations for assured and structured pension payouts, based on PFRDA consultation paper dated 30 September 2025
    • Seamless transition: Smooth shift from accumulation phase to decumulation payout phase
    • Market based assurance: Explore novation and settlement mechanisms for legally enforceable guarantees
    • Operational design: Define lock in period, withdrawal limits, pricing mechanisms and fee structures
    • Risk and legal oversight: Specify capital and solvency norms and examine tax implications for in-system payouts
    • Consumer protection: Standardised disclosure framework to prevent mis selling and manage subscriber expectations

    Significance

    • Enhances predictability and security of retirement income
    • Strengthens trust and attractiveness of NPS
    • Supports the vision of Viksit Bharat 2047 with financial dignity in old age
    [2017] Who among the following can join the National Pension System (NPS)? 

    (a) Resident Indian citizens only 

    (b) Persons of age from 21 to 55 only 

    (c) All State Government employees joining the services after the date of notification by the respective State Governments 

    (d) All Central Governments Employees including those of Armed Forces joining the services on or after 1st April, 2004