Why in the News
The US President has promised a dividend of $5,000 to every adult citizen of the United States if the Republican Party retains control of Congress at the November midterm elections, describing it as a return on the country’s economic strength. The promise imports into a rich economy an instrument Indian parties have used for two decades. In India, Direct Benefit Transfers (DBT), the routing of welfare money straight into a beneficiary’s bank account, were built on the Jan Dhan, Aadhaar and Mobile (JAM) trinity under the second United Progressive Alliance government, and every party now carries cash handouts in its manifesto. The Prime Minister warned against a “revdi culture” in July 2022, and his own party’s state units went on to make cash transfers central to their poll strategy. The contested point is whether an instrument with this universal electoral pull is welfare policy or a substitute for a state that has not delivered health, education and skilling.
What is a Direct Benefit Transfer based cash transfer?
- Direct Benefit Transfer: Welfare money is credited directly to an identified beneficiary’s bank account instead of reaching them as a subsidised good or a service.
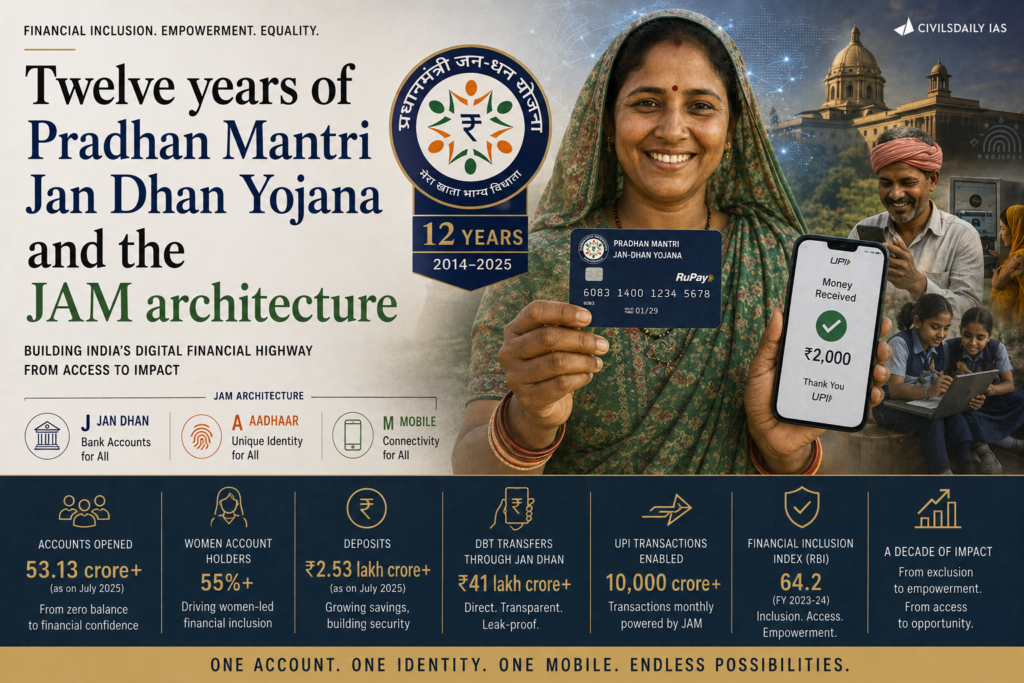
- The JAM rails: A Jan Dhan bank account, an Aadhaar number for identification and a mobile number for authentication together make the credit instantaneous and traceable.
- Unconditional transfer: The recipient has to satisfy an eligibility filter such as being an adult woman, and nothing more. No school attendance, health check or work requirement attaches to the payment.
Why does a cash dividend appeal to voters in the world’s richest economy?
- Per capita income gap: US annual per capita income is $94,430, almost 34 times India’s $2,813, so a flat payment reads very differently at each end of that range.
- Bottom quintile: Mean household income of the poorest 20 per cent of Americans is $17,132 a year, per the 2024 American Community Survey of the US Census Bureau. A $5,000 payment is more than 100 days of that household’s annual income.
- Second quintile: The next 20 per cent has a household income of $48,852 a year, so the same payment is a little over a month’s income.
- Concentration at the top: Annual household income of the top 5 per cent is $5,25,113, more than 30 times the mean of the bottom 20 per cent. A flat transfer is therefore a large sum for the bottom of a rich country and a rounding error at its top.
How large is the fiscal commitment behind these promises?
- Cost of the US dividend: About 245 million citizens are over 18, per US Census Bureau 2024 data, putting the cost of the promise at at least $1 trillion.
- Scale against India: That sum is close to a fourth of India’s entire GDP of $3.92 trillion in 2025 to 26.
- State transfers in India: The Sixteenth Finance Commission estimates large group unconditional cash transfers by states at Rs 1.96 lakh crore in 2025 to 26, roughly $20 billion, the bulk of it going to women in Maharashtra, Karnataka and West Bengal.
- Approval risk: The US dividend is a promise and not an appropriation. It requires the United States Congress to approve the spending.
How did cash transfers become the common instrument of Indian electoral politics?
- Origin in delivery reform: DBT began as a leakage reduction measure under the second United Progressive Alliance government, built on the JAM trinity rather than on an electoral calculation.
- The electoral discovery: An advisor to that government framed the appeal in terms of funds reaching a voter’s account at the click of a mouse ahead of an election.
- Cross party adoption: Regional parties, the Congress and the Bharatiya Janata Party all now carry cash handouts to sections of their voter base in their manifestos.
- Reversal of a stated position: The Prime Minister’s July 2022 warning against the practice was followed by his own party’s state units adopting it, producing a competitive escalation between state units, regional parties and the Congress.
What does the spread of cash transfers reveal about the state?
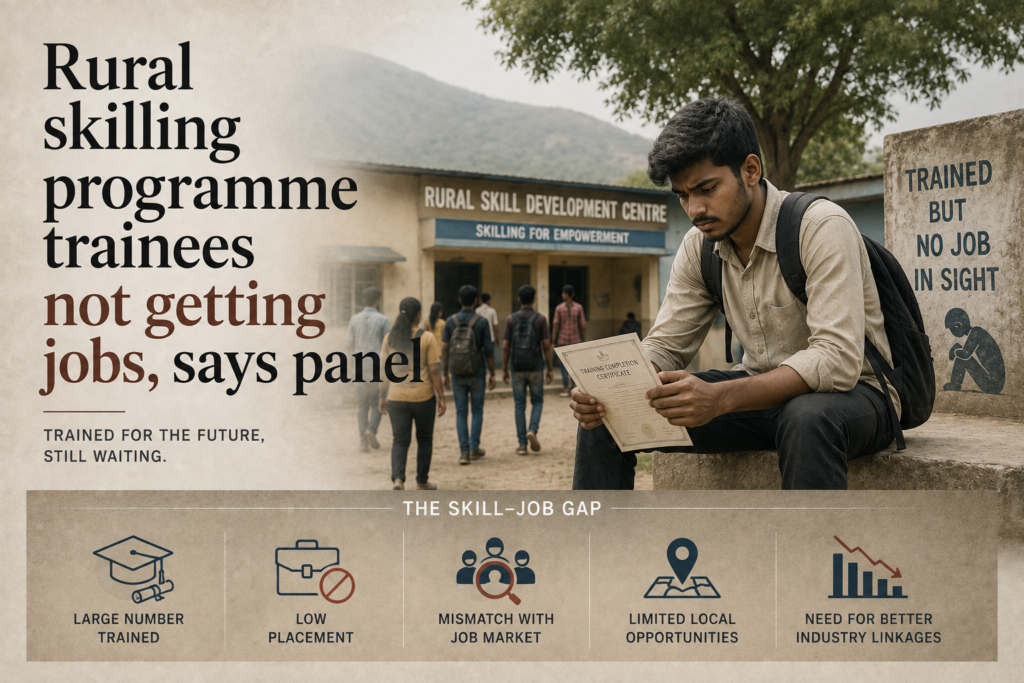
- A political economy fallout: Cash transfers expanded because the state failed on health, education and skilling, leaving parties to offer money in place of services.
- Substitute forms of security: The same failure produces minimum income through job guarantees, cash in the hands of women and allowances for the literate but jobless, each of them a payment standing in for a missing service.
- Universality of the instrument: A rich economy with 34 times India’s per capita income reaches for the same device, which shows the appeal is electoral rather than developmental.
Challenges to unconditional cash transfers
- Recurring outlay against capital spending: A monthly transfer becomes a permanent charge on a state budget and competes with capital spending on hospitals, schools and water supply. Eg. Maharashtra’s Ladki Bahin scheme and Karnataka’s Gruha Lakshmi are annual recurring commitments rather than one time payments.
The Fix: Report unconditional transfer outlay as a disclosed share of a state’s own revenue receipts in every annual budget document. - Absence of human capital conditionality: An unconditional payment asks nothing of the household, so it does not move school attendance or immunisation. Eg. Mexico’s Progresa linked benefits to school attendance and health check ups, and Brazil’s Bolsa Familia used conditional transfers to lift 36 million people out of poverty.
The Fix: Attach verifiable attendance and immunisation conditions where the delivery system can already confirm them. - Exclusion through the identification layer: Eligibility rests on databases, and a household with unseeded or mismatched records drops out of the list without knowing why. Eg. Aadhaar seeding failures have removed ration card holders from beneficiary lists in Jharkhand.
The Fix: Provide an offline grievance and reinstatement route at the block level with a fixed disposal deadline. - Pressure off the public provider: Cash allows a household to buy the private service the state failed to supply, which removes the political pressure to repair the public one. Eg. Out of pocket spending on private hospitals remains a leading route into household impoverishment in India.
The Fix: Publish a service availability audit of the relevant public facilities alongside each transfer scheme.
Conclusion
A cash transfer buys immediate relief and buys it visibly, which is why it has crossed from a lower middle income democracy to the richest one. It does not build a health centre, staff a school or train a worker, and the states expanding it fastest are the ones whose service delivery gaps created the demand for it. The tension is unresolved: the instrument is popular precisely because the public system it compensates for has not been fixed, and every rupee committed to the transfer makes fixing that system harder to finance.
What is Inclusive Growth?
- About: Inclusive growth is economic growth distributed fairly across society that creates opportunity for all, as defined by the Organisation for Economic Co operation and Development (OECD).
- Rationale: It entered India’s stated policy goals with the Eleventh Five Year Plan (2007 to 2012), titled “Rapid and More Inclusive Growth”, and continued in the Twelfth Plan as “Faster, Sustainable, and More Inclusive Growth”.
- The OECD typology: Three dimensions govern it. Participation, meaning all groups can contribute to growth; benefit sharing, meaning all groups gain in proportion to their contribution; and equity, meaning historical disadvantage is actively redressed.
- How it is measured: The National Multidimensional Poverty Index across health, education and living standards, the Gini coefficient for consumption or income inequality, the Human Development Index, and the Periodic Labour Force Survey for participation and unemployment.
Government Initiatives for Inclusive Growth
- Pradhan Mantri Garib Kalyan Anna Yojana: Free food grain to 81.35 crore beneficiaries, extended to 31 December 2028 at an outlay of about Rs 11.80 lakh crore.
- Viksit Bharat G RAM G Act, 2025: Replaces the Mahatma Gandhi National Rural Employment Guarantee Act with a 125 day wage guarantee plus skill and livelihood diversification components, effective 1 July 2026.
- Ayushman Bharat PM JAY: Health cover of Rs 5 lakh a year for 55 crore beneficiaries, now extended to all persons above 70 under Ayushman Vay Vandana.
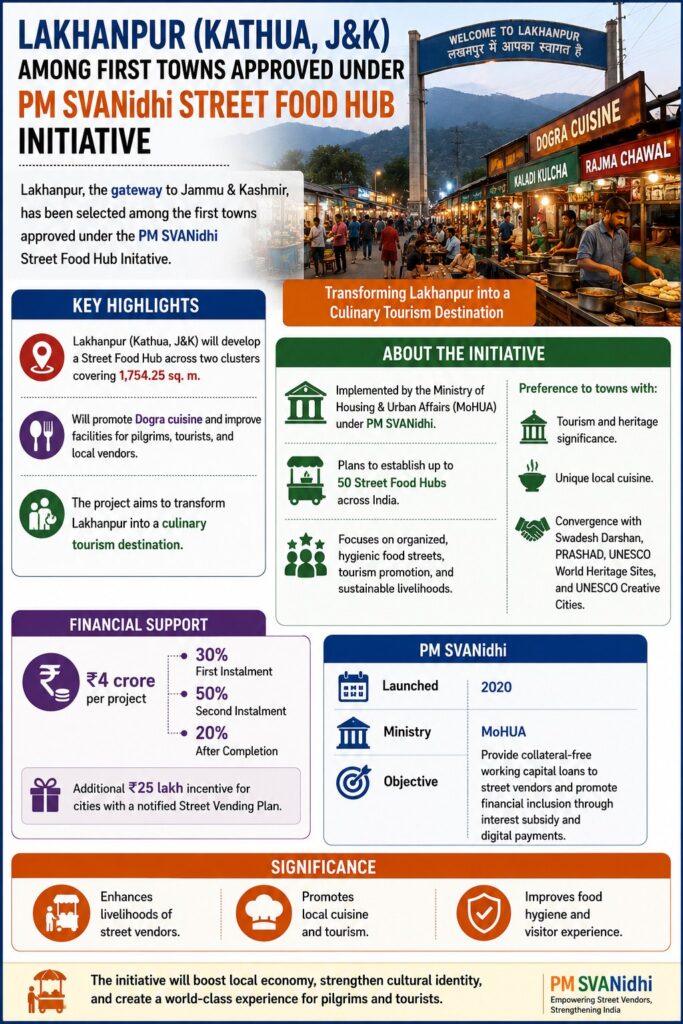
- Pradhan Mantri Mudra Yojana and PM SVANidhi: Rs 27 lakh crore disbursed across 43 crore micro enterprise loans since 2015, and collateral free credit of Rs 10,000 to Rs 50,000 for street vendors.
Matching Previous Year Question
“[2024, GS3, 10 marks] Examine the pattern and trend of public expenditure on social services in the post-reforms period in India. To what extent this has been in consonance with achieving the objective of inclusive growth?”