Mains Ready By December. Smash Mains & Smash PYQ Admissions Open

GS Paper: GS3-01.Indian Economy and issues relating to planning, mobilization of resources, growth, development and employment.

  • IIP growth conceals consumer demand weakness

    Why in the News?

    India’s Index of Industrial Production (IIP) grew 7.3% (YoY) in June 2026, the fastest growth in nearly two years. However, the strong headline growth was driven mainly by capital and infrastructure goods, while consumer non-durables remained weak, indicating subdued household demand.

    What is IIP?

    • Measures changes in the volume of industrial production.
    • Compiled and released monthly by the National Statistics Office (NSO), Ministry of Statistics and Programme Implementation (MoSPI).
    • Covers three sectors: Manufacturing, Mining, and Electricity
    • Base Year: 2022-23.

    Key Highlights

    • Capital Goods: 13.98% growth, indicating strong investment activity.
    • Infrastructure Goods: 6.74% growth, supported by public infrastructure spending.
    • Consumer Non-Durables: Only 1.53% growth, reflecting weak consumption demand.

    Why is the Headline Misleading?

    • Growth is largely driven by government-led capital expenditure, not broad-based private consumption.
    • Weak consumer demand suggests limited purchasing power despite higher industrial output.
    • Consumer-oriented sectors continue to underperform compared to investment-driven sectors.

    Challenges

    • Weak rural and urban consumption.
    • Rising input costs and inflation affecting demand.
    • Global trade uncertainty impacting consumer industries.
    • Supply disruptions due to geopolitical tensions.

    Significance

    • Used by policymakers, RBI and industry to track business cycles.
    • IIP is a high-frequency indicator of industrial performance.
    • Helps assess economic growth, investment trends and manufacturing activity.

    “[2015] In the ‘Index of Eight Core Industries, which one of the following is given the highest weight?

    (a) Coal Production

    (b) Electricity generation

    (c) Fertilizer production

    (d) Steel production

  • The next DPI: how India can commoditise AI

    Why in the News

    India built its identity, payments and data systems as free, interoperable public infrastructure, and the same approach is now being proposed for artificial intelligence (AI). The proposal argues that India should target the cost of running AI models rather than compete with global technology companies to build them, since it cannot win a capital race against firms that already dominate frontier model training. It comes as India remains a net importer of finished intelligence despite supplying a large share of the data, talent and engineering behind the world’s leading AI models.

    What is Digital Public Infrastructure (DPI)?

    1. Digital Public Infrastructure: Digital Public Infrastructure (DPI) refers to open, interoperable digital systems, built and standardised by the state, on which private companies and citizens can build services.
    2. India’s stack: India’s DPI stack combines Aadhaar for identity, the Unified Payments Interface (UPI) for payments, and the Data Empowerment and Protection Architecture (DEPA), operationalised through Account Aggregators, for consent based data sharing.
    3. Design principle: In each case, the state built the underlying protocol and made it free or near free to use, while private companies compete on the applications built on top of it.

    What made India’s identity, payments and data stack globally distinctive?

    1. Identity at scale: Aadhaar enrolled 1.4 billion people and turned identity verification from an expensive paper process into a low cost application programming interface (API) call.
    2. Payments at scale: UPI made digital payments effectively free, processing around 20 billion transactions a month at near zero cost.
    3. Cheap data: The cost of one gigabyte of mobile data in India fell from about $4 in September 2016 to under 30 cents by 2019, after one telecom operator absorbed the fixed cost of a nationwide 4G network and priced at marginal cost, forcing competitors to match.
    4. Scale of adoption: Roughly 500 million people came online within five years of that price fall, powering India’s digital payments, startup and direct benefit transfer ecosystem.

    What is the extractive trade India faces in artificial intelligence?

    1. India’s contribution: India supplies an outsized share of the data, engineering talent and research behind the world’s leading AI models, with its universities and diaspora furnishing a large share of the research talent behind major laboratories.
    2. India’s import bill: Indian startups must rent that same intelligence back as dollar priced API tokens, subject to export controls and hosted on servers outside the country, on terms set outside India.
    3. Historical parallel: The pattern mirrors colonial era trade, where raw cotton was shipped out and finished cloth bought back at a markup.

    What are the pillars of India’s proposed AI token economy?

    1. Compute: The IndiaAI Mission, backed by an outlay of about Rs 10,372 crore, has empanelled private cloud providers to onboard over 38,000 graphics processing units (GPUs), with a target of 100,000, letting eligible startups and researchers access compute at about Rs 65 per GPU hour.
    2. Open models: The proposal calls for any AI model built using state subsidised compute or public datasets, including anonymised legal, agricultural and educational data in India’s 22 official languages, to be released under an open weights licence, so private companies compete on applications rather than owning the underlying model.
    3. Distribution: A proposed Unified Intelligence Interface (UII), styled as a UPI for AI, would be an open, standardised gateway through which any application could call any model, sovereign or private, with shared standards for identity, consent, billing and safety.

    What do other countries’ digital infrastructure models show about India’s combination?

    1. Estonia: Estonia operates a world class digital identity system but has no payments rail comparable to UPI.
    2. Brazil: Brazil’s Pix is a free, widely used instant payments rail, but it functions as a standalone system without an equivalent identity or data sharing layer.
    3. Singapore: Singapore runs Singpass for digital identity and SGFinDex for consolidated financial data access, built as separate systems rather than one integrated stack.
    4. European Union: The European Union has built open banking and data portability rules, but has not combined them with a single free national identity or payments system.
    5. India’s distinction: India’s claim to leadership rests specifically on operating identity, payments and data sharing as one interoperable public stack, a combination no other country has built at the same scale.

    Can the model that crashed the price of data work the same way for artificial intelligence?

    1. Different economics conceded: The proposal itself concedes that India cannot win a capital race against global technology companies in training frontier AI models, since that race rewards the scale of capital already held by a small number of firms.
    2. Recalibrated target: It argues the correct target is instead the cost of running, or making inferences from, existing models, treating inference cost the way earlier reforms treated the cost of data and transactions.
    3. Untested assumption: Unlike telecom spectrum or a payments protocol, frontier AI models require continuous retraining and enormous ongoing compute investment, so a one time cost crash of the kind seen in mobile data may not hold for long in AI.

    What are the challenges to India’s proposed AI token economy?

    1. Hyperscaler capital gap: Global technology companies that already dominate frontier model training can subsidise inference pricing far below what India’s compute base can match, even after the mission scales to 100,000 GPUs.
    2. Open weights disincentive: A mandatory open weights licence for any model built on subsidised compute or public data could discourage private investment in cutting edge model development within India, since firms could not fully capture the returns.
    3. Power and grid constraints: Data centre clusters need dedicated, reliable electricity and transmission capacity, and India’s grid planning does not yet treat AI compute load as a distinct category to plan for.
    4. Chip supply dependence: Scaling to 100,000 GPUs depends on continued access to export controlled semiconductors, mostly manufactured outside India, exposing the plan to global chip supply and export control decisions beyond its control.
    5. Data privacy exposure: Aggregating public datasets such as legal rulings, health records and agricultural data for AI training raises consent and privacy questions that a data protection framework would need to resolve first.
    6. Subsidy sustainability: A national freemium token model, funded partly by diverting subsidy allocations, risks being gamed by ineligible users or becoming fiscally unsustainable if adopted at the scale the proposal envisions.

    Conclusion

    India’s identity, payments and data systems became cheap because the state built the rails and let market competition crash the price on top of them. The proposal argues the same design can make artificial intelligence inference cheap, provided India targets running costs rather than the unwinnable race to train frontier models. Whether India’s power capacity, chip access and open weights mandate can support that shift remains unresolved.

    Back2Basics

    IndiaAI Mission

    1. Ministry: The IndiaAI Mission is administered by the Ministry of Electronics and Information Technology (MeitY).
    2. Approval: It was approved by the Union Cabinet in March 2024 with an outlay of about Rs 10,372 crore.
    3. Aim: It aims to build public private compute infrastructure, support indigenous foundational AI models, and expand access to AI applications, skilling and startup financing.
    4. Structure: The mission is organised around pillars covering compute infrastructure, foundational models, datasets platforms, application development, skilling, startup financing, and safe and trusted AI.

    AI Token Economy

    The AI token economy or tokenomics is a new financial framework where tokens (the basic units of text, audio, or visual data that AI models process) function as the foundational currency of digital work, computation, and enterprise spending.

    Core Mechanics of AI Tokens

    1. The Atomic Unit: Unlike traditional software priced by user seats or flat subscriptions, AI is metered and billed per inferential act (input and output tokens).
    2. Conversion Rate: Roughly 1,500 English words equal about 2,048 tokens, varying by model. Every prompt, background system instruction, and retrieved file consumes this resource.
    3. Macro Indicator: Macroeconomists track token volume like kilowatt-hours or steel production to measure digital output and productivity across industries.
  • RBI tightens transparency norms on bulk deposit rates, allows LCR linked pricing

    Why in the News?

    The RBI has mandated daily disclosure of bulk deposit interest rates while allowing LCR-linked differential pricing. The move follows the MSRDC interest payment controversy, which exposed opaque pricing practices for large depositors.

    What are the new RBI norms?

    • Banks must publish bulk deposit rates daily.
    • Interest rates must be uniform for deposits of the same amount accepted on the same day.
    • Differential rates are allowed only under the Liquidity Coverage Ratio (LCR) framework.
    • Applicable to bulk deposits, wholesale funding, and rupee deposits of non-residents.

    What is the Liquidity Coverage Ratio (LCR)?

    • A Basel III liquidity standard ensuring banks hold sufficient High Quality Liquid Assets (HQLA) to meet 30-day stressed cash outflows.
    • Minimum LCR in India: 100%.
    • Current run-off rate: 12.5% (including 2.5% for digital deposits).

    What triggered the reform?

    • A bank allegedly disguised ₹45 crore paid to MSRDC as marketing expenditure during 2023–25.
    • The irregularity was detected through an internal audit, leading to a vigilance probe and the resignation of the bank’s chairman.

    Key Challenges

    • Hidden arrangements may still require internal audits to detect.
    • Daily disclosures cannot eliminate all off-book incentives.
    • Digital deposits may require periodic revision of run-off rates.
    • Stronger oversight of deposits by government entities is needed.

    Conclusion

    The RBI’s reforms improve transparency and fairness in bulk deposit pricing by replacing opaque negotiations with a rule-based disclosure system, though effective supervision remains critical.

    Value Addition

    • Liquidity Coverage Ratio (LCR) = High Quality Liquid Assets (HQLA) ÷ Net Cash Outflows (30 days) × 100. Minimum requirement: 100%
    • High Quality Liquid Assets (HQLA): Cash, RBI balances, and Government Securities (G-Secs)
    • Basel III: Introduced after the 2008 Global Financial Crisis. Strengthens capital adequacy, liquidity, and bank resilience.
    • Bulk Deposits: Large-value deposits accepted from corporates, institutions, trusts, and government entities, carrying higher liquidity risk than retail deposits.

    [2015] Basel III Accord’ or simply ‘Basel III’ often seen in the news, seeks to

    (a) develop national strategies for the conservation and sustainable use of biological diversity

    (b) improve banking sector’s ability to deal with financial and economic stress and improve risk management

    (c) reduce the greenhouse gas emissions but places a heavier burden on developed countries

    (d) transfer technology from developed countries to poor countries to enable them to replace the use of chlorofluorocarbons in refrigeration with harmless chemicals

  • [30th July 2026] The Hindu OpED: India’s refusal to uphold a global gig work law

    PYQ Relevance
    [UPSC 2024]
    Discuss the merits and demerits of the four ‘Labour Codes’ in the context of labour market reforms in India. What has been the progress so far in this regard?
    Linkage: The PYQ asks for an evaluation of the four Labour Codes, including the Code on Social Security, and their implementation progress. The article’s account of the un-operationalised gig worker fund under the Code on Social Security directly answers the “progress so far” component of this question.

    Mentor’s Comment

    On June 12, the International Labour Conference adopted Convention No. 193 on Decent Work in the Platform Economy by a vote of 406 to 8. India’s government delegate abstained even as India’s own employer and worker delegates voted in favour. The abstention exposes a gap between India’s stated commitment to gig worker welfare through its domestic Labour Codes and its long-standing refusal to accept binding international obligations that courts could enforce.

    What floor of rights does Convention No. 193 set that Indian law currently denies gig workers?

    1. Rights regardless of classification: The Convention extends minimum pay, on-time payment, occupational safety and social security to platform workers whatever a company calls them, whether “employee” or “independent partner.”
    2. Algorithmic management disclosure: Platforms must disclose significant automated decisions in writing and keep a human in the loop. Algorithmic management: the software that allocates work, sets pay, monitors performance and can deactivate accounts. No prior global labour standard has regulated this domain.
    3. Correct classification mandate: Article 9 requires governments to classify workers by the facts of the work performed, not by the label a platform assigns.
    4. Enforceability through ratification: A worker in a ratifying country can sue a platform for redress once the Convention is written into domestic law. India’s abstention forecloses that route.
    5. Limited but real floor: The Convention does not resolve every gig work dispute. It sets a minimum below which no ratifying country can fall.

    How large and precarious is India’s gig workforce today?

    1. Scale: India’s gig workforce stood at roughly 7.7 million in 2020-21. NITI Aayog projects it will reach 2.35 crore by 2029-30, about 6.7% of the non-agricultural workforce.
    2. Wage distribution: About 39% of gig workers earn ₹10,000-₹25,000 a month. Another 34% earn ₹25,000-₹40,000.
    3. Unpaid costs: Workers cover fuel costs themselves and work 12-hour shifts with no overtime. Overtime requires an employer to exist in law.
    4. Social security gap: Only about 15% of gig workers have any social security cover.
    5. Algorithmic exposure: An algorithm can deactivate a worker’s account and cut off income without explanation. Workers have no accident cover, sick pay or pension to fall back on.

    Does India’s Code on Social Security, 2020 already deliver what Convention No. 193 promises?

    1. Early definitional step: The Code on Social Security, part of the four Labour Codes in force from November 2025, was among the world’s first central laws to define “gig worker” and “platform worker.”
    2. Funding mechanism on paper: Aggregators must pay 1%-2% of annual turnover, capped at 5% of worker payouts, into a social security fund.
    3. Unspecified benefits: Neither the central law nor most state laws specify the nature, quantum or eligibility of benefits.
    4. Un-operationalised contribution: The contribution mechanism remains largely unimplemented. The schemes remain notional.
    5. Gap between claim and delivery: The law reads as leadership on paper. It functions as a promise that has not been converted into disbursed protection.

    Who is actually legislating gig worker protection: the Centre or the states?

    1. Rajasthan’s model: The Rajasthan Platform-Based Gig Workers Act, 2023 is a standalone state law establishing gig worker registration and welfare mechanisms.
    2. Karnataka and Telangana boards: Both states have drafted welfare boards for platform workers independent of central action.
    3. Federalism argument tested: The Centre cites labour as a concurrent subject to justify caution. States are already exercising that same concurrent jurisdiction.
    4. Centre-state asymmetry: The Centre abstains in Geneva while states legislate at home. This reverses the usual expectation that national commitments lead subnational implementation.

    Is India’s abstention a one-off caution or a settled institutional posture?

    1. Founding member, selective ratifier: India is a founding member of the ILO and has ratified six of eight core conventions. It has not ratified Convention 87 on Freedom of Association or Convention 98 on the Right to Organise and Collective Bargaining.
    2. Domestic rule conflict: India has not ratified Conventions 87 and 98 because they would grant government servants the right to strike. Domestic rules bar that right.
    3. Violence and harassment convention untouched: India has also not ratified Convention 190 on violence and harassment at work.
    4. Reversed sequence: India ratifies conventions only once domestic law is already in full conformity. This reverses the sequence in which ratification typically drives domestic reform.
    5. A settled choice: A founding member of the ILO that will not sign the ILO’s own guarantees is not acting out of unfamiliarity. It is exercising a settled choice to endorse principles without accepting enforceable obligations.

    What does the abstention cost gig workers and India’s global standing?

    1. Lost legal recourse: Ratification would let a worker sue a platform for redress. Abstention forecloses that possibility inside India.
    2. Signal to aggregators: The abstention tells every aggregator operating in India that calling workers “partners” rather than employees remains a safe classification.
    3. Cross-country disparity: A delivery worker in China will have enforceable rights under the Convention. A worker in Chennai will not.
    4. A choice by default: The government chose neither the worker nor the platform in a forum where one side holds the app and the other holds the handlebars. That default functions as choosing the platform.
    5. Scale of the stake: The World Bank estimates 154-435 million people already earn through platforms worldwide. 2.35 crore of them will be Indian by 2030.

    Conclusion

    India’s abstention on Convention No. 193 is not an isolated diplomatic caution. It follows the same pattern as its non-ratification of Conventions 87, 98 and 190: endorse the principle in domestic law, withhold the obligation that would make it enforceable. Gig workers are left with a social security fund that exists on paper but not in disbursement, while individual states legislate protections the Centre will not commit to nationally. Until India converts stated intent into binding law, its 2.35 crore gig workers by 2030 will remain outside the floor of rights their counterparts elsewhere now hold.

  • Industrial growth hits 23 month high of 7.3% in June, IIP data shows

    Why in News?

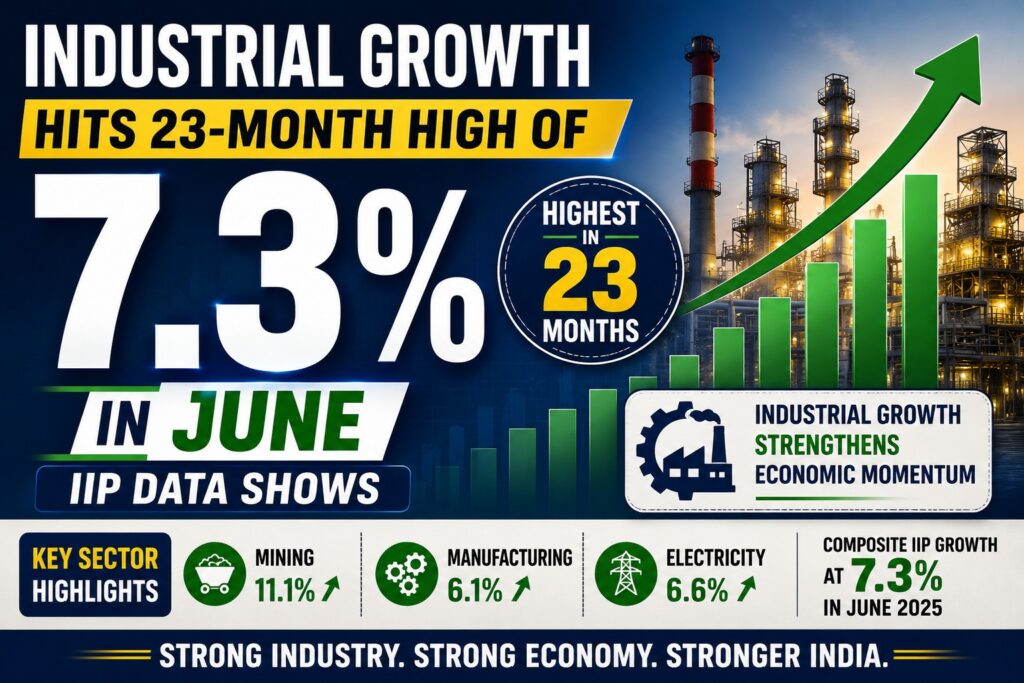
    The Index of Industrial Production (IIP) recorded 7.3% growth in June, a 23 month high, driven by manufacturing, electricity and capital goods, per Ministry of Statistics and Programme Implementation (MoSPI) data.

      Key Highlights

      1. Headline growth: Industrial growth reached 7.3% in June, its highest in 23 months.
      2. Sectoral drivers: Manufacturing grew 7.8%, electricity 10.6%, and capital goods 14.2%.
      3. Breadth: 19 of 23 manufacturing groups posted growth.
      4. Risk flags: Analysts cite a weak monsoon and the West Asia war as risks to sustaining this growth pace.

      What is the Index of Industrial Production (IIP)?

      1. The IIP is a monthly indicator measuring the volume of industrial production in the economy.
      2. It is compiled and released by the National Statistics Office (NSO) under MoSPI.
      3. It reflects the performance of the mining, manufacturing and electricity sectors.
      4. Base Year: 2022-23.

      Components of IIP

      1. Manufacturing: Largest contributor with about 77% weight.
      2. Mining: Around 14% weight.
      3. Electricity: Around 8% weight.
      4. Use-Based Classification: Primary Goods, Capital Goods, Intermediate Goods, Infrastructure/Construction Goods, Consumer Durables, and Consumer Non-Durables

      [2012] In India the overall Index of Industrial Production, the Indices of Eighth Core Industries have combined weight of 37.90%. Which of the following are among those Eight Core Industries?
      1. Cement
      2. Fertilizers
      3. Natural Gas
      4. Refinery products
      5. Textiles
      Select the correct answer using the codes given below:

      [A] 1 and 5 only

      [B] 2, 3 and 4 only

      [C] 1, 2, 3 and 4 only

      [D] 1, 2, 3, 4 and 5

    1. Rupee’s Real Effective Exchange Rate turns undervalued, more so than the yuan

      Why in the News

      India’s Real Effective Exchange Rate (REER) has moved from overvalued, above 100 until mid-2025, to undervalued at around 91 in June 2026. The rupee is now more undervalued than China’s yuan, a shift driven by oil price volatility and the West Asia war.

      What is the Real Effective Exchange Rate (REER)?

      1. Definition: REER measures a currency’s value against a trade weighted basket of other currencies, adjusted for inflation differentials, with 100 as the base year benchmark.
      2. Above 100: A REER above 100 signals overvaluation, meaning the currency is more expensive than its trade weighted fair value, hurting export competitiveness.
      3. Below 100: A REER below 100 signals undervaluation, meaning exports become cheaper and more competitive in foreign markets.
      4. Current reading: The rupee’s REER at around 91 in June 2026 places it firmly in undervalued territory, a reversal from above 100 as recently as mid-2025.

      Why does rupee undervaluation matter now?

      1. Export competitiveness: An undervalued rupee makes Indian exports cheaper relative to competitors, a potential offset to the tariff pressure Indian exporters face from the United States.
      2. Oil price link: Volatility from the West Asia war affects oil import costs, which in turn move the rupee’s value against the dollar and the wider currency basket.
      3. Comparative position: The rupee being more undervalued than the yuan reverses a longstanding pattern where China’s currency was seen as the more actively managed, undervalued one.
      4. Policy dilemma: Sustained undervaluation aids exporters but raises import costs, including for oil, creating a trade off the Reserve Bank of India must weigh in its currency management.

      Conclusion

      The rupee’s shift from overvalued to undervalued reflects oil price and West Asia conflict volatility more than a deliberate policy choice. Whether this undervaluation becomes a durable export advantage or reverses with oil price stabilisation remains the open question.

    2. India’s Record Exports in FY 2025-26

      Why in News?

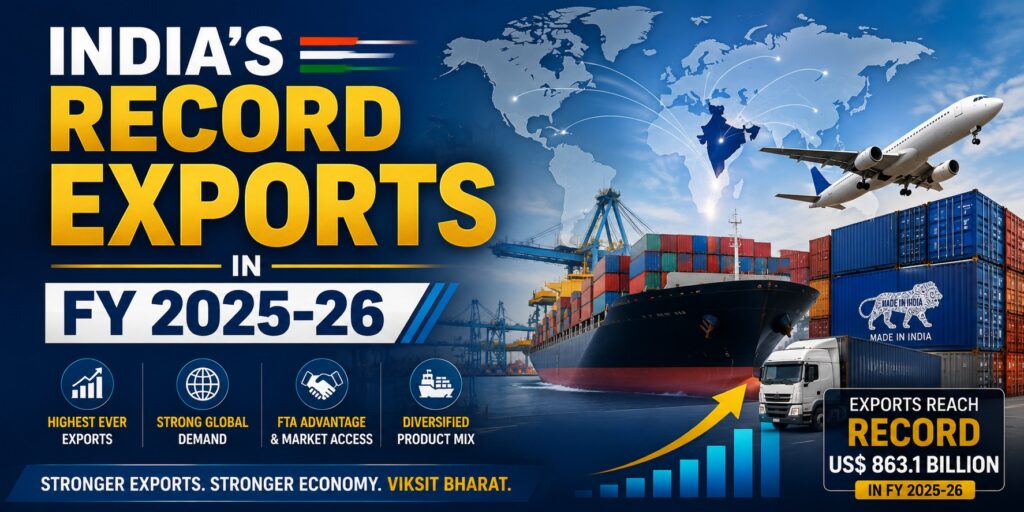
      India recorded its highest-ever exports of US$ 863.1 billion in FY 2025-26, driven by strong merchandise and services exports and growing benefits from recent Free Trade Agreements (FTAs), particularly with the UAE, UK, Australia, Oman and EFTA.

      Key Highlights

      • Record exports: India’s total exports reached US$ 863.1 billion in FY 2025-26.
        • Merchandise exports: US$ 441.8 billion
        • Services exports: US$ 421.3 billion
      • Top FTA export destinations:
        • ASEAN: US$ 38.4 billion
        • UAE (CEPA): US$ 37.4 billion
        • SAFTA: US$ 25.8 billion
        • UK (CETA): US$ 13.4 billion
        • Singapore (CECA): US$ 11.9 billion
      • Recent FTAs boosted exports:
        • UAE CEPA: 4.45 lakh Certificates of Origin issued; export tariff lines increased from 7,546 to 8,053.
        • Australia ECTA: Certificates of Origin rose from 1,482 (FY21) to an average 45,500+ annually after implementation.
        • Mauritius CECPA: Export tariff lines increased by 20.9%.
        • Oman CEPA: June 2026 exports grew 54.7% month-on-month and 189.6% year-on-year.
        • India-EFTA TEPA: Over 7,885 Certificates of Origin issued since October 2025.
      • Labour-intensive sectors benefited most: Textiles & apparel, Leather & footwear, Gems & jewellery, Marine products, Carpets, Handicrafts, Agricultural products
      • Trade facilitation initiatives:
        • Trade e-Connect: Provides market intelligence, tariff information, Rules of Origin guidance and FTA advisory.
        • Trade Intelligence & Analytics (TIA) Portal: Offers commodity-wise trade analytics and real-time export monitoring.

      Significance

      • Diversifies export markets and products.
      • Enhances global value chain integration.
      • Boosts manufacturing and employment in labour-intensive industries.
      • Improves India’s competitiveness through preferential tariff access.

      [2023] Consider the following statements:
      Statement-I: India accounts for 3.2% of global export of goods.
      Statement-II: Many local companies and some foreign companies operating in India have taken advantage of India’s Production-linked Incentive’ scheme.
      Which one of the following is correct in respect of the above statements?

      [A] Both Statement-I and Statement-II are correct and Statement-ll is the correct explanation for Statement-I.

      [B] Both Statement-I and Statement-II are correct and Statement-l is not the correct explanation for Statement-I.

      [C] Statement-l is correct but Statement-II is incorrect.

      [D] Statement-I is incorrect but Statement-II is correct.

    3. Fiscal Health Index (FHI) 2026

      Why in News?

      NITI Aayog has released the second edition of the Fiscal Health Index (FHI) 2026, providing a comprehensive assessment of the fiscal performance of Indian States during FY 2023–24. The report expands its coverage to include 10 North-Eastern and Himalayan States, in addition to the 18 major States assessed in the inaugural edition.

      Key Highlights

      • Expanded coverage: Evaluates 28 States (18 major States + 10 North-Eastern and Himalayan States).
      • Purpose: Measures the fiscal health of States using a transparent and data-driven framework.
      • Fiscal significance: States account for nearly two-thirds of public expenditure and about one-third of the general government debt.
      • Key finding: Most States recorded moderate fiscal performance, with significant variations across regions.
      • Recommendations: Improve own tax revenue, rationalise committed expenditure, strengthen capital expenditure, enhance public financial management, and ensure debt sustainability.

      What is the Fiscal Health Index (FHI)?

      • The Fiscal Health Index (FHI) is an annual report released by NITI Aayog to evaluate the fiscal performance of States using objective indicators. It promotes fiscal discipline, financial sustainability, and evidence-based policymaking while encouraging States to improve public financial management.

      Key Parameters of the Fiscal Health Index

      • Quality of Expenditure
      • Revenue Mobilisation
      • Fiscal Prudence
      • Debt Management

      Significance of the Fiscal Health Index

      • Encourages competitive and cooperative federalism.
      • Helps identify strengths and weaknesses in State finances.
      • Supports informed policy decisions and fiscal reforms.
      • Promotes sustainable public finances and efficient resource allocation.
      • Enhances transparency and accountability in fiscal governance.

      Challenges Highlighted by the Report

      • Low own tax revenue in several States.
      • High committed expenditure on salaries, pensions, and interest payments.
      • Rising debt burden in some States.
      • Limited fiscal space for developmental expenditure.
      • Regional disparities in fiscal performance.
    4. CBDT’s crypto-asset reporting guidance and India’s alignment with OECD’s CARF

      Why in the News?

      The Central Board of Direct Taxes (CBDT) has released a 198 page guidance note aligning India’s crypto-asset tax reporting with the OECD’s Crypto-Asset Reporting Framework (CARF). The mandate operates under Section 509 of the Income-tax Act, 2025.

      How are crypto assets defined legally?

      1. Definition (Indian IT Legislation): India’s income tax legislation defines a “crypto-asset” as a digital representation of value that relies on a cryptographically secured distributed ledger or a similar technology to validate and secure transactions.
      2. Definition (OECD):The OECD Crypto-Asset Reporting Framework (CARF) defines crypto-assets similarly, but also includes “similar technology to validate and secure transactions, which includes cryptocurrencies, as well as cryptography- based tokens”.

      What is the Crypto-Asset Reporting Framework (CARF)?

      1. Definition: CARF is an international standard developed by the Organisation for Economic Co-operation and Development (OECD) requiring crypto-asset service providers to collect and report user transaction data to tax authorities.
      2. India’s mechanism: Section 509 of the Income-tax Act, 2025 gives CBDT the statutory basis to mandate this reporting domestically.
      3. Who reports: Exchanges and Reporting Crypto-Asset Service Providers (RCASPs) must collect and submit user transaction data.

      What are the Core Objectives Crypto-Asset Reporting Framework (CARF)?

      1. Automatic Information Exchange: Facilitates seamless cross-border sharing of taxpayer crypto transaction data between participating countries.
      2. Covered Entities: Mandates Reporting Crypto-Asset Service Providers (RCASPs), like exchanges and brokerages, to track and report user activity.
      3. Included Assets: Applies broadly to cryptocurrencies, stablecoins, certain non-fungible tokens (NFTs), and crypto derivatives.

      Why does this reporting mandate matter for crypto-asset holders?

      1. Visibility shift: Transactions previously visible only to the exchange become visible to the tax authority as well.
      2. Cross-border consistency: Aligning with CARF means data collected in India can be exchanged with other OECD-aligned tax jurisdictions.
      3. Compliance burden: Exchanges and RCASPs must build new data collection and reporting infrastructure to meet the mandate.
      4. Enforcement basis: The guidance gives CBDT a documentary basis to pursue undeclared crypto-asset income.

      What are the implications for taxpayers?

      1. No fresh reporting: The Guidance Note does not require taxpayers to make fresh disclosures directly to the Income-tax Department.
      2. Income reporting: Continue reporting crypto income under existing provisions of the Income-tax Act.
      3. Record keeping: Maintain records of purchases, sales, transfers, wallet movements, and exchange statements.
      4. Consistency: Ensure ITR disclosures match information reported by crypto exchanges (RCASPs).

      Conclusion

      The guidance closes a visibility gap that let crypto-asset transactions escape the reporting standard applied to conventional financial accounts. Its effectiveness now depends on how consistently exchanges and RCASPs implement the collection and reporting mechanics CBDT has mandated.

      PYQ Relevance

      [UPSC 2026] Which of the following statements regarding the features of blockchain technology are correct?

      1. Records stored in the database may be made visible to relevant stakeholders without risk of alteration.

      2. Copies of the entire database are stored on multiple computers on a network syncing within seconds.

      3. Consortium blockchain is a blend of public and private blockchains allowing selective data access.

      4. Mathematical algorithms make it impossible to change or delete any data once recorded and accepted.

      (a) 1 and 3 (b) 2 and 4 only (c) 1, 2 and 4 (d) 1 and 4 only

    5. What’s behind the vault of India’s gold exchange

      Why in the News?

      India’s gold exchange ecosystem, built on Electronic Gold Receipts (EGR), now sits at the centre of how Indians hold and trade gold. The shift exposes a tension between gold as a physical, trust based asset and a dematerialised, exchange traded instrument.

      What is an Electronic Gold Receipt?

      • Definition: An Electronic Gold Receipt (EGR) is a Securities and Exchange Board of India (SEBI) regulated digital security representing actual physical gold stored in secure, accredited vaults.
      • Purpose: EGRs let investors buy, sell, and trade gold on exchanges such as the National Stock Exchange of India (NSE) and the Bombay Stock Exchange (BSE), without holding physical metal at home.

      How does an Electronic Gold Receipt actually work?

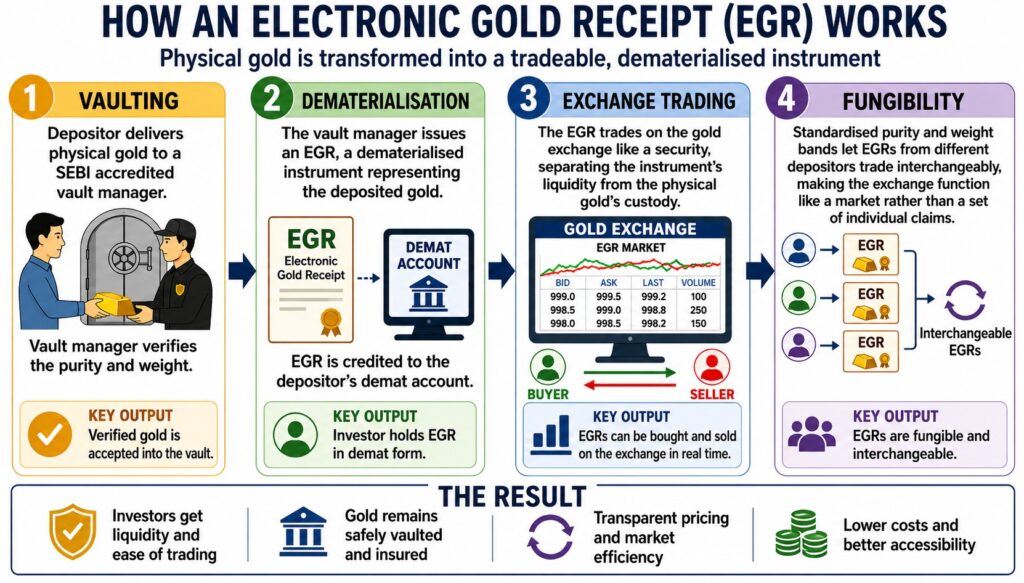
      • Vaulting: A depositor delivers physical gold to a SEBI accredited vault manager, who verifies purity and weight.
      • Dematerialisation: The vault manager issues an EGR, a dematerialised instrument representing the deposited gold. It is credited to the depositor’s demat account.
      • Exchange trading: The EGR then trades on the gold exchange like a security, separating the instrument’s liquidity from the physical gold’s custody.
      • Fungibility: Standardised purity and weight bands let EGRs from different depositors trade interchangeably, making the exchange function like a market rather than a set of individual claims.

      What problem does this solve that physical gold trading could not?

      • Price discovery: A centralised exchange produces a transparent, real time domestic gold price instead of fragmented jeweller quotes.
      • Storage risk: Vault custody by regulated managers removes the theft and storage burden from individual holders.
      • Import dependence: A liquid domestic exchange gives India a reference price less dependent on London or Dubai benchmarks.
      • Quality assurance: Mandatory purity verification and standardised weight bands remove the adulteration risk common in unorganised physical gold trade.
      • Two way convertibility: An EGR can convert back into physical gold and back again, allowing arbitrage that keeps the receipt aligned with physical gold prices.

      Challenges to Electronic Gold Receipts

      • Ecosystem complexity as due diligence burden: The EGR ecosystem distributes responsibility across vault managers, depositories, exchanges, clearing corporations, and brokers. An investor’s risk assessment must span multiple entities.
      • Early stage caution: Informed participation requires investors to understand this multi institutional framework before adoption.
      • Liquidity constraints: EGR trading volumes remain well behind Gold Exchange Traded Funds (ETF), resulting in thinner markets and wider bid ask spreads.
      • Ongoing holding costs: Vaulting, storage, and withdrawal fees continue as long as the gold remains deposited, unlike Gold ETFs and Sovereign Gold Bonds (SGB).
      • Vault manager risk: SEBI mandates minimum net worth, insurance, and a financial security deposit for every vault manager, but residual operational and financial risk remains.

      Conclusion

      The EGR system converts gold from an asset held on trust in a locker into a regulated, tradeable instrument. Its long term success depends on depositor confidence, vault managers, and depositories performing as certified.