Mains Ready By December. Smash Mains & Smash PYQ Admissions Open

GS Paper: GS3-01.Indian Economy and issues relating to planning, mobilization of resources, growth, development and employment.

  • Beyond GDP, brace for turbulence ahead

    Why in the News

    Long term government bond yields in the advanced economies have risen sharply, raising the risk free return foreign capital can earn without entering India. Official growth estimates for April to June, together with car, two wheeler and tractor sales and Goods and Services Tax (GST) collections, show the economy absorbing the energy supply shock caused by the West Asia war. Strong output data does not settle the financing question, since capital compares India’s expected return against an assured dollar return. The dollars India did attract came through Foreign Currency Non-Resident (Bank), or FCNR(B), deposits, priced at rates Indian banks could offer only because the Reserve Bank of India (RBI) carried the hedging cost.

    How does the FCNR(B) deposit and swap arrangement work?

    1. The deposit: An FCNR(B) deposit is a term deposit placed with an Indian bank by a non-resident Indian, held and repayable in foreign currency.
    2. The bank’s exposure: The bank owes repayment in that foreign currency, so a fall in the rupee raises what the deposit costs it in rupee terms.
    3. The swap facility: The RBI bore the hedging cost against currency fluctuation through a special dollar rupee swap facility.
    4. Where the risk now sits: The banks transferred the risk of rupee depreciation to the central bank, which is what allowed them to pay a high rate in foreign currency.

    What do bond yields in Japan, the United States and the United Kingdom demonstrate about the cost of capital?

    1. Japan: The ten year government bond yield crossed 3 per cent for the first time since 1996, and the thirty year yield stands at 4.1 per cent.
    2. The United States: The ten year Treasury yield is at 4.8 per cent and the thirty year at 5.3 per cent.
    3. The United Kingdom: The ten year yield is at 5.2 per cent and the thirty year at 5.9 per cent.
    4. Why these set the benchmark: These instruments are virtually risk free, issued by governments that have never defaulted on their debts, so an assured 4.8 per cent dollar return is the floor any Indian asset has to beat.

    What did India have to pay to bring in dollars?

    1. The deposit rate: Indian banks offered 6 to 6.5 per cent interest on FCNR(B) deposits.
    2. The volume raised: The window mobilised $127.2 billion.
    3. The direction of travel: Foreign money no longer comes cheap, and the path of global bond yields points to it turning more expensive.

    Why does a strong growth number not settle the external financing question?

    1. The two measures test different things: Output and consumption data measure domestic demand. The financing question is whether a foreign investor’s expected return here beats a risk free alternative abroad.
    2. Equity returns are the transmission channel: Long term foreign capital enters on growth prospects that translate into equity market returns, and those prospects must be compelling against elevated yields.
    3. A window is not a policy: A special forex swap window is a one time reprieve for the external sector and cannot substitute for durable intervention.

    What would durable resilience require?

    1. Fiscal consolidation: In a rising interest rate environment a government cannot run high fiscal deficits, which crowd out private sector and other productive borrowing.
    2. Keeping the external account financeable: Those deficits must not spill into current account deficits, which are difficult to finance when global capital flows turn volatile.
    3. Export promotion: Exports are to be raised through increased access to global markets.
    4. Cheaper inputs for exporters: Duties on imported raw materials and components are to be eliminated.
    5. Predictability: Policy stability for foreign investors is the fourth durable intervention, alongside consolidation, exports and input duty removal.

    Challenges to relying on the FCNR(B) swap route

    1. The liability matures: A term deposit has to be repaid or rolled over on a fixed date, so an inflow raised in months becomes an outflow risk on a known one. Eg. The 2013 FCNR(B) swap window raised about $26 billion, and its redemption was concentrated in late 2016.
      The Fix: Stagger maturities across the deposit book and pre-announce the redemption profile, so repayment does not bunch into a single quarter.
    2. The central bank absorbs the currency loss: A hedging cost carried by the RBI becomes a loss on its own books if the rupee falls further than the swap rate assumed. Eg. The rupee’s record low against the dollar has been reset repeatedly since 2022.
      The Fix: Disclose the swap facility’s cost to the central bank’s balance sheet, so the public subsidy inside the scheme is visible.
    3. Debt creating inflows substitute for equity: A deposit is a repayable liability while direct investment is not, so the same headline inflow leaves a different obligation behind. Eg. Non-resident Indian deposits are counted within India’s external debt, and foreign direct investment is not.
      The Fix: Cap the share of external financing met through deposit schemes, so a reserve build is not increasingly borrowed.
    4. The inflow is rate sensitive and reversible: Money that arrives for an interest differential leaves when that differential narrows. Eg. Foreign investors withdrew from Indian debt in 2013 once United States yields rose after the taper announcement.
      The Fix: Build the buffer through current account improvement and equity inflows, so the stock of reserves does not depend on a rate spread.
    5. A headline reserves figure hides its composition: Reserves assembled through a swap window signal less resilience than the same figure built from a trade surplus. Eg. India’s reserves crossed $700 billion while the current account remained in deficit.
      The Fix: Report the hedged and unhedged components of reserves separately in the weekly statistical supplement.

    Conclusion

    India’s external position looks strongest at the moment it is most borrowed. A large stock of foreign currency has been assembled by paying for it, and part of that bill sits on the central bank’s own books rather than on the banking system’s. The tension left unresolved is one of timing: the measures that would make foreign capital cheap again work over years, and the rate environment that made it expensive changed in months. What to watch is whether a second window is opened when the first one matures.

    “[2013] Which one of the following groups of items is included in India’s foreign-exchange reserves?

    (a) Foreign-currency assets, Special Drawing Rights (SDRs) and loans from foreign countries

    (b) Foreign-currency assets, gold holdings of the RBI and SDRs

    (c) Foreign-currency assets, loans from the World Bank and SDRs

    (d) Foreign-currency assets, gold holdings of the RBI and loans from the World Bank
  • Norms allowing e-comm cos to keep inventory notified by govt

    Why in the News

    The Department of Economic Affairs, in the Ministry of Finance, has amended the Foreign Exchange Management (Non-debt Instruments) Rules, 2019 to let e-commerce entities hold inventory. The permission is confined to goods meant for export. Those goods must be manufactured or produced in India. Foreign Direct Investment (FDI) in inventory based e-commerce retailing remains barred, so a foreign funded platform still cannot own the stock it sells to Indian consumers. The change separates a platform’s right to own goods from its right to sell them in India.

    What is inventory based e-commerce, and how does it differ from the marketplace model?

    1. Inventory based model: The platform owns the goods it lists and sells them directly to the buyer.
    2. Marketplace model: The platform runs a digital facility connecting independent sellers to buyers. It does not own the stock it displays.
    3. The investment line between them: Foreign investment up to 100 percent under the automatic route is permitted in the marketplace model. Foreign investment in the inventory based model is not permitted.

    What has the amendment changed?

    1. A permission tied to export: An e-commerce entity may now maintain inventory where the goods are meant for export.
    2. A domestic origin condition: The goods so held must be manufactured or produced in India.
    3. The retail bar is untouched: Foreign investment in inventory based e-commerce retailing has not been permitted.
    4. The route taken: The Department of Economic Affairs inserted the provision into the Foreign Exchange Management (Non-debt Instruments) Rules, 2019, which is the instrument that carries India’s foreign investment conditions in law.

    Why does an export only carve out change what a foreign funded platform can do?

    1. Ownership of stock becomes lawful for one purpose: A foreign funded platform may buy, own and warehouse Indian made goods, provided the buyer sits outside India.
    2. The domestic retail rationale survives: The bar exists to stop a platform holding foreign capital from selling its own stock to Indian consumers at prices small retailers cannot match. An export sale does not enter that market.
    3. Exports gain an aggregator: A small manufacturer without overseas logistics can sell to a platform that takes title to the consignment and ships it out.
    4. The test shifts from ownership to destination: Compliance now turns on where a consignment ends up, which is a harder thing to observe than who owns it.

    Challenges to the export only inventory permission

    1. Diversion into the domestic market: Stock held under the export permission can be sold at home unless each consignment is matched to a foreign buyer. Eg. Duty free inputs meant for export production have repeatedly been the subject of Directorate of Revenue Intelligence cases over domestic diversion.
      The Fix: Require the platform to reconcile inventory held under this permission against shipping bills filed with Customs, and treat an unreconciled balance as a contravention.
    2. No stated threshold for what counts as made in India: The condition turns on goods manufactured or produced in India, and a low value assembly operation meets that description. Eg. Domestic value addition has been a running dispute under the Production Linked Incentive scheme for electronics, where imported kits are assembled locally.
      The Fix: Attach a stated domestic value addition threshold to the permission, as the Production Linked Incentive schemes already do.
    3. Enforcement acts long after the sale: Contraventions under the Foreign Exchange Management Act, 1999 are penalised or compounded after the fact, so a breach is corrected once the goods have already moved. Eg. Proceedings against large foreign funded e-commerce platforms over foreign investment conditions have run for years without a settled outcome.
      The Fix: Require an annual statutory auditor’s certificate on compliance with the export condition, filed with the Reserve Bank of India.
    4. The marketplace disputes are left where they were: The standing complaints of small retailers concern preferential seller arrangements inside the marketplace model, which this permission does not touch. Eg. The Competition Commission of India’s investigation into preferred sellers and deep discounting on major platforms began in 2020.
      The Fix: Conclude the pending competition proceedings on preferential seller arrangements, so the marketplace conditions are enforced on their own terms.

    Conclusion

    India’s foreign investment rules now treat ownership of goods and sale of goods as two separate permissions. The carve out is drawn narrowly, so its practical worth depends entirely on how the export destination is verified rather than on the width of the wording. The marker to watch is whether operating conditions specifying that verification follow, and whether foreign funded platforms build export volumes large enough to make the permission material.

    Back2Basics: Foreign Exchange Management (Non-debt Instruments) Rules, 2019

    1. What they are: Rules made under the Foreign Exchange Management Act, 1999 governing investment by a person resident outside India in equity and other non-debt instruments.
    2. Who issues them: The Department of Economic Affairs in the Ministry of Finance notifies them.
    3. What they carry: Sectoral caps, entry routes and the specific conditions attached to foreign investment in each sector.
    4. Why they matter: A change announced as foreign investment policy takes legal effect only when these Rules are amended.

    Matching Previous Year Question

    “[2020] With reference to Foreign Direct Investment in India, which one of the following is considered its major characteristic? (a) It is the investment through capital instruments essentially in a listed company. (b) It is a largely non-debt creating capital flow. (c) It is the investment which involves debt-servicing. (d) It is the investment made by foreign institutional investors in the Government securities. ANSWER: (b)”

  • Needed: More stable foreign capital

    Why in the News

    Inflows through the Reserve Bank of India’s (RBI) forex swap facility reached $136.3 billion by 31 August. The facility was part of a set of measures announced in June to draw capital into the country, and it was opened against doubts about how much could be raised in tight global financial conditions. Foreign exchange reserves have touched a record $729 billion and the rupee’s slide has been arrested. The same inflow has pushed the banking system’s liquidity surplus to Rs 6.7 lakh crore, at a point when inflation is edging up and the Monetary Policy Committee (MPC) may need to raise rates. Most of the money arrived as Foreign Currency Non Resident Bank, or FCNR(B), deposits, which are repayable debt rather than the stable equity investment a current account deficit requires.

    What is the FCNR(B) and swap route?

    1. The deposit is a foreign currency liability of the bank: An FCNR(B) deposit is a term deposit placed by a non resident Indian in foreign currency with an Indian bank. The bank repays principal and interest in that same currency, so the depositor carries no rupee exchange risk.
    2. The swap converts those dollars into rupees at a fixed cost: Under a swap facility the bank sells the mobilised dollars to the RBI for rupees, with an agreement to reverse the transaction at a pre agreed rate on a fixed future date.
    3. A concessional swap rate is what makes the route attractive: The central bank absorbs part of the hedging cost, which lifts the effective return the bank can offer a depositor without taking currency risk itself.
    4. Two borrowing channels run alongside: External Commercial Borrowings (ECB), meaning foreign currency loans raised abroad by Indian companies, and Overseas Foreign Currency Borrowings (OFCB) raised by banks, carry the balance of the flows.

    How large were the inflows, and what did they buy?

    1. The response exceeded expectations: $136.3 billion came in by 31 August, of which $63.5 billion arrived in the last ten days alone.
    2. The deposit route dominated: $127 billion came through FCNR(B), with the balance through the ECB and OFCB channels.
    3. Reserves hit a record: Foreign exchange reserves reached $729 billion on 21 August, which strengthens the buffer for external stability.
    4. The currency stabilised: The rupee’s fall was stemmed and it touched a two month high of Rs 94.60 to the dollar on 3 September.
    5. The window is not exhausted: About $9 billion more remains available through an ECB and OFCB swap window that stays open till December.

    Why does the same inflow complicate monetary management?

    1. Every dollar swapped injects rupees: The liquidity surplus in the banking system rose from over Rs 3 lakh crore at the beginning of August to Rs 6.7 lakh crore by the end of it.
    2. Independent estimates put the overhang higher: Surplus liquidity stood at Rs 9.71 lakh crore on 2 September, against a preferred level of about Rs 2.7 lakh crore.
    3. One absorption tool is doing all the work: The central bank has responded with variable rate reverse repo auctions, in which banks bid to park surplus funds with it for a fixed term. More tools will be needed at this scale.
    4. The timing runs against the policy stance: Inflation is edging upwards and the MPC may need to tighten, and a large surplus pushes short term rates below the policy rate in the opposite direction.
    5. Growth gives the committee room: Robust first quarter growth provides the space and comfort to tighten if the inflation trajectory demands it.

    Why is debt type inflow not a substitute for stable capital?

    1. The underlying deficit is unaddressed: India runs a current account deficit, which has to be financed every year regardless of what a one time window raises.
    2. Equity flows remain thin against the need: Foreign portfolio investors have been net equity buyers over recent months and net foreign direct investment is inching upwards, neither at a scale that finances the deficit on its own.
    3. Deposits are dated money: FCNR(B) deposits are repayable on maturity, so a large single vintage creates a redemption cliff for the central bank to plan around.
    4. The external environment governs the next round: Tighter global financial conditions will influence flows, so a window that worked this year cannot be assumed to work again.

    Challenges to the FCNR(B) and swap route

    1. Redemption bunches at a single future date: A large tranche raised in one window matures together, so the central bank has to arrange dollars for repayment in one narrow period. Eg. The $26 billion raised through the 2013 FCNR(B) swap window came up for redemption together in 2016 and had to be managed through forward market operations.
      The Fix: Stagger maturities across tenors at the point of mobilisation rather than offering a single uniform term.
    2. The subsidy sits on the central bank’s books: A concessional swap rate transfers hedging cost from the banking system to the central bank, which bears the loss if the currency moves against it. Eg. The 2013 window was priced at a concessional swap rate well below the prevailing market forward premium.
      The Fix: Publish the fiscal and balance sheet cost of the concession alongside the inflow figure, so the instrument is judged on net terms.
    3. It raises the debt share of external financing: Deposits and borrowings add to external debt, and equity investment does not. The composition of external financing worsens as the headline reserve number improves. Eg. Short term external debt on residual maturity has repeatedly been flagged in the RBI’s own external debt statistics as a vulnerability indicator.
      The Fix: Tie the window to a parallel timetable for the sectoral foreign direct investment reforms that have been pending, so the debt raised buys time for an equity fix.
    4. Sterilisation of the rupee injection is costly: Absorbing the liquidity created requires paying interest to banks on funds parked with the central bank, which erodes its income. Eg. The surplus is currently being drained through variable rate reverse repo auctions at rates close to the policy rate.
      The Fix: Use longer tenor absorption instruments, including open market sales of government securities, so the drain matches the maturity of the inflow.
    5. The instrument is used as a currency defence rather than a funding decision: A window opened when the rupee is under pressure attracts money for the concession rather than for the economy’s return profile. Eg. Both the 2013 and the current windows followed a sharp depreciation episode.
      The Fix: Keep a standing, non concessional deposit and borrowing framework open through the cycle, so mobilisation does not depend on a crisis trigger.

    Conclusion

    The window has bought external stability and has handed the central bank a domestic liquidity problem in exchange. Neither outcome changes the structural position: a deficit country that finances itself with borrowed money stays exposed to the next tightening in global conditions. What to watch is the composition of financing over the coming quarters rather than the reserve headline, and specifically whether net foreign direct investment rises fast enough to reduce dependence on windows of this kind before the deposits fall due.

    Matching Previous Year Question

    “[2020] If another global financial crisis happens in the near future, which of the following actions/policies are most likely to give some immunity to India? (1) Not depending on short-term foreign borrowings (2) Opening up to more foreign banks (3) Maintaining full capital account convertibility Select the correct answer using the code given below: (a) 1 only (b) 1 and 2 only (c) 3 only (d) 1, 2 and 3 ANSWER: (a)”

  • Perils of comparing GDP from different base years

    Why in the News

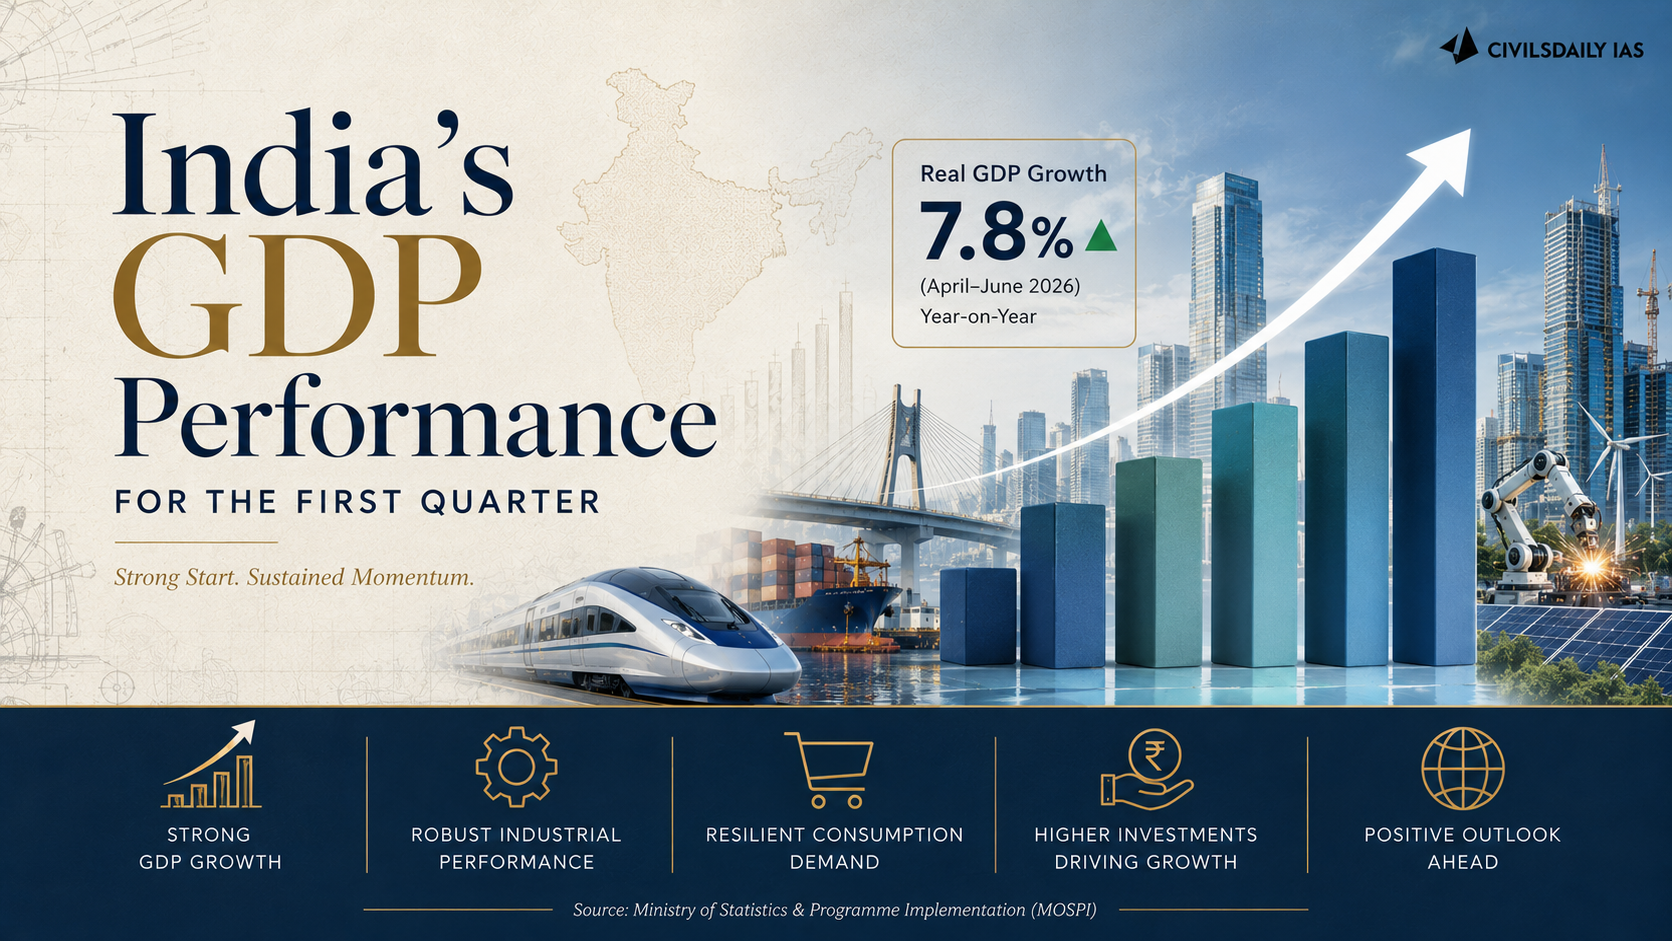
    The Ministry of Statistics and Programme Implementation (MoSPI) has released output data for the first quarter of 2026-27, showing gross domestic product (GDP) growth of 7.8 per cent in real terms and 10.3 per cent in nominal terms. A former Finance Secretary alleged that the corresponding quarter of the previous year had been revised down to produce a flattering comparison, and computed nominal growth of only 2.6 per cent. That computation takes its numerator from the new 2022-23 base year series and its denominator from the discontinued 2011-12 series.

    What does a base year revision do?

    1. The base year anchors the price comparison: A base year is the reference year whose prices are used to strip inflation out of output, so that real growth measures volume rather than price change.
    2. Revision is routine and was overdue: Every economy revises its base year, normally once in about five years. The absence of a revision was itself a reason India’s GDP was losing credibility.
    3. It is an opportunity to rebuild the estimate: A revision lets the government bring in new data sources, improve methodology and capture an economy that has changed since the last base.
    4. It changes real GDP measurement first: Nominal GDP is measured at current prices, so a change of base year does not by itself explain a fall in the nominal series.

    What did the first quarter data show?

    1. Growth beat the expectation set at the start of the quarter: Most economists expected about 7.5 per cent for April to June. The official figure came in at 7.8 per cent in real terms.
    2. The quarter opened in the middle of a war: The West Asia conflict was disrupting output across the world, and India’s heavy dependence on West Asian energy imports was expected to slow growth further.
    3. The world did not contract either: The International Monetary Fund (IMF) expects world growth of 3.0 per cent in 2026 against 2.9 per cent in the previous year, so an economy withstanding the shock is not by itself anomalous.

    Why is the 2.6 per cent claim invalid?

    1. The rollback happened before the war, not after the result: The new series was unveiled on 27 February 2026, one day before the United States went to war with Iran. Nominal GDP for the first quarter of 2025-26 was rolled down that day from Rs 86.1 trillion on the old series to Rs 80.3 trillion on the new one.
    2. Later revisions were marginal: The same quarter was estimated at Rs 80.4 trillion in June and Rs 80.0 trillion on 31 August, against Rs 88.3 trillion for the first quarter of 2026-27.
    3. The sequence rules out reverse engineering: The base was rolled down six months before the current quarter’s number existed, so the previous year’s figure was not cut to flatter it.
    4. The same method produces an absurd result on real GDP: Applied to the real series, mixing the old denominator with the new numerator implies growth of almost 70 per cent in the quarter.

    What question does the revision genuinely leave open?

    1. The first half of 2025-26 lost about Rs 11 lakh crore: Nominal GDP for the first two quarters fell from Rs 171.30 lakh crore on the old series to roughly Rs 160 lakh crore on the new one, a cut of about 6.5 per cent concentrated in those two quarters.
    2. There is nothing left to reconcile against: The old series was discontinued before comparable third and fourth quarter estimates for 2025-26 were published, so no complete old series year exists to match quarter by quarter.
    3. The demand is for a reconciliation bridge: The revision should be broken down in rupees into revised source data, changed sectoral coverage, methodological changes, revised taxes and subsidies, and changed price indices and deflators, for GVA as well as for GDP.
    4. The long run picture is comparable: Nominal GDP rose about 32.8 per cent under the old series and 32.3 per cent under the new one over 2022-23 to 2025-26, and cumulative real growth is broadly similar.
    5. A downward revision is not lost output: The economy did not shrink by Rs 11 lakh crore. Better data can move a historical estimate down.
    6. The annual number moved too: Nominal GDP for 2025-26 was revised from Rs 357 trillion on the old series to Rs 345 trillion on the new one.

    Challenges to India’s national income estimation

    1. Informality is estimated rather than counted: A large share of output comes from unregistered units that no annual return captures, so their contribution is inferred from proxies. Eg. The unincorporated sector is covered by a sample survey, and its output after the 2020 lockdown was derived from indicators rather than enumerated.
      The Fix: Link the enterprise surveys to Goods and Services Tax and Udyam registration data to build a live frame for small units.
    2. Deflators historically overstated value addition: Single deflation applies one price index to output without separately deflating inputs, so a squeeze on firms’ margins is recorded as extra production. Eg. Manufacturing GVA in the 2011-12 series was criticised for a decade on exactly this ground.
      The Fix: The 2022-23 series abolished single deflation, and producer price indices published from June 2026 must now be extended to services.
    3. No back series accompanies the new base: Users cannot compare the new estimates with earlier decades without a consistent recomputed history. Eg. The back series produced for the 2011-12 base was itself contested and withdrawn from circulation.
      The Fix: Publish a full recomputed back series alongside the new base rather than after a lag.
    4. Credibility is contested politically rather than statistically: Each release is judged as a verdict on the government instead of as an estimate with a stated method, which crowds out technical scrutiny. Eg. The IMF has previously raised issues with India’s national income estimates.
      The Fix: Restore a fixed publication calendar for the National Statistical Commission’s own review reports, so scrutiny is institutional rather than episodic.

    Conclusion

    The methodological point is settled and the credibility point is not. A series can be more accurate than the one it replaced and still be harder to interrogate, because the comparison the public used to make has been withdrawn. Confidence in official statistics is built by letting an independent reader reproduce the numbers, not by asserting that the method was correct. The larger unresolved problem sits behind the estimate: output is growing fast and is not generating enough good quality jobs, which is how a demographic dividend turns into a demographic burden.

    [2021, GS3, 10 marks] Explain the difference between computing methodology of India’s Gross Domestic Product(GDP) before the year 2015 and after the year 2015.”

  • The gap in manufacturing sector GVA

    Why in the News

    An alternative estimate of India’s manufacturing output puts gross value added (GVA, the value a sector adds after the cost of the inputs it consumed is deducted) at Rs 27.4 lakh crore for 2023-24. The National Statistical Office (NSO), in the new National Accounts Statistics (NAS) series, puts the same figure at Rs 38.6 lakh crore. The official number is higher by 40.9 per cent.

    How is manufacturing GVA estimated?

    1. The sector is measured in two parts: The organised part covers registered factories employing 10 or more workers with power, or 20 or more without power, including registered companies. The other part covers unincorporated workshops and household units outside the corporate and factory sector.
    2. One survey covers each part: The ASI reports the production accounts of the factory sector. ASUSE covers the unincorporated sector.
    3. The two surveys together are near complete: Their combined output represents almost the whole of manufacturing GVA, so their sum is a usable independent estimate.
    4. Corporate filings partially replace the factory survey: The official series uses company balance sheet data from MCA-21 for organised manufacturing. The practice began with the 2011-12 base revision and continues in the latest revision with minor modifications.

    Why is the gap traced to organised manufacturing?

    1. The official estimate exceeds the survey based one by 40.9 per cent: Rs 38.6 lakh crore against Rs 27.4 lakh crore for 2023-24 at current prices. The official figure is 14.7 per cent of GDP.
    2. The informal segment cannot explain the divergence: ASUSE is the source for the unincorporated sector in both estimates. That segment contributes 13.9 per cent of manufacturing GVA.
    3. Only the corporate route is left: The divergence must therefore arise in the estimation of organised manufacturing output, where the balance sheet data replaces the survey.

    Does the employment check close the gap?

    1. A large body of workers is unaccounted for: The Periodic Labour Force Survey (PLFS, the official household survey that measures employment and unemployment) estimated 697.5 lakh manufacturing workers in 2023-24. The ASI and ASUSE datasets together captured 532.9 lakh.
    2. The residual is 164.6 lakh workers: These workers produce output that neither survey records, and they are the first candidate for explaining the gap.
    3. Companies outside the survey frame are added too: 2,72,534 MCA companies sit outside the 78,618 private companies captured in ASI data. Most of them are likely to be non factory private companies.
    4. Their potential output is small: Applying technical ratios, meaning output per worker ratios derived from unit level ASI and ASUSE data, the residual workers and companies add Rs 3.6 lakh crore. The alternative estimate rises to Rs 31.0 lakh crore.
    5. A fifth of the official figure stays unexplained: Rs 31.0 lakh crore is 24.5 per cent below the official estimate, at 80.3 per cent of it. Rs 7.6 lakh crore, or 19.7 per cent of official manufacturing GVA, remains unaccounted for.

    Why is the official explanation contested?

    1. The stated official defence: The ASI is establishment based, so it does not capture value addition that occurs inside an enterprise but outside factory premises, in head office, marketing and distribution, or research and development functions.
    2. The evidence cited against it: A 2018 study in the Economic and Political Weekly found that the available evidence does not support that view, so the missing head office value addition cannot carry a gap of this size.
    3. The alternative suspicion is the scaling method: The official procedure scales up sample estimates of active companies to the full universe of registered companies. The size and composition of that universe are unverified.

    Challenges to the official manufacturing GVA estimate

    1. The company universe is unverified: Scaling a sample of active filers onto the full corporate register counts companies that have stopped operating. Eg. The Ministry of Corporate Affairs struck off more than 2 lakh companies from the register in 2017 for failing to file returns.
      The Fix: Publish an annual active company frame reconciled against Goods and Services Tax filings before it is used for scaling.
    2. The unit of measurement changes between sources: The ASI counts factories and MCA-21 counts companies, so one firm with several plants enters the two datasets on different terms. Eg. The 2011-12 base revision inserted the company based route into a series that until then rested on the factory based survey alone.
      The Fix: Publish a factory to company concordance so the two frames can be matched establishment by establishment.
    3. The methodology is not open to outside checking: Neither the MCA data nor the scaling procedure is available for independent replication, so a disputed figure cannot be settled by evidence. Eg. The National Statistical Commission’s 2018 back series report was withdrawn from the public domain shortly after its release.
      The Fix: Release anonymised unit level MCA-21 data and the full estimation procedure to researchers on a fixed schedule.
    4. Informal manufacturing is measured least well: ASUSE misses the smallest own account units, so the segment most exposed to shocks is estimated rather than enumerated. Eg. Output of unincorporated units after the 2016 demonetisation and the 2020 lockdown was inferred from indicators rather than counted.
      The Fix: Run ASUSE at a higher frequency and link it to the Udyam registration database for a live enterprise frame.

    Conclusion

    Whether the official figure is a fuller description of ground reality or an overestimate of output cannot be settled from outside the statistical system. The dispute has moved from arithmetic to access. Opening the corporate filings and the estimation procedure to independent verification is the only step that would close it. Every downstream number built on manufacturing GVA, from sectoral growth to the investment rate, carries the same doubt until that happens.

    [2023, GS3, 10 marks] Faster economic growth requires increased share of the manufacturing sector in GDP, particularly of MSMEs. Comment on the present policies of the Government in this regard.

  • India’s GDP Performance for the first quarter

    India’s GDP Performance for the first quarter

    Why in the News

    The quarterly Gross Domestic Product (GDP) estimates for the April to June quarter of financial year 2026 27 were released.

    Core Facts

    1. Compiling body: The National Statistics Office (NSO), the official statistics agency under the Ministry of Statistics and Programme Implementation (MoSPI), compiles GDP.
    2. Two approaches: GDP is estimated through the production side. It is also estimated through the expenditure side.
    3. Production measure: The production side is built from Gross Value Added (GVA), the value of output minus the value of inputs at each stage.

    Static Context

    1. GDP and GVA link: GDP equals GVA plus product taxes minus product subsidies.
    2. Base year: The current GDP series uses a 2011 12 base year, and the revision took effect in January 2015.
    3. Methodology shift: The 2015 revision moved to GVA at basic prices and expanded use of the corporate database for the industrial sector.
    4. Real and nominal: Real GDP is measured at constant prices and nominal GDP at current prices.

    Prelims Angle

    1. The difference between GDP and GVA is a repeat hook.
    2. The base year is 2011 12 and the compiling body is the NSO under MoSPI.
    3. Market prices versus basic prices is a standard trap.

    Mains Angle

    1. GS3, Indian economy, planning and growth: A question can ask about the 2015 methodology change.
    2. The growth side: It can ask about potential GDP and the factors holding India below it.

    [2021, GS3, 10 marks] Explain the difference between computing methodology of India’s Gross Domestic Product(GDP) before the year 2015 and after the year 2015.”

  • Districts as Export Hubs push decentralised trade growth

    Districts as Export Hubs push decentralised trade growth

    Why in the News

    The Districts as Export Hubs (DEH) initiative was profiled as a route to raise India’s export base from the district level.

    Core Facts

    1. Objective: The DEH initiative treats every district as an export hub. It identifies products and services in each district with export potential.
    2. Institutional design: A State Export Promotion Committee (SEPC) operates at the state level. A District Export Promotion Committee (DEPC) operates at the district level.
    3. Planning tool: Each district prepares a District Export Action Plan (DEAP). The plan maps products, gaps and support needed.
    4. Nodal body: The Directorate General of Foreign Trade (DGFT), the agency under the Ministry of Commerce and Industry that regulates India’s exports and imports, coordinates the initiative.
    5. Convergence: The initiative aligns with the One District One Product (ODOP) programme.

    Static Context

    1. Policy anchor: The Foreign Trade Policy, 2023 institutionalised districts as export hubs as a core strategy.
    2. Governing agency: DGFT issues the Foreign Trade Policy and administers export promotion schemes.
    3. ODOP link: ODOP selects one flagship product per district for branding and market access.

    Prelims Angle

    1. Nodal agency for DEH is the DGFT under the Ministry of Commerce and Industry.
    2. The two tier structure is SEPC and DEPC.
    3. The policy anchor is the Foreign Trade Policy, 2023, and ODOP convergence is a likely factual hook.

    Mains Angle

    1. GS3, Indian economy and mobilisation of resources: A question can ask how decentralised export promotion raises India’s share in global trade.
    2. The constraint side: It can probe constraints of logistics, credit and quality certification at the district level.
  • Govt rejects GDP criticism, expects ‘informed debate’ once methods understood

    Govt rejects GDP criticism, expects ‘informed debate’ once methods understood

    Why in the News

    The Ministry of Statistics and Programme Implementation (MoSPI) has issued a six point rebuttal asserting that its methods and its recently released quarterly numbers are correct. Data showed India’s Gross Domestic Product (GDP) grew 7.8 per cent in April to June, significantly higher than the Reserve Bank of India’s forecast of 7 per cent. Economists, former bureaucrats and politicians then questioned the figure, one claim putting nominal growth at 2.6 per cent and real growth “close to 0”. The dispute turns on a single technical point. A number from the old 2011-12 base series and a number from the new 2022-23 base series are being compared with each other, and the ministry’s position is that they cannot be.

    What is double deflation?

    1. Gross Value Added, first: To find the value added by a sector, the value of the inputs it uses is subtracted from the value of the output it produces. This gives Gross Value Added (GVA) in current prices, or nominal terms.
    2. Deflating twice: To reach real GVA, the output value and the input value are each adjusted by their own inflation rate rather than by a single common rate.
    3. Why a single rate distorts: Deflating inputs and outputs by the same number is problematic when input and output prices change at different rates, which is exactly when a sector’s real growth is hardest to read.

    What did the criticism of the quarterly numbers claim?

    1. The deflator objection: Some economists were unconvinced by the figure used to deflate the manufacturing sector’s GVA in current prices to arrive at the inflation adjusted estimate.
    2. The growth rate claim: A former Finance Secretary argued that nominal GDP growth for April to June should be 2.6 per cent, and in real terms close to zero.
    3. The allegation of manipulation: The same critic claimed that April to June 2025 nominal GDP was revised down from Rs 86 lakh crore to Rs 80 lakh crore in order to make growth in April to June 2026 look better.

    How did the statistics ministry answer the comparison?

    1. The two figures sit in different series: The ministry pointed out that the Rs 86.05 lakh crore figure belongs to the old GDP series, which had 2011-12 as its base year.
    2. The revision has a stated cause: The move to Rs 80.00 lakh crore in the new series arose from successive revisions to the GDP series following the change in base year, the incorporation of improved data sources and methodologies, and the updation of available indicators.
    3. The inference is rejected: The ministry held that it is “incorrect to interpret the difference as a deliberate downward revision of last year’s GDP to mechanically increase the current year’s growth rate”.
    4. The method objection: One cannot compare GDP numbers drawn from different series to arrive at a growth rate, which is what the critic had done.

    What changed in the new GDP series?

    1. A new base year: The series with 2022-23 as its base was released in February this year, bringing in new sources of data and several methodological changes in the calculation of GDP.
    2. Long sought changes: Those changes include ones that economists and international agencies such as the International Monetary Fund (IMF) had been calling for over several years.
    3. Double deflation extended to all sectors: Before the new series, MoSPI applied double deflation only to agriculture and to mining and quarrying, deflating every other sector’s inputs and outputs by the same number using the Wholesale Price Index and the Consumer Price Index.
    4. A finer deflator set: The Producer Price Index now supplies more than 300 deflators for different parts of GDP, up from around 180 under the old series, which makes the new estimates more accurate.
    5. Other inputs behind the revisions: The updated Index of Industrial Production series and the Banking Services Price Index released earlier this year also fed the revisions, including the January to March growth rate being raised from 7.8 per cent to 8.6 per cent.

    Conclusion

    The disagreement is not about whether the economy grew. It is about whether a statistical office is entitled to change its base year, its data sources and its deflation method at the same time, and then publish a growth rate against a back series it has itself rebuilt. The ministry’s answer is that comparability lives within a series and not across two of them. The test of that answer is transparency, and what to watch is whether the full back series on the new base is published in a form that lets an outside statistician reproduce the quarterly numbers independently.

    Back2Basics: Producer Price Index

    1. What it measures: A Producer Price Index tracks the average change over time in prices received by domestic producers for their output, measured at the factory gate.
    2. How it differs from the Wholesale Price Index: It excludes trade margins, transport costs and indirect taxes, so it reflects the producer’s own realisation rather than the price at which a good changes hands in wholesale markets.
    3. Why it suits deflation: It covers services as well as goods, which a wholesale price measure does not, so it can deflate sectors a goods only index cannot reach.
    4. Status in India: India has worked towards a PPI on the recommendation of an official working group, with the wholesale index historically serving as the main producer side price measure.

    “[2021, GS3, 10 marks] Explain the difference between computing methodology of India’s Gross Domestic Product(GDP) before the year 2015 and after the year 2015.”

  • Forex swap rakes in over $136 bn

    Forex swap rakes in over $136 bn

    Why in the News

    Foreign exchange inflows under the Reserve Bank of India’s (RBI) special swap facility have crossed $136 billion, surpassing all projections. The facility was introduced on 8 June this year to deal with forex outflows caused by high oil prices and by the exit of Foreign Portfolio Investors from the stock market. The task has now shifted from raising dollars to managing what they release. Every dollar brought in creates rupee liquidity in the banking system, and the RBI has already begun absorbing it to stop call rates falling below the policy rate.

    What is the RBI’s special USD-INR swap facility?

    1. What it does: The facility lets a bank exchange dollars raised abroad for rupees with the RBI at a concessional rate, with a commitment to reverse the exchange at a future date.
    2. What it covers: It applies to three instruments, Foreign Currency Non-Resident (Bank) or FCNR(B) deposits, Overseas Foreign Currency Borrowings (OFCBs), and External Commercial Borrowings (ECBs).
    3. Why it was opened: It was designed to attract fresh foreign currency at a time when the rupee and India’s reserves were under pressure from oil prices and portfolio outflows.

    Where did the $136 billion come from?

    1. The total mobilised: A total of $1,36,377 million has been mobilised, according to data released by the RBI.
    2. FCNR(B) deposits dominate: Deposits by overseas Indians accounted for $1,27,226 million, the overwhelming share of the mobilisation.
    3. Corporate borrowing contributed little: OFCBs brought in $5,260 million and ECBs a further $3,891 million.

    Why does the RBI’s short forward dollar position matter now?

    1. What a short forward position is: Short forward dollars are currency derivative contracts in which the RBI commits to sell dollars at a future date at a predetermined rate.
    2. Why the RBI built one: The instrument defends the rupee without drawing down spot reserves immediately, so the headline reserve figure holds while the commitment sits in the forward book.
    3. The size of the book: The RBI carries an outstanding short forward position of $137 billion, close to the entire mobilisation under the swap facility.
    4. How the two connect: If the RBI decides not to roll over those positions, it may use the excess reserves generated from the FCNR(B) scheme to deliver the dollars it has contracted to sell.

    What does the inflow do to domestic liquidity?

    1. Rupees enter as dollars arrive: Delivering on the forward book absorbs rupee liquidity from the banking system, which is why the RBI has begun draining it before call rates slip under the policy rate.
    2. The surplus is large: Banking system liquidity stood at Rs 6.5 lakh crore, and the RBI may absorb part of it so short term money supply does not feed into inflation and borrowing costs stay aligned with the policy rate.
    3. Banks gain a cheap funding base: In the immediate term banks are inclined to use the inflow to strengthen their asset side books and cut their dependence on wholesale deposits.
    4. The longer use is credit: Over a longer horizon the same liquidity can be deployed to fund credit growth.

    Conclusion

    The facility has done more than it was designed to do, and the constraint has moved from the external account to the domestic money market. The decision that now matters is whether the central bank rolls its forward commitments over or lets them run off against the deposits it has raised. Rolling over keeps the liquidity in the system; delivering drains it. That choice, and the pace at which it is made, is what will determine short term rates over the coming quarter.

    Back2Basics: External Commercial Borrowings

    1. What they are: ECBs are loans raised by eligible Indian entities from recognised non resident lenders, denominated in foreign currency or in rupees.
    2. Forms they take: They cover bank loans, buyers’ and suppliers’ credit, and instruments such as foreign currency convertible bonds.
    3. How they are regulated: The RBI governs them under the Foreign Exchange Management Act, 1999, through the automatic route up to prescribed limits and the approval route beyond them.
    4. What the framework controls: The rules set the minimum average maturity, the all in cost ceiling and the end uses for which the borrowed money may be applied.

    [2022] With reference to the Indian economy, consider the following statements :

    1. An increase in Nominal Effective Exchange Rate (NEER) indicates the appreciation of rupee.

    2. An increase in the Real Effective Exchange Rate (REER) indicates an improvement in trade competitiveness.

    3. An increasing trend in domestic inflation relative to inflation in other countries is likely to cause an increasing divergence between NEER and REER.

    Which of the above statements are correct ?

    (a) 1 and 2 only

    (b) 2 and 3 only

    (c) 1 and 3 only

    (d) 1, 2 and 3

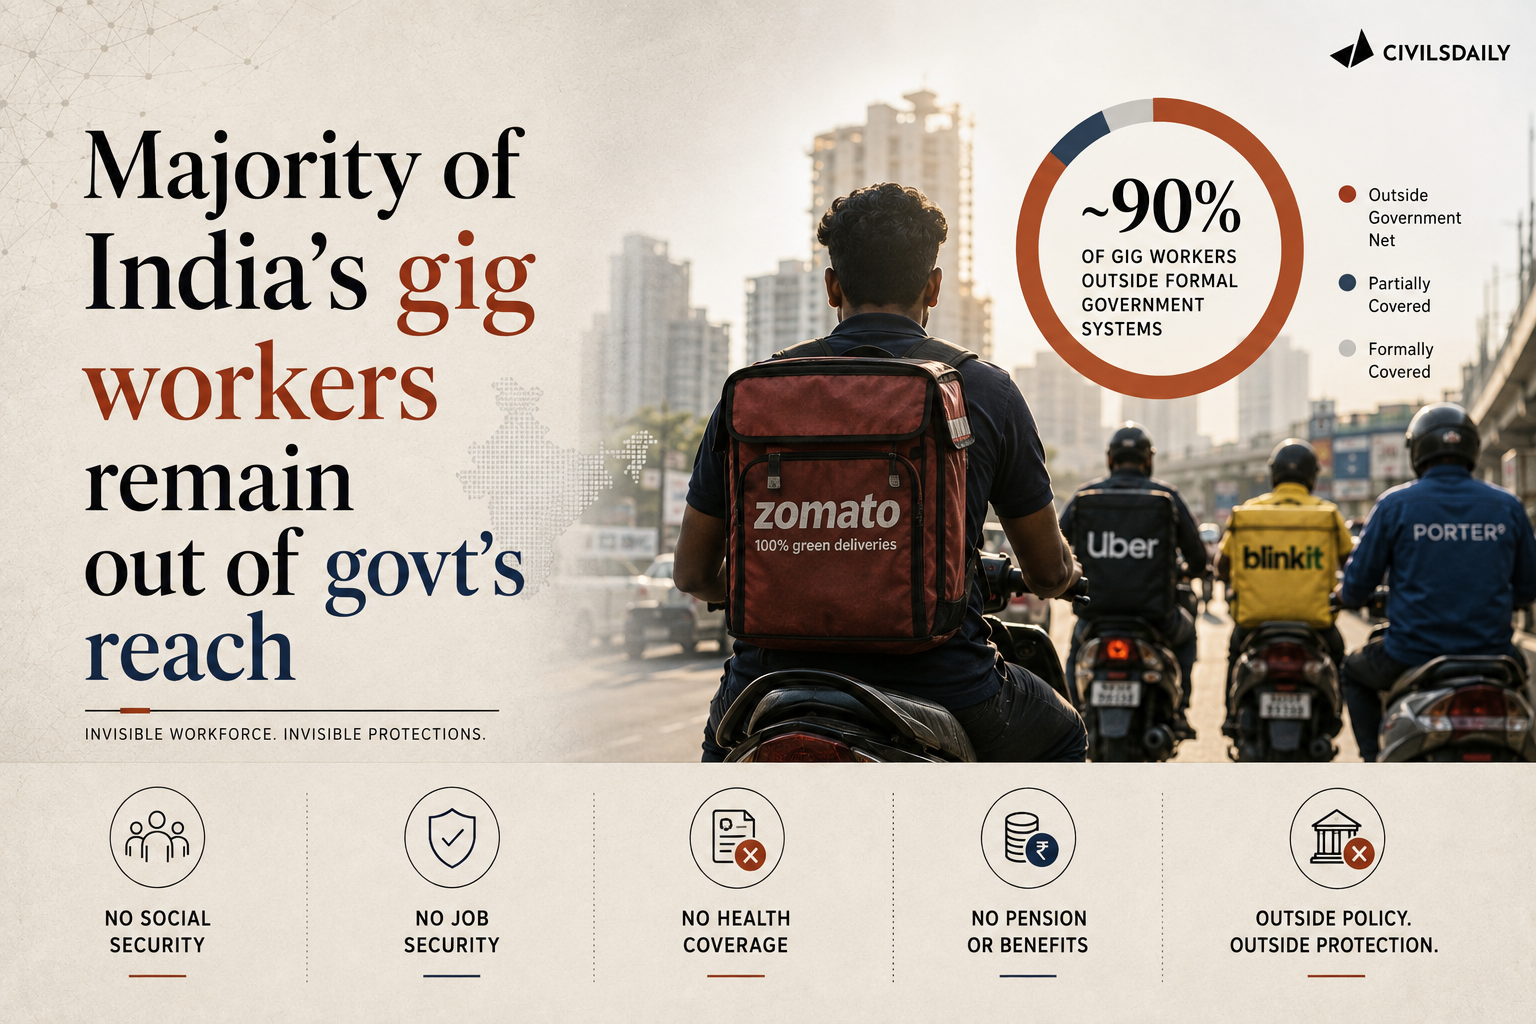
  • Majority of India’s gig workers remain out of govt’s reach

    Majority of India’s gig workers remain out of govt’s reach

    Why in the News

    Only 8.58 lakh gig workers stood registered on the e-Shram portal as of the Ministry of Labour and Employment’s reply in the Rajya Sabha in January 2026, the latest publicly available figure.

    How far has the Budget’s health cover promise actually reached?

    1. Registration against the promise: The Budget’s beneficiary figure of over one crore compares with 8.58 lakh registrations on e-Shram, the figure the Ministry gave Parliament in January 2026.
    2. The optimistic case still falls short: A doubling of registrations since January would still cover only around 15 percent of the estimated gig workforce.
    3. The promise itself drove enrolment: Registrations of gig workers on e-Shram rose sharply from 2025, and the health cover announcement is the visible cause of that surge.
    4. Registration is the gate to every benefit: Registration on e-Shram is a prerequisite for availing benefits, so an unregistered gig worker is invisible to the scheme by design.

    Why does the government not know how many gig workers India has?

    1. One source for every estimate: The figure of over one crore gig workers, quoted in many government replies in Parliament last year, comes from a single document, the NITI Aayog report “India’s Booming Gig and Platform Economy” released in June 2022.
    2. What that report estimated: It put the gig workforce at around 77 lakh in 2020-21 and projected 1.27 crore in 2024-25 and 1.43 crore in the year after.
    3. No dedicated measurement effort exists: In the absence of any effort to measure the gig workforce, official estimates rely solely on this NITI Aayog report.
    4. The national labour survey does not count them: The Periodic Labour Force Survey (PLFS) reports do not capture gig workers as a distinct category, even though the estimated gig workforce is about 2 percent of India’s total workforce of 61.6 crore as cited by the 2025 PLFS report.

    What has the government built for gig workers, and what has not arrived?

    1. e-Shram as the single register: The portal, launched in 2021, is conceptualised as an Aadhaar-seeded National Database of Unorganised Workers (NDUW) and has become the unified platform for tracking the unorganised workforce, including gig workers.
    2. A legal definition came only in 2020: The government officially defined a gig worker only in the Code on Social Security, 2020, which came into force last year.
    3. The Code’s promises remain largely on paper: The Code promised accident insurance, maternity benefits and a dedicated social security fund for gig workers, and most of these are yet to materialise.

    Where are the registered gig workers, by State and by sector?

    1. Registrations are uneven across States: The ten States with the most registered gig workers as of January 2026 are led by West Bengal (54,734), Delhi (49,479), Andhra Pradesh (39,212), Rajasthan (38,205), Karnataka (37,871), Gujarat (34,756) and Madhya Pradesh (34,351), with Maharashtra, Uttar Pradesh and Bihar completing the list.
    2. Urbanised southern States are missing from the top ten: Tamil Nadu (31,654), Telangana (29,951) and Keralam (11,219) are not among the ten States with the highest registrations, despite their high urbanisation.
    3. Twenty one sectors on paper, three in practice: NITI Aayog’s 2022 report listed 21 sectors with gig workers, including agriculture, healthcare, education and retail, but e-Shram registrations concentrate in the food industry, transportation, and domestic and household work.
    4. The sector shares are lopsided: The largest single sector accounts for 32.8 percent of registered gig workers, and construction (3.6 percent) and agriculture (3.4 percent) are the smallest of the top five sectors.

    Challenges to e-Shram as the gateway for gig worker welfare

    1. Enrolment depends on the worker, not the platform: e-Shram is a self-registration portal, and no aggregator is obliged to enrol the workers it engages. Eg. The Rajasthan Platform Based Gig Workers (Registration and Welfare) Act, 2023 instead makes aggregators register their workers with a State welfare board.
      The Fix: Require aggregators to push worker data into e-Shram at onboarding under the Code on Social Security, 2020, so registration stops depending on individual initiative.
    2. No survey category means no target to measure against: Without a gig work module in the labour survey, the government cannot say what share of the workforce any scheme covers. Eg. The Ministry’s January 2026 reply to Parliament could cite portal registrations but no survey count.
      The Fix: Add a platform and gig work classification to the PLFS questionnaire so coverage is measured against a surveyed denominator.
    3. The funding source has not been built: The Code provides for aggregator contributions of 1 to 2 percent of annual turnover, capped at 5 percent of payments to workers, and the fund those contributions were to feed has not materialised. Eg. Karnataka’s Platform Based Gig Workers (Social Security and Welfare) Act, 2025 levies its own transaction fee because no central fund is flowing.
      The Fix: Notify the contribution rules and the social security fund so central benefits do not depend on Budget-by-Budget announcements.
    4. State schemes fragment portability: State-level gig worker boards create separate registrations and benefits for a workforce that moves across State lines. Eg. A delivery worker registered in Rajasthan gains nothing from Karnataka’s fund on relocating.
      The Fix: Make e-Shram the single identifier that State boards read from, so benefits follow the worker across States.

    Conclusion

    The health cover promise has produced registrations faster than any earlier measure, but the register still holds a fraction of the workforce the promise was made for. The deeper problem is a denominator the state has never measured. The next e-Shram registration figure released to Parliament, and whether the Code’s social security fund is finally notified, are the two markers to watch.

    Back2Basics: Gig worker and platform worker under the Code on Social Security, 2020

    1. Gig worker: A person who performs work or participates in a work arrangement and earns from such activities outside the traditional employer-employee relationship.
    2. Platform worker: A person in platform work, meaning work arranged through an online platform that connects organisations or individuals with workers to provide specific services for payment.
    3. Aggregator: A digital intermediary or marketplace through which a buyer or user connects with a seller or service provider, the entity the Code identifies for contributions.
    4. Why the definitions matter: They are the first statutory recognition of gig work in India, and eligibility for the Code’s social security schemes is tied to them.

    [2024, GS3, 15 marks] Discuss the merits and demerits of the four ‘Labour Codes’ in the context of labour market reforms in India. What has been the progress so far in this regard?”