💥Join UPSC 2027,2028 Mentorship (July Batch) + XFactor Notes & Microthemes PDF

GS Paper: Indian Economy

  • Electronic Gold Receipts (EGRs) 

    Why in the News

    The National Stock Exchange of India has introduced Electronic Gold Receipts (EGRs) to digitise gold trading and bring greater transparency to India’s gold market.

    What are Electronic Gold Receipts (EGRs)

    • Digital securities representing ownership of physical gold
    • Gold is stored in SEBI accredited vaults
    • Similar to holding shares in a demat account
    • Each EGR is backed by real physical gold

    How EGRs Work

    • Physical gold deposited in a vault → converted into EGR units
    • Investors can:
      • Buy and sell EGRs on exchange
      • Convert EGRs back into physical gold
    • Example: A 1000 gram gold bar can be converted into EGRs

    Key Features

    • Backed by physical gold
    • Tradeable on stock exchanges
    • Stored securely in regulated vaults
    • Enables fractional ownership

    Role of SEBI

    • Securities and Exchange Board of India regulates:
      • Vault managers
      • Trading framework
      • Investor protection
    [2016] Which of the following is/are the purpose/purposes of Government’s ‘Sovereign Gold Bond Scheme’ and ‘Gold Monetization Scheme’?: 
    1.To bring the idle gold lying with Indian households into the economy. 
    2.To promote FDI in the gold and jewellery sector. 
    3.To reduce India’s dependence on gold imports. 
    Select the correct answer using the code given below: 
    [A] 1 only [B] 2 and 3 only [C] 1 and 3 only [D] 1, 2 and 3
  • Is the rupee back to the ‘fragile five’ days of 2013

    Why in the News?

    The Indian rupee has sharply depreciated to around ₹95 per US dollar, marking a ~12% fall over the last year-far steeper than its usual 3-4% annual decline. This sudden slide has revived concerns of a return to the 2013 ‘Fragile Five’ crisis, when India faced twin deficits and currency instability. The current situation is alarming because India is once again witnessing pressure on both current account and capital flows. This is a combination that historically triggered macroeconomic vulnerability.

    What defines the ‘Fragile Five’ and why was India included in 2013?

    1. Fragile Five Concept: Morgan Stanley identified five vulnerable emerging economies, India, Indonesia, Brazil, South Africa, Turkey, due to macroeconomic weaknesses.
    2. High Current Account Deficit: India imported more goods/services than it exported, creating external imbalance.
    3. Capital Flow Dependence: Heavy reliance on foreign investments made India vulnerable to global shocks.
    4. Quantitative Easing Impact: US Federal Reserve tapering reduced global liquidity, triggering capital outflows.
    5. Currency Depreciation Data:
      1. Indonesian Rupiah: Down 15.4%
      2. Brazilian Real: Down 17.6%
      3. South African Rand: Down 14.4%
      4. Turkish Lira: Down 19.9%

    How severe is the current rupee depreciation compared to historical trends?

    1. Sharp Depreciation: Rupee fell ~12% in 12 months vs normal 3-4% annual decline.
    2. Exchange Rate Movement: ₹60 per USD (2013) to ₹85 (2025) to ₹95+ (2026).
    3. Comparison with Peers:
      1. Indian Rupee: Down 12.09%
      2. Turkish Lira: Down 17.17%
      3. Indonesian Rupiah: Down 4.33%
    4. Contrasting Trends:
      1. Brazilian Real: Up 12.7%
      2. South African Rand: Up 9.98%
    5. Inference: India is among the worst-performing emerging market currencies currently.

    What role do current and capital account deficits play in currency weakness?

    1. Current Account Deficit (CAD): Imports exceed exports; net dollar outflow.
    2. Capital Account Deficit: Foreign investments decline or reverse; reduced dollar inflow.
    3. Twin Deficit Problem: Simultaneous CAD + capital outflow intensifies currency pressure.
    4. 2013 Scenario: India faced deficits in both accounts and hence it led to severe depreciation.
    5. 2025 Situation: Data indicates deficits emerging again in both accounts.
    6. Impact Mechanism:
      1. More dollars leaving than entering; rupee depreciation.
      2. Forex reserves used to stabilize currency; sustainability concerns.

    How does 2026 differ from the 2013 crisis despite similarities?

    1. Gradual vs Sudden Fall:
      1. 2013: Sharp fall within months
      2. 2026: Gradual but sustained depreciation
    2. Backloaded Weakness: Current fall spread across years rather than concentrated.
    3. Global Context:
      1. Then: US taper tantrum
      2. Now: Persistent global interest rate tightening
    4. Structural Improvements:
      1. Better forex reserves now
      2. Stronger inflation targeting framework

    Why is India again facing pressure on both external accounts?

    1. Export Weakness: Sluggish global demand affecting Indian exports.
      1. Goods exports fell 0.81% in February 2026, largely driven by a 40% drop in petroleum shipments.
    2. Import Dependence: High imports of oil and capital goods.
      1. India’s merchandise imports surged by 24.1% year-on-year to $63.71 billion in February 2026. This was primarily driven by a massive spike in gold and silver inflows and increased electronics demand. This widened the merchandise trade deficit for the fiscal year to over $333 billion.
    3. Manufacturing Competitiveness: Competition from China, Vietnam, Bangladesh.
      1. Competitiveness with China is impacted as it is specifically leveraging its supply chain to restrict key materials like solar inputs and rare earths (Gallium, Germanium).
    4. Capital Flight: Foreign investors reducing exposure to Indian markets.
    5. Negative FDI Trends: Indians investing abroad more than foreigners investing in India.

    What are the macroeconomic implications of sustained rupee depreciation?

    1. Imported Inflation: Higher cost of oil and imports increases inflation.
      1. A 5% depreciation in the rupee is estimated to raise inflation by approximately 15-25 basis points on an annualized basis.
    2. External Debt Burden: Dollar-denominated debt becomes costlier.
      1. Indian companies and the government face a higher cost of servicing dollar-denominated debt (External Commercial Borrowings (ECBs)).
      2. As the rupee weakens, more currency is needed to repay the same amount of principal and interest in dollars, creating severe “balance sheet stress” and reducing funds available for investment.
    3. Forex Reserve Pressure: The Reserve Bank of India (RBI) actively intervenes in the foreign exchange market to manage volatility, selling billions of dollars to prevent a steeper decline. This sustained intervention reduces foreign exchange reserves, decreasing the country’s buffer against external shocks.
    4. Investment Sentiment: Currency instability deters foreign investors.
    5. Growth Impact: Higher import costs and inflation reduce consumption and investment.
    6. Wider Trade and Current Account Deficit (CAD): While a weak rupee usually helps exports, the high import dependence of Indian export-oriented sectors means that rising input costs often offset the competitive advantage. As a result, the trade deficit often widens rather than shrinks.

    Conclusion

    The rupee’s depreciation signals structural vulnerabilities in India’s external sector. While not identical to 2013, the re-emergence of twin deficits and capital flow volatility warrants policy vigilance. Strengthening exports, improving manufacturing competitiveness, and stabilizing capital flows remain critical.

    PYQ Relevance

    [UPSC 2018] How would the recent phenomena of protectionism and currency manipulations in world trade affect macroeconomic stability of India?

    Linkage: The PYQ links global protectionism and currency manipulation to capital flows, trade balance, and exchange rate volatility, which are core drivers of Current Account Deficit and rupee depreciation. The article explains how external shocks + domestic deficits can push India towards ‘Fragile Five’-like macro instability, exactly reflected in the current rupee slide.

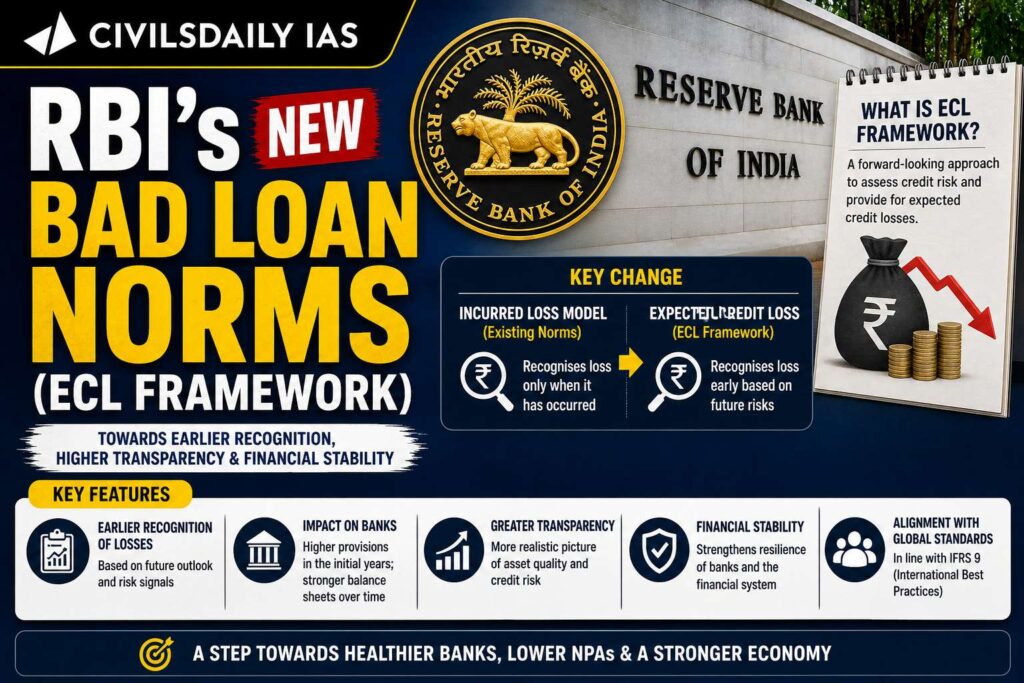
  • RBI’s New Bad Loan Norms (ECL Framework) 

    Why in the News

    The Reserve Bank of India has introduced a new framework based on Expected Credit Loss (ECL) for provisioning of bad loans, which may lead to a short term increase in costs for banks.

    What is Expected Credit Loss (ECL)

    • A forward looking approach to estimate loan losses
    • Considers future risk of default rather than past defaults
    • Aligns with global standard IFRS 9

    Key Features of New Norms

    Three Stage Classification of Loans

    • Stage 1: Low or no credit risk
      • Provision based on 12 month ECL
    • Stage 2: Significant increase in credit risk
      • Provision based on lifetime ECL
    • Stage 3: High credit risk or default
      • Provision based on lifetime ECL

    Important Changes

    • Borrower Level NPA Classification: If one loan becomes NPA, all loans of the borrower become NPA
    • NPA Definition: Loan classified as NPA if overdue for more than 90 days
    • Upgrade Rule: Borrower must repay all dues to become a standard asset again

    Impact on Banks

    • Possible increase in provisioning requirements
    • Short term reduction in profits
    • Impact on capital (CET 1 ratio)
    • Higher impact on:
      • Microfinance lending
      • Unsecured retail loans

    Key Terms

    • Non Performing Asset (NPA): Loan where repayment is overdue beyond 90 days.
    • Provisioning: Setting aside funds by banks to cover potential loan losses.
    • CET 1 (Common Equity Tier 1): Core capital of banks used to absorb losses.
    [2021] Consider the following statements: 
    1.Capital Adequacy Ratio (CAR) is the amount that banks have to maintain in the form of their own funds to offset any loss that banks incur if any account-holders fail to repay dues. 
    2.CAR is decided by each individual bank. 
    Which of the statements given above is/are correct? 
    [A] 1 only [B] 2 only [C] Both 1 and 2 [D] Neither 1 nor 2
  • FDI Inflows in India 

    Why in the News?

    India’s Foreign Direct Investment (FDI) inflows are expected to cross 90 billion dollars in FY 2025–26, according to the Department for Promotion of Industry and Internal Trade (DPIIT).

    Key Facts

    • FDI inflows (April–February 2025–26): 88 billion dollars
    • Expected total for FY 2025–26: over 90 billion dollars
    • Indicates strong investor confidence in India

    What is Foreign Direct Investment (FDI)

    • Investment by a foreign entity in:
      • Business operations
      • Assets in another country
    • Involves long term interest and control

    Key Drivers of Rising FDI

    • Economic reforms by the government
    • Expansion of Free Trade Agreements (FTAs)
    • Strong economic growth prospects
    • Improved ease of doing business

    Types of FDI

    • Greenfield Investment: Setting up new business operations
    • Brownfield Investment: Investment in existing companies or assets

    Role of DPIIT

    • Works under the Ministry of Commerce and Industry
    • Responsible for:
      • FDI policy formulation
      • Promotion of industrial development
      • Facilitating investment inflows

    Significance

    • Boosts economic growth and employment
    • Brings technology and expertise
    • Strengthens infrastructure and manufacturing
    • Improves balance of payments position
    [2020] With reference to Foreign Direct Investment in India, which one of the following is considered its major characteristic? 
    (a) It is the investment through capital instruments essentially in a listed company. 
    (b) It is a largely non-debt creating capital flow. 
    (c) It is the investment which involves debt-servicing. 
    (d) It is the investment made by foreign institutional investors in the Government securities.
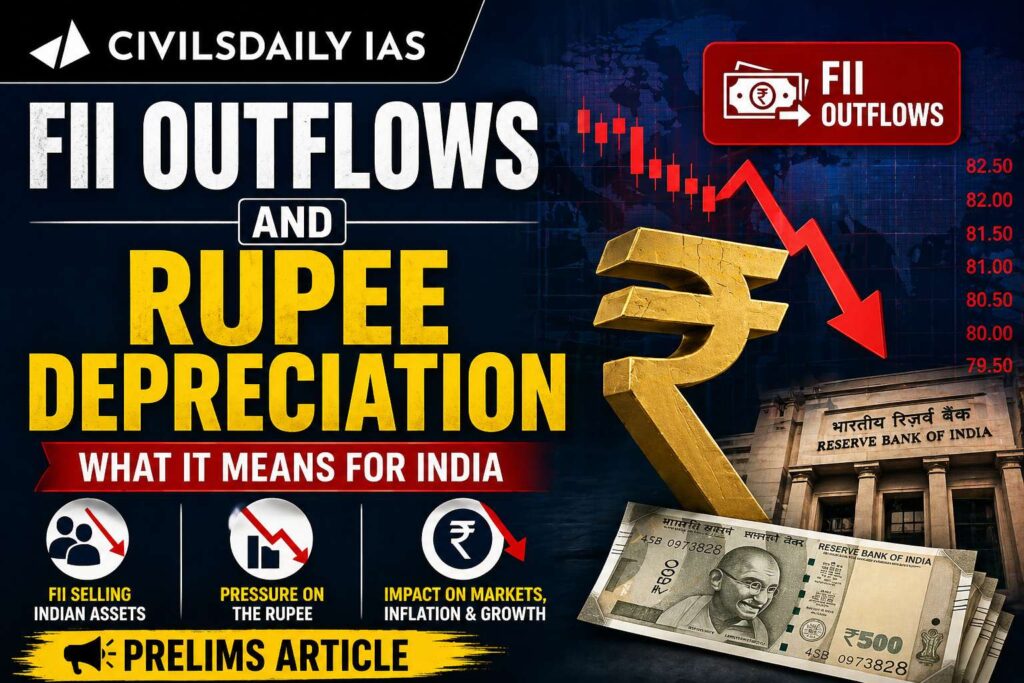
  • FII Outflows and Rupee Depreciation 

    Why in the News

    Foreign investors have withdrawn ₹60,847 crore from Indian equity markets in April 2026, leading to a sharp depreciation of the Indian rupee, which touched nearly ₹95 per dollar.

    Foreign Institutional Investor (FII)

    While the terms FPI and FII are often used interchangeably, there is a technical distinction based on the 2014 SEBI regulations which merged several categories into the FPI regime.

    • Definition: FIIs are large entities (like Pension Funds, Mutual Funds, Investment Trusts) registered in a country outside India that propose to invest in Indian financial markets.
    • Consolidation: Previously, there were FIIs and QFIs (Qualified Foreign Investors). To simplify the process, SEBI introduced the Foreign Portfolio Investor (FPI) Regulations, 2014, effectively making FIIs a part of the broader FPI category.
    • Key Distinction: FPI is the investment, whereas FII is the institutional entity that performs the investment.
    FeatureFDIFPIFII
    Primary GoalManagement control & long-term growthCapital gains & dividendsInstitutional portfolio diversification
    Investment AssetPhysical assets (factories, land)Financial assets (stocks, bonds)Financial assets (stocks, bonds)
    DurationLong-termShort to Medium-termShort to Medium-term
    ComplexityHigh (involves legal & operational setup)Low (easy to trade via exchanges)Low (but requires regulatory registration)
    VolatilityVery LowHighHigh
    Who Invests?Multinational corporationsIndividuals or InstitutionsLarge organizations (e.g., Pension Funds)
    [2022] Consider the following statements: 
    1 Tight monetary policy of US Federal Reserve could lead to capital flight. 
    2 Capital flight may increase the interest cost of firms with existing External Commercial Borrowings (ECBs). 
    3 Devaluation of domestic currency decreases the currency risk associated with ECBs. 
    Select the correct answer using the code given below: 
    (a) 1 and 2 only (b) 2 and 3 only (c) 1 and 3 only (d) 1, 2 and 3

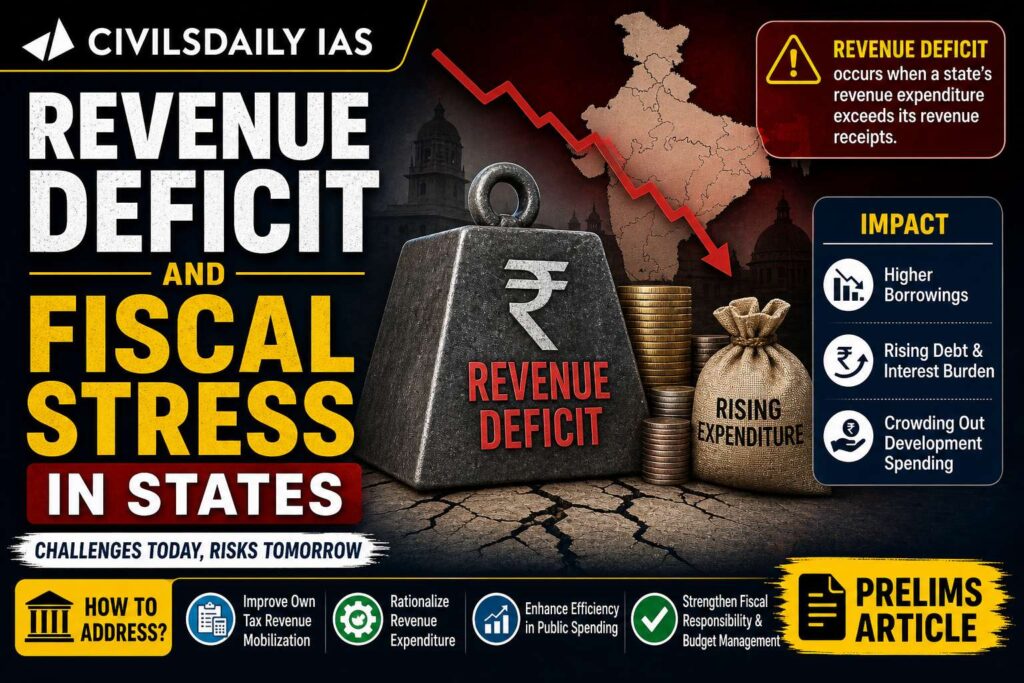
  • Revenue Deficit and Fiscal Stress in States 

    Why in the News

    The Ministry of Finance in its Monthly Economic Review (April 2026) has warned that several Indian States with revenue deficits and high debt burdens may face fiscal stress, especially during economic shocks.

    What is Revenue Deficit

    • Occurs when revenue expenditure exceeds revenue receipts
    • Revenue expenditure includes:
      • Salaries
      • Pensions
      • Subsidies
      • Interest payments
    • Revenue receipts include:
      • Taxes
      • Fees
      • Non tax revenues

    Key Findings

    • Out of 18 major States analysed:
      • 9 States projected to have revenue deficit
      • 7 States projected to have revenue surplus
      • 1 State in revenue balance

    States with Revenue Deficit (Important)

    • Himachal Pradesh, Punjab, Kerala, Andhra Pradesh, Rajasthan, Haryana, Karnataka, Maharashtra, and Chhattisgarh.
    • Punjab has highest interest burden (22.8 percent of revenue receipts)

    States with Revenue Surplus

    • Odisha, Jharkhand, Uttar Pradesh, Goa, Gujarat, Uttarakhand, Telangana, and Bihar

    Key Concept

    • Golden Rule of Fiscal Policy
      • Governments should borrow only for capital expenditure
      • Revenue deficit should ideally be zero

    Fiscal Concerns

    • High interest payments reduce fiscal flexibility
    • Revenue deficit States may:
      • Cut productive expenditure (capital spending)
      • Seek higher central transfers
    • Limited ability to respond to economic shocks
    [2025] Suppose the revenue expenditure is ₹ 80,000 crores and the revenue receipts of the Government are ₹ 60,000 crores. The Government budget also shows borrowings of ₹ 10,000 crores and interest payments of ₹ 6,000 crores. Which of the following statements are correct? 
    I. Revenue deficit is ₹ 20,000 crores. 
    II. Fiscal deficit is ₹ 10,000 crores. 
    III. Primary deficit is ₹ 4,000 crores. 
    Select the correct answer using the code given below. 
    [A] I and II only [B] II and III only [C] I and III only [D] I, II and III
  • Increasing coverage, growing distress

    Why in the News?

    Recent NSS 80th Round (2025) data reveals a striking contradiction: health insurance coverage has increased significantly since 2017-18, yet hospitalisation rates have not improved and out-of-pocket expenditure has sharply increased, especially in private hospitals. This is significant because, for the first time, empirical evidence shows that government-funded insurance schemes are not delivering financial protection, and may even be benefiting relatively better-off groups.

    Why has increased insurance coverage not improved healthcare utilisation?

    1. Stagnant hospitalisation rates: NSS data shows hospitalisation rates remain below 2014 levels in rural areas and only marginally higher in urban areas.
    2. Shift to private care: Public hospital usage declined, while private sector reliance increased.
    3. Access barriers: Unavailability of medicines, diagnostics, and high transport costs reduce public healthcare utilisation.
    4. Inefficiency in coverage translation: Coverage expansion does not ensure actual service delivery or utilisation.

    Why is out-of-pocket expenditure increasing despite insurance schemes?

    1. Rising private sector costs: OOP expenditure increased >70% (rural) and ~80% (urban).
    2. Partial coverage: Insurance schemes often exclude diagnostics, medicines, and indirect costs.
    3. Additional charges: Despite coverage, patients are frequently charged extra in private hospitals.
    4. Low reimbursement rates: Below-market rates under PMJAY incentivise informal billing practices.

    Why are insurance schemes disproportionately benefiting the better-off?

    1. Urban bias: Only 13% of urban beneficiaries belong to the poorest class.
    2. Awareness gap: Poor households have lower awareness and utilisation capacity.
    3. Private sector access: Better-off groups are more capable of accessing empanelled private hospitals.
    4. Structural inequality: Insurance design fails to address social determinants of access.

    What fiscal and systemic challenges are emerging from insurance-led healthcare?

    1. State fiscal stress: Increased hospitalisation under schemes leads to budgetary pressure on states.
    2. Delayed reimbursements: States like Haryana report delays in payments to private providers.
    3. Dependence on private sector: Weak public infrastructure leads to over-reliance on private providers.
    4. Market distortion: Insurance subsidies indirectly support private healthcare expansion.

    Is insurance-based Universal Health Coverage (UHC) viable for India?

    1. Profit-driven incentives: Private providers focus on high-margin treatments, undermining equity.
    2. Limited preventive care: Insurance model emphasises hospitalisation, not primary care.
    3. Weak regulation: Insufficient oversight leads to overcharging and unnecessary procedures.
    4. Public system neglect: Investment in primary healthcare remains inadequate.

    What alternative model is suggested for effective healthcare delivery?

    1. Strengthening public healthcare: Emphasis on universal, tax-funded public health systems.
    2. Primary care focus: Initiatives like Ayushman Arogya Mandir (AAM) offer comprehensive primary care, including NCDs.
    3. Integrated approach: Combining preventive, promotive, and curative care
    4. Regulation of the private sector: Ensures accountability and cost control.

    Conclusion

    India’s health insurance expansion highlights a structural paradox: coverage without care and protection without affordability. A shift from insurance-led to system-strengthening approaches, especially in primary healthcare, is essential for achieving equitable and sustainable Universal Health Coverage.

    PYQ Relevance

    [UPSC 2022] Is inclusive growth possible under market economy? State the significance of financial inclusion in achieving economic growth in India.

    Linkage: The PYQ highlights the gap between coverage expansion (financial inclusion) and actual welfare outcomes, similar to health insurance failing to ensure real protection. This is directly relevant to analysing whether insurance-led healthcare promotes inclusive growth or deepens inequality.

  • [27th April 2026] The Hindu OpED: Summer as a source of income shock for gig workers

    PYQ Relevance[UPSC 2024] What is disaster resilience? How is it determined? Describe various elements of a resilience framework.Linkage: The PYQ is directly relevant as heatwaves represent a climate-induced disaster, where resilience must include income security and labour protection, not just survival. The article highlights gaps in India’s resilience framework by showing how gig workers remain excluded from economic and institutional preparedness systems.

    Mentor’s Comment

    India is experiencing more frequent and prolonged heatwaves, with recorded heat-related mortality in 2022. Simultaneously, the gig economy is expanding rapidly, 7.7 million workers (2020-21) projected to reach 23 million by 2029-30 (NITI Aayog). This creates a convergence where climate risk intersects with informal labour vulnerability; exposing gig workers to both health risks and income shocks.

    Why are heatwaves emerging as an income shock for gig workers?

    1. Income dependency: Earnings depend on trips/orders completed; reduced mobility lowers income.
    2. Heat-induced productivity loss: High temperatures slow movement and increase fatigue.
    3. Absence of paid leave: Gig workers lack paid leave; logging off results in immediate income loss.
    4. Health risks: Dehydration, heat exhaustion, long-term stress increase during peak hours.
    5. Structural vulnerability: Gig workers cannot “work from home,” unlike salaried employees.

    How has climate risk for labour been historically mischaracterized?

    1. Medical framing: Heat treated primarily as a public health emergency, not an economic issue.
    2. Policy limitation: Heat Action Plans focus on mortality reduction, not income protection.
    3. Behavioural advisories: Recommendations (stay indoors, reduce activity) unrealistic for gig workers.
    4. Neglect of informal sector: Assumption that individuals can adjust behaviour independently.

    Why does current preparedness remain inadequate for gig workers?

    1. Infrastructure mismatch: Cooling centres, water kiosks not designed for mobile workers.
    2. Fragmented governance:
      1. Health departments focus on illness
      2. Disaster agencies focus on emergency response
      3. Labour departments lack clarity on gig worker status
    3. Platform exclusion: Digital platforms not integrated into climate preparedness frameworks.
    4. Gender dimension: Women gig workers face additional unpaid care burdens and safety risks.

    How does extreme heat exacerbate economic inequality and labour precarity?

    1. Income volatility: Heat reduces working hours and this leads to a direct fall in earnings.
    2. Lack of social protection: Absence of insurance, wage guarantees, or compensation.
    3. Urban dependence: Cities rely on gig workers for essential services (food, medicines).
    4. Risk transfer: Platforms shift operational risks to workers without safety nets.

    What policy gaps hinder effective climate-labour integration?

    1. Regulatory ambiguity: Gig workers classified outside traditional labour protections.
    2. Limited labour codes applicability: Social security provisions remain weakly implemented.
    3. Platform accountability gap: No binding obligations for heat-responsive work design.
    4. Weak inter-agency coordination: Lack of integrated climate-labour governance framework.

    What measures can enhance resilience for gig workers?

    1. Labour recognition: Heat treated as labour and productivity issue.
    2. Workplace safeguards: Rest breaks, shaded areas, hydration facilities mandated.
    3. Income protection mechanisms: Insurance, wage compensation, integration with welfare schemes.
    4. Platform responsibility:
      1. Flexible performance metrics
      2. Reduced delivery pressure during peak heat
    5. Institutional coordination: Collaboration among labour, urban, disaster management, and platform regulators.

    Why is rethinking resilience critical in the gig economy context?

    1. Urban system dependence: Essential goods delivery depends on the gig workforce.
    2. Climate risk absorption: Gig workers act as buffers for systemic shocks.
    3. Resilience definition: Must include safe working conditions + stable income, not just survival.

    Conclusion

    Climate adaptation in India remains incomplete without integrating labour and income dimensions. Gig workers represent a critical but vulnerable workforce. Policy must shift from reactive health responses to proactive economic safeguards, ensuring both livelihood security and climate resilience.

  • Rupee depreciation and its impact on investments

    Why in the News?

    The issue of rupee depreciation has gained renewed attention due to a sharp and sustained fall in the Indian Rupee (INR) against the US Dollar, with the currency weakening from ₹85.53 (March 31, 2025) to ₹92.76 (March 30, 2026). This is a notable 8.45% depreciation, and even 10.73% from intermediate peaks. This is significant because it reflects macroeconomic stress combined with global volatility, particularly rising crude oil prices and foreign investor outflows.

    How does rupee depreciation impact equity investments?

    1. Limited Direct Impact: Exchange rate fluctuations do not directly affect domestic equity investments if earnings are INR-based.
    2. Sentiment Effect: Currency weakness negatively affects investor confidence due to macroeconomic uncertainty.
    3. Multiple Drivers: Market corrections arise from FPI outflows, crude oil prices, and global cues, not just currency depreciation.

    Why is rupee depreciation more harmful to debt investments?

    1. Imported Inflation: Weak currency raises the cost of imports like crude oil, increasing inflation.
    2. Interest Rate Sensitivity: Higher inflation leads to higher interest rates, reducing bond prices.
    3. Example: Rising crude prices denominated in USD increase landed cost-inflation rises-bond yields rise and finally bond prices fall.

    What is the role of RBI projections in assessing currency impact?

    1. Inflation Projection: RBI projects 4.6% inflation for 2026-27, indicating moderate inflation expectations.
    2. Policy Assumptions: Includes crude oil at $85/barrel and exchange rate at ₹94/USD.
    3. Market Stability Signal: Suggests depreciation is partly already factored into macroeconomic planning.

    Can gold act as an effective hedge against rupee depreciation?

    1. Currency Hedge: Gold prices rise in INR when rupee weakens, as it is priced in USD.
    2. Historical Trend: A significant portion of gold price rise in India is due to currency depreciation.
    3. Portfolio Allocation: Recommended allocation is 10-15%, as gold is not a primary growth asset.

    How can investors benefit from global diversification during depreciation?

    1. Currency Advantage: Investments in foreign assets gain when INR depreciates.
    2. Conversion Benefit: Investment in USD assets appreciates in INR terms during redemption.
    3. Investment Routes:
      1. Mutual Funds: International funds available in India
      2. Direct Investment: Through Liberalized Remittance Scheme (LRS)

    How does rupee depreciation affect household expenses?

    1. Inflation Impact: Reduced purchasing power due to rising prices.
    2. Imported Goods: Costlier fuel, electronics, and foreign services.
    3. Limited Control: Domestic inflation due to global factors remains beyond individual control.

    Conclusion

    Rupee depreciation is not inherently negative but becomes problematic when it fuels inflation and destabilizes investment returns. While equity markets absorb the shock through multiple factors, debt markets and consumption are more vulnerable. Strategic diversification, moderate gold allocation, and global exposure can mitigate risks.

    PYQ Relevance

    [UPSC 2024] What are the causes of persistent high food inflation in India? Comment on the effectiveness of the monetary policy of the RBI to control this type of inflation.

    Linkage: Rupee depreciation increases imported inflation, which contributes to persistent food inflation in India. The article explains exchange rate pass-through and highlights the RBI’s inflation projection of 4.6%, indicating the role of monetary policy in managing inflationary pressures.

  • The Goldilocks period that wasn’t for the economy

    Why in the News?

    India’s so-called “Goldilocks period” of high growth, low inflation, and macro stability has come under sharp scrutiny after GDP back-series revisions (2022-23 base year) revealed that earlier estimates overstated economic performance. Coupled with global shocks (US-Iran tensions, rupee depreciation, energy vulnerabilities) and declining long-term growth rates, the narrative shifts from optimism to concern. The striking reality is that real GDP growth has slowed structurally (approx. 6.2% over 12 years to <5.5% in recent years), challenging India’s aspiration to become a developed economy.

    Was India truly in a “Goldilocks” phase of economic growth?

    The “Goldilocks” narrative, describing an economy that is “not too hot, not too cold, but just right”, has been a central theme in recent Indian macroeconomic assessments, but it remains a subject of intense debate between official reporting and critical economic analysis. 

    The “Goldilocks” Case (Official Perspective)

    1. Goldilocks assumption: Suggested optimal macroeconomic conditions (high growth, low inflation, low unemployment).
    2. High Real Growth: Real GDP growth for FY2024 was recorded at 7.6%, with projections for FY2026 reaching as high as 7.4% in advanced estimates.
    3. Subdued Inflation: Headline Consumer Price Index (CPI) inflation fell from 4.8% in May 2024 to a projected 2% by early 2026, creating a low-inflation environment rarely seen alongside high growth.
    4. Macro-Stability: Stable corporate earnings, peaking interest rates, and resilient foreign exchange reserves (over $618 billion in early 2024) have bolstered the image of a well-balanced economy. 

    Evidence of an “Illusion” (Counter-Arguments)

    1. The “Base Effect” Trap: The high growth seen in 2021-22 and 2022-23 was largely a statistical rebound from the massive -5.8% to -7.7% contraction during the 2020 pandemic. This created a “temporary high” rather than a sustainable structural shift
    2. GDP Revision “Shrinkage“: Revisions to the GDP base year (from 2011-12 to 2022-23) revealed that the Indian economy was smaller in absolute terms than previously believed, and back-series data showed that growth between 2004-2014 was consistently over-estimated
    3. Stagnant Real Wages: While nominal GDP grew, real wages for agricultural and non-farm rural workers reportedly dropped by over 1.3% annually between 2019 and 2025, suggesting the “Goldilocks” benefits were not reaching the masses.
    4. Food Inflation Disparity: Headline inflation numbers are often pulled down by “core” metrics, but food inflation (the primary expense for low-income households) has remained volatile, reaching over 10% in late 2024. 

    How has GDP revision altered India’s economic narrative?

    1. GDP recalibration: New base year (2022-23) revised past estimates downward, indicating overestimation earlier.
    2. Economic size impact: India’s GDP appears smaller than previously calculated.
    3. Policy implication: Growth trajectory reassessment becomes necessary for fiscal and developmental planning.

    Is India’s growth structurally decelerating over time?

    1. Nominal GDP slowdown:
      1. >10% CAGR (2014-2026)
      2. ~9.5% CAGR (last 7 years)
    2. Real GDP trend:
      1. ~6.2% CAGR (12 years)
      2. <5.5% CAGR (last 7 years)
    3. Historical comparison: ~7% CAGR (22 years), indicates clear deceleration trend.
    4. Conclusion: Growth momentum is weakening structurally, not cyclically.

    What domestic economic weaknesses persist?

    1. Corporate earnings stagnation: Reflects weak private sector dynamism.
    2. Investment gap: Low foreign capital inflows indicate investor hesitation.
    3. Currency pressure: Rupee depreciation vs USD signals external vulnerability.
    4. Energy dependence: Heavy reliance on Strait of Hormuz imports exposes India to geopolitical shocks.

    How do global shocks amplify India’s economic vulnerability?

    1. Geopolitical tensions: US-Iran conflict raises energy price risks.
    2. Currency fluctuations: Rupee weakening affects import costs and inflation.
    3. Comparative decline: Japan and UK overtaking India in GDP terms highlights relative slowdown.
    4. Inflation risk: External shocks may trigger imported inflation.

    Why is short-term high growth misleading for policymaking?

    1. Low base effect: Post-pandemic growth inflates recent growth rates artificially.
    2. Cherry-picking risk: Ignoring long-term trends leads to misguided optimism.
    3. Policy distortion: May result in delayed structural reforms.

    What reforms are necessary to correct the growth trajectory?

    1. Structural reforms: Focus on productivity, manufacturing, and exports.
    2. Domestic demand boost: Enhance consumption and employment generation.
    3. Investment climate: Improve ease of doing business and investor confidence
    4. Energy diversification: Reduce external dependence on oil imports.

    Conclusion

    India’s economic reality reflects structural deceleration masked by short-term recovery trends. The revised GDP data dismantles the “Goldilocks” narrative and underscores the urgency of deep structural reforms, investment revival, and macroeconomic resilience to sustain long-term growth.

    PYQ Relevance

    [UPSC 2021] Do you agree that the Indian economy has recently experienced V-shaped recovery? Give reasons in support of your answer.

    Linkage: The PYQ questions the “Goldilocks/V-shaped growth narrative” by highlighting low base effect and overstated growth trends. It directly links to the article’s argument of structural slowdown vs short-term recovery illusion due to GDP revisions.