NITI Aayog released the 8th edition of “Trade Watch Quarterly” (Jan-Mar 2026), highlighting India’s trade performance and focusing on the pharmaceutical sector.
India’s Trade Performance
Total merchandise and services trade:$1.84 trillion in FY 2025-26 (↑5.4% YoY).
Exports: Grew by 4.2%.
Imports: Grew by 6.5%.
Services exports: Increased by 9.0%, maintaining a strong services surplus.
India remained the 8th largest services exporter in 2025.
Services exports recorded a CAGR of 10.3% (2015-2025), higher than the global average.
Pharmaceutical Sector
Global pharmaceutical and API market estimated at $1.3 trillion (2025).
India’s pharmaceutical and API exports reached $35.8 billion.
India is a leading supplier of Generic medicines, Vaccines, and Essential therapeutics
Challenges
Export basket remains concentrated in generic formulations and retail medicaments.
Limited presence in biologics, biosimilars, immunologicals, and advanced therapeutics.
Continued dependence on imported Active Pharmaceutical Ingredients (APIs) and intermediates, especially from China.
Leading Pharmaceutical States
Telangana, Gujarat, and Maharashtra
These states lead in production, exports, and integration into global pharmaceutical value chains.
Way Forward
Expand into high-value pharmaceutical segments.
Strengthen domestic API manufacturing.
Increase investments in R&D, technology, and skill development.
Improve regulatory efficiency and market access.
Active Pharmaceutical Ingredient (API)
The biologically active component of a medicine responsible for its therapeutic effect.
APIs are combined with excipients to produce the final dosage form.
Biologics
Medicines produced from living organisms or biological processes.
Examples include monoclonal antibodies, vaccines, and recombinant proteins.
[2021] With reference to international trade of India, which of the following statements are correct: 1.The Top 3 export destinations of India are – USA, UAE, China. 2.The Top 3 exports from India include – Petroleum Products, Drug Formulations, Agricultural Products. 3.Agricultural exports have consistently risen from 2016-17 to 2021-22. 4.India’s merchandise exports are less than its merchandise imports. Select the correct code from the options given below:
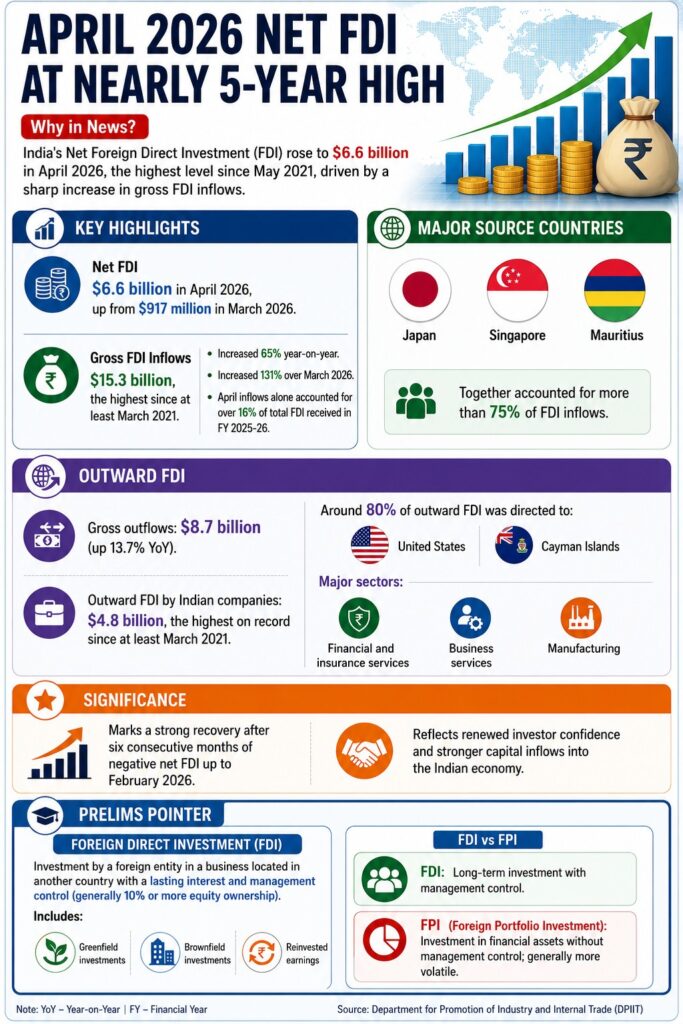
India’s Net Foreign Direct Investment (FDI) rose to $6.6 billion in April 2026, the highest level since May 2021, driven by a sharp increase in gross FDI inflows.
Key Highlights
Net FDI:$6.6 billion in April 2026, up from $917 million in March 2026.
Gross FDI Inflows:$15.3 billion, the highest since at least March 2021.
Increased 65% year-on-year.
Increased 131% over March 2026.
April inflows alone accounted for over 16% of total FDI received in FY 2025-26.
Major Source Countries
Japan, Singapore, and Mauritius
Together accounted for more than 75% of FDI inflows.
Outward FDI
Gross outflows:$8.7 billion (up 13.7% YoY).
Outward FDI by Indian companies:$4.8 billion, the highest on record since at least March 2021.
Around 80% of outward FDI was directed to United States and Cayman Islands
Major sectors Financial and insurance services, Business services, and Manufacturing
Significance
Marks a strong recovery after six consecutive months of negative net FDI up to February 2026.
Reflects renewed investor confidence and stronger capital inflows into the Indian economy.
Foreign Direct Investment (FDI)
Investment by a foreign entity in a business located in another country with a lasting interest and management control (generally 10% or more equity ownership).
Includes Greenfield investments, Brownfield investments, and Reinvested earnings
FDI vs FPI
FDI: Long-term investment with management control.
FPI (Foreign Portfolio Investment): Investment in financial assets without management control; generally more volatile.
[2021] Consider the following: 1. Foreign currency convertible bonds 2. Foreign institutional investment with certain conditions 3. Global depository receipts 4. Non-resident external deposits Which of the above can be included in Foreign Direct Investments?
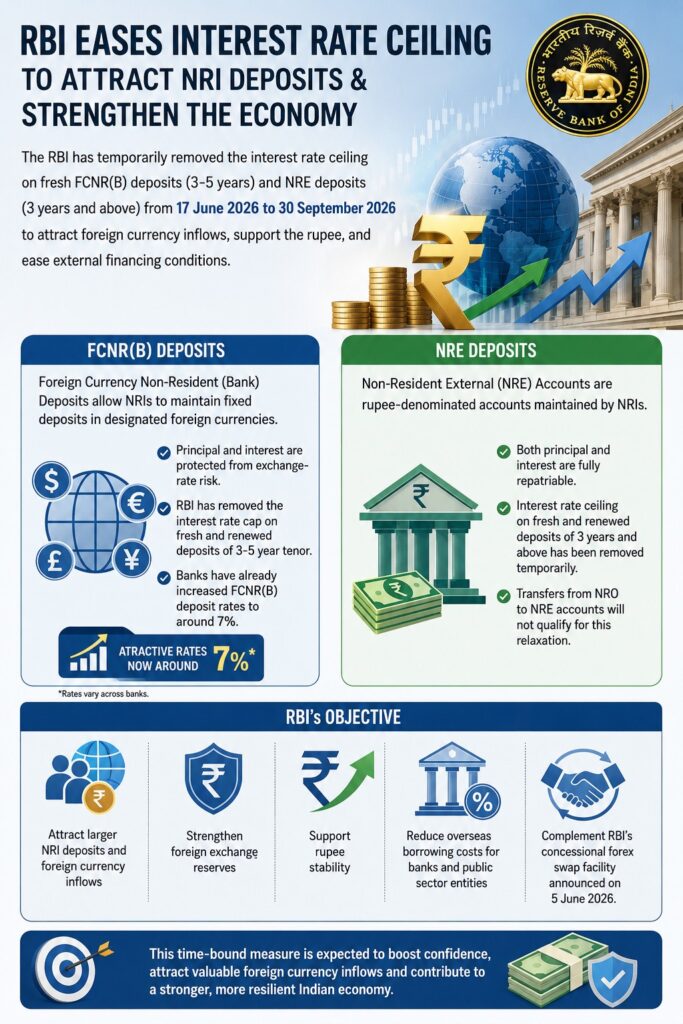
The RBI has temporarily removed the interest rate ceiling on fresh FCNR(B) deposits (3-5 years) and NRE deposits (3 years and above) from 17 June 2026 to 30 September 2026 to attract foreign currency inflows, support the rupee, and ease external financing conditions.
FCNR(B) Deposits
Foreign Currency Non-Resident (Bank) Deposits allow NRIs to maintain fixed deposits in designated foreign currencies.
Principal and interest are protected from exchange-rate risk.
RBI has removed the interest rate cap on fresh and renewed deposits of 3-5 year tenor.
Banks have already increased FCNR(B) deposit rates to around 7%.
NRE Deposits
Non-Resident External (NRE) Accounts are rupee-denominated accounts maintained by NRIs.
Both principal and interest are fully repatriable.
Interest rate ceiling on fresh and renewed deposits of 3 years and above has been removed temporarily.
Transfers from NRO to NRE accounts will not qualify for this relaxation.
RBI’s Objective
Attract larger NRI deposits and foreign currency inflows.
Strengthen foreign exchange reserves.
Support rupee stability.
Reduce overseas borrowing costs for banks and public sector entities.
Complement RBI’s concessional forex swap facility announced on 5 June 2026.
Expected Impact
Analysts estimate $30-50 billion of inflows by Q3 FY27.
Similar FCNR(B) scheme in 2013 attracted nearly $25 billion.
Increased foreign currency liquidity may ease external sector pressures.
[2021] Consider the following: 1. Foreign currency convertible bonds 2. Foreign institutional investment with certain conditions 3. Global depository receipts 4. Non-resident external deposits Which of the above can be included in Foreign Direct Investments?
India’s higher education system continues to expand rapidly, producing millions of graduates each year. Yet graduate unemployment remains high, exposing a growing disconnect between educational output and labour market absorption, especially in the age of AI, automation, and capital-intensive growth.
Why is graduate unemployment rising despite expanding economic opportunities?
Rapid Expansion of Higher Education: Engineering colleges and universities have increased graduate output faster than job creation.
Sectoral Transition: IT services no longer absorb engineering graduates at earlier levels. New opportunities are emerging in banking, finance, defence, aerospace, semiconductors and space sectors.
Mismatch in Skills: Employers seek practical and industry-ready skills that many graduates lack.
Changing Nature of Jobs: New opportunities increasingly require specialised and interdisciplinary competencies.
Weak Industry Exposure: Many students graduate without sufficient laboratory, manufacturing, or real-world experience.
Industry-led Training: Companies increasingly run internal training programmes because many graduates lack industry-ready skills.
Additional Training Burden: Firms often need to retrain recruits before deployment.
Has AI and technological change widened the employability gap?
Changing Skill Requirements: AI increases demand for problem-solving, analytical, and digital skills.
Curriculum Lag: Universities cannot redesign programmes at the pace of technological change.
Mid-Course Labour Market Shift: Many graduates entered college before AI became mainstream. The labour market changed faster than university curricula.
New Competency Requirements: Employers seek AI literacy, data interpretation, and systems thinking.
Transition Shock: Graduates trained under older curricula enter a rapidly evolving labour market.
Why is economic growth not translating into proportionate job creation?
Capital-Intensive Investments: Semiconductors and advanced manufacturing generate high output with fewer workers.
Automation of Production: Robotics and digital manufacturing reduce labour requirements.
Automation of Manufacturing: Manufacturing previously absorbed engineers in supervisory and operational roles. Robotics and digital production systems have reduced demand for such middle-level positions.
Limited Labour Absorption: Manufacturing expansion no longer guarantees mass employment.
Output-Employment Decoupling: Factory output can rise significantly without a proportional increase in workforce requirements.
Is India facing a graduate surplus or a skills mismatch?
Not a Numerical Surplus Alone: Several sectors continue to demand skilled professionals.
Quality Gap: Available graduates often do not possess industry-required competencies.
Design and R&D Shortage: Advanced sectors need specialised talent that remains limited.
Employability Deficit: The issue lies more in readiness than in educational attainment.
Is India’s employment challenge a problem of graduate surplus or skill deficit?
Graduate Expansion: Higher education enrolment has expanded rapidly, producing graduates faster than formal job creation.
Skill Mismatch: Many graduates lack industry-ready, practical and interdisciplinary skills despite holding degrees.
Dual Reality: Graduate unemployment coexists with shortages of specialised talent in sectors such as AI, semiconductors, finance and advanced manufacturing.
Changing Demand Structure: The economy increasingly rewards digital literacy, problem-solving and applied technical competencies over generic credentials.
Underemployment Trap: Many graduates accept jobs below their qualifications or enter informal and gig work due to limited suitable opportunities.
Core Challenge: India’s employment problem is a structural mismatch between educational output and labour market demand rather than a pure shortage of jobs or graduates.
Why does manufacturing versus innovation present a false choice?
Manufacturing Needs Innovation: Modern industry depends on design, research, and technology.
Innovation Creates High-Value Jobs: R&D and product development generate skilled employment.
Global Value Chains Reward Innovation: Countries capturing design and intellectual property gain more value.
Balanced Strategy Required: Manufacturing and innovation must advance together.
Has India developed indigenous technological capabilities?
Growing Corporate Capability: Firms such as Mahindra and Tata Motors have strengthened engineering capacity.
Corporate Capability Building: Indian firms have moved beyond assembly and increasingly participate in engineering, design and product development.
Increasing Design Competence: Indian engineers contribute to complex product development.
Progress in Indigenous Systems: Domestic technological capabilities have expanded across sectors.
Capability Gap Persists: Advanced R&D opportunities remain fewer than the number of graduates produced.
Can entrepreneurship absorb the growing graduate workforce?
Job Creation Beyond Wage Employment: Startups can become major employment generators.
Need for Risk Capital: Venture funding remains critical for innovation-led firms.
Ecosystem Constraints: Financing and scaling challenges continue to limit startup growth.
What must change in higher education?
Industry-Academia Integration: Universities and firms must collaborate closely.
Co-created Curricula: Universities should develop programmes jointly with industry instead of designing courses in isolation.
Practical Learning: Greater emphasis on laboratories, internships, and projects.
Skill Development: Education must prioritise employability alongside academic credentials.
Continuous Upgradation: Institutions must adapt faster to technological change.
Conclusion
India’s problem is not an excess of graduates but a growing mismatch between educational outcomes and labour market requirements. AI, automation, and capital-intensive growth have altered the nature of employment faster than universities have adapted. The solution lies in aligning education, industry, innovation, and entrepreneurship so that graduate creation and job creation move in the same direction.
PYQ Relevance
[UPSC 2023] Skill development programs have succeeded in increasing human resource supply to various sectors. In the context of the statement, analyze the linkages between education, skill and employment.
Linkage: The PYQ examines the link between education, skills and employability in India’s labour market. The article highlights how weak alignment between education, skills and industry demand has contributed to rising graduate unemployment despite expanding higher education.
The RBI approved a record surplus transfer of ₹2.87 lakh crore to the Union government for FY26. The transfer follows a sharp expansion in the RBI’s balance sheet and rising earnings from reserve management, foreign assets and market operations, triggering debate over the RBI’s evolving place within India’s fiscal architecture.
Why is the RBI no longer functioning only as a monetary authority?
Traditional Role: The RBI’s primary mandate is monetary stability, financial stability and currency management.
Record Fiscal Contribution: The RBI transferred a record ₹2.87 lakh crore to the Union government in FY26, demonstrating its growing importance as a source of fiscal resources.
Expanding Financial Footprint: The RBI’s balance sheet expanded by 20.6% to ₹91.97 lakh crore by March 2026, increasing the scale at which its operations influence fiscal outcomes.
Rising Operational Income: Gross income rose by 26%, reflecting the growing revenue-generating capacity of RBI operations.
Magnitude of Fiscal Impact: The transfer exceeds the annual budgets of several Indian States, indicating the substantial fiscal significance of RBI earnings.
Institutional Shift: Reserve management, foreign asset holdings and market operations now generate fiscal resources alongside monetary outcomes, giving the RBI a role that extends beyond traditional central banking.
How has the RBI’s management of reserves become a source of fiscal capacity?
Reserve Management: RBI actively manages foreign exchange reserves, gold holdings and securities portfolios as part of its monetary mandate.
Gold Reserve Expansion: RBI acquired almost $12 billion worth of gold, increasing the scale of reserve assets under its management.
Fiscal Contribution: Returns from reserve management increasingly contribute to the RBI surplus transferred to the Union government.
Institutional Consequence: Activities undertaken for monetary and financial stability now generate substantial fiscal resources, linking reserve management to government finances.
Can a central bank remain institutionally independent when it becomes fiscally important?
Institutional Distance: Central bank credibility depends on insulation from day-to-day fiscal compulsions.
Fiscal Dependence: Large surplus transfers strengthen government finances without taxation or borrowing.
Monetary-Fiscal Interdependence: Decisions affecting the RBI’s balance sheet increasingly affect fiscal outcomes. The growing fiscal role of central banks blurs the traditional boundary between monetary policy and fiscal policy.
Changing Incentives: Fiscal significance increases political interest in central-bank earnings.
Global Experience: Quantitative easing demonstrated how central-bank balance sheets can become instruments of fiscal support.
Core Tension: The RBI remains a monetary authority while simultaneously becoming an important fiscal actor.
Why does the RBI’s growing fiscal role create a federalism challenge?
Union Ownership: RBI profits accrue entirely to the Union government.
Outside Fiscal Devolution: RBI transfers are not included in the divisible pool shared through Finance Commission awards.
No Automatic State Share: States receive no direct claim on RBI-generated revenues.
Scale of Asymmetry: The ₹2.87 lakh crore transfer exceeds the annual budgets of several States, highlighting the magnitude of resources accruing exclusively to the Centre.
State Fiscal Constraints: States retain major expenditure responsibilities and face borrowing restrictions under Article 293, limiting their ability to offset revenue asymmetries.
Fiscal Centralisation: Large public resources generated through monetary institutions strengthen the Centre’s fiscal position.
Federal Blind Spot: RBI dividend transfers illustrate a wider pattern in which cesses, surcharges and borrowing restrictions increasingly concentrate fiscal resources at the Union level.
Conclusion
The RBI’s record surplus transfer reflects a deeper institutional transformation rather than a one-time financial event. The central bank has evolved from being primarily a guardian of monetary stability into an increasingly important source of fiscal capacity for the Union government. The unresolved challenge is preserving central bank independence and strengthening fiscal federalism as monetary institutions become more deeply intertwined with public finance.
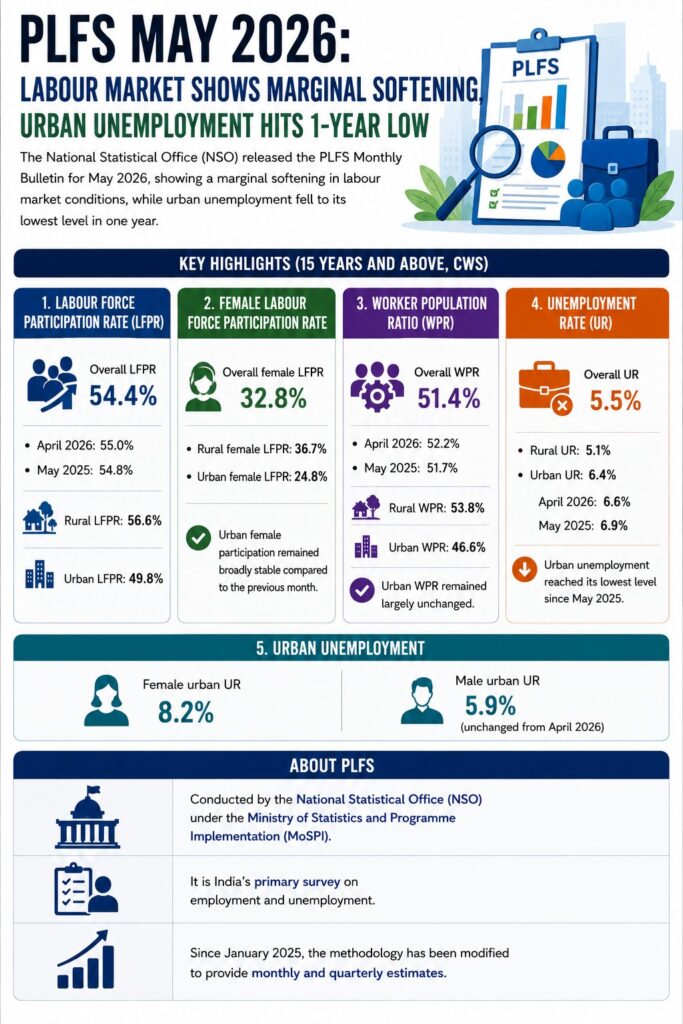
The National Statistical Office (NSO) released the PLFS Monthly Bulletin for May 2026, showing a marginal softening in labour market conditions, while urban unemployment fell to its lowest level in one year.
Key Highlights (15 years and above, Current Weekly Status)
Labour Force Participation Rate (LFPR)
Overall LFPR: 54.4%
April 2026: 55.0%
May 2025: 54.8%
Rural LFPR: 56.6%
Urban LFPR: 49.8%
Female LFPR
Overall female LFPR: 32.8%
Rural female LFPR: 36.7%
Urban female LFPR: 24.8%
Urban female participation remained broadly stable compared to the previous month.
Worker Population Ratio (WPR)
Overall WPR: 51.4%
April 2026: 52.2%
May 2025: 51.7%
Rural WPR: 53.8%
Urban WPR: 46.6%
Urban WPR remained largely unchanged.
Unemployment Rate (UR)
Overall UR: 5.5%
Rural UR: 5.1%
Urban UR: 6.4%
April 2026: 6.6%
May 2025: 6.9%
Urban unemployment reached its lowest level since May 2025.
Urban Unemployment
Female urban UR: 8.2%
Male urban UR: 5.9% (unchanged from April 2026).
About PLFS
Conducted by the National Statistical Office (NSO) under the Ministry of Statistics and Programme Implementation (MoSPI).
It is India’s primary survey on employment and unemployment.
Since January 2025, the methodology has been modified to provide monthly and quarterly estimates.
[2020] With reference to the Indian economy after the 1991 economic liberalization, consider the following statements:
1.Worker productivity (Rs. per worker at 2004 — 05 prices) increased in urban areas while it decreased in rural areas. 2.The percentage share of rural areas in the workforce steadily increased. 3.In rural areas, the growth in non-farm economy increased. 4.The growth rate in rural employment decreased.
Which of the statements given above is/are Correct? a) 1 and 2 only b) 3 and 4 only c) 3 only d) 1, 2 and 4 only
India’s growth story is increasingly being shaped by logistics efficiency rather than income growth alone. There is a structural shift from a “hard-to-serve” economy to a “reachable” economy, where reliable logistics determines whether demand can actually translate into consumption. Also, India has improved from 44th rank in 2018 to 38th rank in 2023 in the World Bank’s Logistics Performance Index (LPI).
What does the shift from a “Hard-to-Serve” to a “Reachable” Economy signify?
Hard-to-Serve Markets: Consumers possess purchasing power but remain disconnected from efficient supply chains.
Reachability: Logistics networks ensure reliable movement of goods irrespective of geographic distance.
Demand Realisation: Consumption materialises only when products are physically available.
Economic Inclusion: Smaller towns and rural markets become part of mainstream consumption networks.
Structural Shift: Market access increasingly matters as much as income growth.
How is India’s Growth Narrative Shifting from Income to Reachability?
Traditional Growth Drivers: Wages, remittances, rural credit, and consumption expenditure have historically dominated macroeconomic discussions.
Emerging Constraint: Distribution efficiency rather than production capacity increasingly determines consumption expansion.
Distance Economics: Physical distance now affects demand realization more than production availability.
Consumption Geography: Growth increasingly depends on whether products can reliably reach underserved markets.
Reachability Paradigm: Economic opportunity is shifting from income availability to market accessibility.
How Have Logistics Reforms Reduced Internal Market Frictions?
Reduced Friction: Policy reforms have steadily lowered internal trade barriers.
Economic Corridors: Strengthen movement of goods across regions.
Line-Haul Predictability: Improves consistency of long-distance freight movement.
Digital Systems: Enhance shipment tracking and visibility.
Supply-Chain Transparency: Reduces uncertainty in inventory planning and replenishment.
Market Integration: Creates a more unified national market.
What Does India’s Logistics Performance Reveal?
World Bank LPI Improvement: India improved from 44th rank (2018) to 38th rank (2023) among 139 countries.
Competitiveness Gains: Reflects improvements in logistics infrastructure and service quality.
Infrastructure Modernization: Indicates gradual strengthening of transport and supply-chain ecosystems.
Expressway Connectivity: Supports reliable movement between production and consumption centres.
Competitive Inclusion: Small firms can participate in national markets.
Example: A farm-gate producer operating on thin margins can now serve distant markets with greater confidence due to predictable transportation schedules and reduced delivery uncertainty.
Why Does the Last-Mile Gap Remain India’s Biggest Logistics Challenge?
Operational Reality: Infrastructure efficiency on paper does not always translate into service quality.
Urban Congestion: Causes delays despite improved transport corridors.
Land Constraints: Limit logistics facility expansion.
India’s growth increasingly depends on converting purchasing power into actual consumption through efficient logistics. By improving market reachability and reducing supply-chain frictions, logistics is emerging as a key enabler of demand growth, economic integration, and inclusive development.
Value Addition
The National Logistics Policy (NLP)
It is a comprehensive, cross-sectoral framework launched in 2022, to reduce domestic logistics costs and enhance the global competitiveness of Indian goods.
Managed by the Department for Promotion of Industry and Internal Trade (DPIIT), the policy optimizes the “soft infrastructure” (processes, digital integration, and regulatory systems) to complement the hard infrastructure built under the PM GatiShakti National Master Plan.
Core Targets (To be Achieved by 2030)
Reduce Costs: Lower India’s logistics cost from 13-14% of GDP to a single-digit global benchmark (under 10%).
Improve Global Ranking: Propel India into the top 25 nations on the World Bank’s Logistics Performance Index (LPI).
Data-Driven Infrastructure: Build automated Decision Support Systems (DSS) for data-backed logistics planning.
Comprehensive Logistics Action Plan (CLAP)
The NLP executes its objectives through eight critical action areas outlined in the Comprehensive Logistics Action Plan:
Integrated Digital Logistics Systems: Merging multiple ministry platforms into one central gateway.
Physical Asset Standardization: Standardizing containers, trucks, and warehouses to improve service quality.
Human Resource Development: Building unified training modules to skill India’s massive logistics workforce.
State Engagement: Aligning central targets with state-level logistics actions and local city plans.
EXIM Logistics: Addressing structural bottlenecks to ease Export-Import container movement.
Service Improvement Framework: Setting up quick-response cells to clear regulatory and industry roadblocks.
Sectoral Efficiency Plans: Designing specialized movement plans for primary commodities like coal, steel, and grains.
Logistics Park Facilitation: Accelerating the development of Multi-Modal Logistics Parks (MMLPs).
PYQ Relevance
[UPSC 2021] “Investment in infrastructure is essential for more rapid and inclusive economic growth. Discuss in the light of India’s experience.”
Linkage: The question examines the role of infrastructure as a catalyst for economic growth, market integration, and inclusive development. The article demonstrates how logistics infrastructure, through Dedicated Freight Corridors, PM Gati Shakti, Bharatmala, digital logistics platforms, and supply-chain reforms, is reducing market frictions and improving reachability
India’s net FDI has witnessed an extraordinary collapse, falling from almost $44 billion in 2020-21 to less than $1 billion in 2024-25, even as gross FDI inflows recovered to $94.6 billion. This sharp divergence has reignited debate over whether India is becoming a less attractive investment destination.
Why has India’s net FDI declined so sharply despite strong gross inflows?
Net FDI Measurement: Net FDI under the Balance of Payments (BoP) framework is calculated after adjusting gross inflows for FDI-related outflows.
Sharp Decline: Net FDI fell from nearly $44.0 billion in 2020-21 to less than $1 billion in 2024-25.
Strong Gross Inflows: Gross FDI inflows recovered to $94.6 billion in 2025-26.
Misleading Interpretation: Weak net FDI is often interpreted as a sign of declining investor confidence, while strong gross inflows are presented as evidence of economic strength.
Underlying Reality: Both views overlook the changing composition of international capital flows and the mechanisms governing inflows and outflows.
Does the conventional FDI debate overlook important structural changes?
Incomplete Narrative: Public discourse focuses primarily on aggregate FDI numbers rather than the nature of investments.
Shift in Focus: Policy gradually prioritised attracting larger inflows, while concerns regarding future external payment obligations and investment quality received less attention.
Need for Assessment: Evaluating FDI requires examining investor categories, sectoral allocation, and associated outflows rather than focusing solely on inflow volumes.
What types of FDI are entering India and how do they differ in developmental impact?
Traditional or Real FDI
Source: Multinational enterprises investing directly in production and services.
Contribution: Brings technology, brands, managerial capabilities, and production know-how.
Impact: Supports long-term industrial development and employment generation.
Financial Investor FDI
Source: Private equity funds, venture capital funds, sovereign wealth funds, and asset managers.
Objective: Capital appreciation rather than production expansion.
Impact: Provides financial capital but contributes less to technology transfer and industrial capacity creation.
Diaspora and SPV-Based Investments
Mechanism: Capital raised abroad and channelled through offshore financial centres.
Instrument: Special Purpose Vehicles (SPVs).
Characteristic: Frequently associated with round-tripping of domestic funds.
How has the composition of FDI changed in recent years?
Real FDI Share: Accounted for only 41.9% of effective inflows between 2022-23 and 2025-26.
Financial Investor Share: Contributed 40.5% of effective inflows.
Diaspora/SPV Share: Represented 17.6% of total inflows.
Developmental Concern: A rising share of financial investors and SPVs reduces the developmental gains usually associated with traditional FDI.
Technology Transfer: Becomes weaker when investments are motivated primarily by financial returns rather than production activity.
Why do rising investor exits matter for understanding net FDI trends?
Exit Signals: Business model of financial investors involves eventual exits through stake sales and disinvestment.
Large Exit Example: Singapore’s Temasek exited Schneider Electric India in 2025.
Scale of Exit: Exit generated approximately $6.4 billion.
Initial Investment: Around $637 million invested in 2020.
Return Multiple: Approximately 45 times the original investment.
PE and VC Exits: Foreign private equity and venture capital investors accounted for around $29 billion in outflows.
Implication: Such exits substantially increase capital outflows and depress net FDI.
Are gross FDI figures overstating actual fresh capital entering India?
Accounting Inclusion: Gross FDI statistics include intra-group ownership reorganisations.
Mergers and Acquisitions: Included even when no fresh capital enters the country.
Share Swaps: Recorded as FDI transactions despite limited resource transfer.
ECB Conversions: Conversion of external commercial borrowings into equity inflates inflow figures.
Blind Spot: Gross FDI figures often fail to distinguish between fresh investment and accounting transactions.
Illustrative Example: Large transactions involving Bosch and Mesee Technologies can significantly influence sectoral trends without necessarily bringing new productive capital.
Why can high gross FDI figures create a misleading picture of investment performance?
Gross FDI Recovery: Gross FDI inflows recovered to $94.6 billion, often cited as evidence of India’s continued attractiveness to foreign investors.
Accounting Transactions: Gross FDI statistics include intra-group ownership restructuring, mergers and acquisitions, share swaps, and conversion of external commercial borrowings (ECBs) into equity.
Limited Fresh Capital: Such transactions may alter ownership structures without necessarily bringing substantial new capital, technology, or productive capacity into the economy.
Sectoral Distortions: Large corporate restructuring exercises can inflate FDI numbers and create an impression of strong investment activity in particular sectors.
Developmental Concern: High gross inflows do not automatically translate into employment generation, manufacturing expansion, technology transfer, or export competitiveness.
Why is the decline in manufacturing FDI a major concern?
Four-Year Decline: Manufacturing FDI has fallen continuously for four consecutive years.
Low Share: Manufacturing accounted for only 10.6% of total effective inflows during the latest four-year period.
Employment Implications: Reduces potential for large-scale job creation.
Strategic Concern: Limits India’s ambition to become a major global manufacturing hub.
Does rising outward FDI represent globalisation or capital flight?
Rapid Growth: India’s outward FDI has increased significantly.
Sectoral Concentration: Around 45% of outward investments during 2023-24 to 2025-26 flowed into financial services, insurance, and business services.
Destination Pattern: Singapore and the UAE accounted for approximately 27% and 11% respectively.
Corporate Example: Tata Motors-owned subsidiary in Singapore invested $405 million to acquire IVECO Group in Italy.
GIFT City Link: FDI routed through GIFT City increased from $246 million in 2023-24 to $1.8 billion in 2025-26.
Extended Route: Total inflows and outward FDI through this channel reached approximately $1.40 billion, indicating expanding two-way flows.
Dual Interpretation: Outward FDI may indicate both global expansion of Indian firms and relocation of capital across jurisdictions.
How are FDI-related outflows reshaping India’s external sector?
Disinvestment Outflows
Magnitude: Disinvestment and capital withdrawals totalled approximately $178.9 billion.
Drivers: Secondary sales, IPO exits, and share buybacks.
Dividend Remittances
Amount: Reached $118.9 billion.
Source: Profits paid by multinational subsidiaries and affiliates, excluding reinvested earnings.
Intellectual Property Payments
Amount: Totalled $46.6 billion.
Nature: Payments for intellectual property and royalty use.
Estimated Allocation: Around 75% of total IPR payments assumed to be attributable to multinational subsidiaries and affiliates.
Technical and Service Payments
Amount: Around $250 billion transferred through technical and service/consultancy payments.
Difficulty: Separation between foreign and domestic company payments remains challenging.
Overall Outflows
Adjusted Outflows: Even after excluding OFDI, technical service payments, dividends and IPR-related outflows, total outflows remained around $344.4 billion.
Deteriorating Ratio: For every dollar of fresh inflow (excluding reinvested earnings), approximately $1.50 flowed out.
Historical Comparison: Outflow per dollar of inflow rose from 56 cents (2014-15 to 2017-18) to 70 cents (2018-19 to 2021-22) before reaching the current high.
Why should policymakers focus on the quality rather than the quantity of FDI?
Technology Transfer: Real FDI contributes more effectively to technological upgrading.
Industrial Development: Manufacturing-oriented FDI strengthens domestic production capabilities.
Investor Diversity: Different investor categories generate different developmental outcomes.
Policy Evaluation: FDI performance should be assessed through technology gains, industrial capacity creation, employment generation, and external-sector implications rather than gross inflow figures alone.
Core Message: Headline FDI numbers conceal important changes in investor composition, entry modes, exit strategies, and developmental impact.
Conclusion
India’s falling net FDI highlights that the quality and composition of foreign investment matter more than headline inflow numbers. Rising disinvestment, profit repatriation, and financial-investor-led flows have weakened net inflows despite strong gross FDI. Going forward, policy must prioritise productive, technology-intensive, and manufacturing-oriented FDI that strengthens industrial growth and external sector sustainability.
Value Addition
Net FDI vs Gross FDI
Indicator
Meaning
Gross FDI
Total foreign investment entering the economy
Net FDI
Gross inflows minus disinvestment and related outflows
Effective FDI
Fresh capital inflows after excluding accounting and restructuring transactions
Volatile Capital Flows: Increases external vulnerability.
Short-Term Orientation: Prioritises capital gains over industrial expansion.
PYQ Relevance
[UPSC 2016] Justify the need for FDI for the development of the Indian economy. Why is there a gap between MOUs signed and actual FDIs? Suggest remedial steps to increase actual FDIs in India.
Linkage: The question examines not merely the volume of FDI but its effectiveness, actual realization, and developmental contribution to the economy. The article highlights why the quality and developmental impact of FDI matter more than headline inflow numbers.
The RBI has allowed banks to raise fresh 3-5 year Foreign Currency Non-Resident (Bank) [FCNR(B)] deposits from NRIs and deposit the money with the RBI under a special scheme until September 2026. The RBI will bear the cost of protecting banks from exchange rate fluctuations (hedging cost), making it cheaper and more profitable for banks to attract foreign currency deposits. The objective is to encourage more NRI dollars to flow into India and strengthen foreign exchange inflows.
What are FCNR(B) deposits?
They are fixed-term foreign currency deposits offered by Indian banks to Non-Resident Indians (NRIs) and Overseas Citizens of India (OCIs).
They allow depositors to maintain savings in designated foreign currencies without converting funds into Indian rupees.
The RBI’s latest swap facility seeks to strengthen the attractiveness of these deposits and support India’s external financing requirements.
What is the US Dollar-Rupee Forex Swap Facility for FCNR(B) Deposits?
The Reserve Bank of India (RBI) introduced a special US Dollar-Rupee Forex Swap Facility to help banks mobilize fresh Foreign Currency Non-Resident, or FCNR(B) deposits. By bearing the hedging costs, the RBI enables banks to offer higher interest rates to NRIs without the currency risk.
Key details of the scheme include:
Eligible Depositors: Available to Non-Resident Indians (NRIs) and Overseas Citizens of India (OCIs).
Deposit Tenure: 3 to 5 years.
Deposit Currency: Mobilized in any freely convertible currency, but the swap must be done in US Dollars.
Foreign Currency Denomination: Maintains deposits in: US Dollar (USD), Pound Sterling (GBP), Euro (EUR), Japanese Yen (JPY), Australian Dollar (AUD), and Canadian Dollar (CAD)
Swap Rate: Undertaken “at par” (the RBI will buy USD at the FBIL Reference Rate and later sell it back at the same rate).
Timeline: Valid for deposits mobilized between June 8, 2026, and September 30, 2026. The swap window remains open to banks until October 16, 2026.
Lock-in Period: Underlying deposits are subject to a 1-year lock-in period; however, the swaps undertaken with the RBI cannot be canceled.
Availability: Authorised Dealer Category-I banks can avail of this facility once a week.
External Vulnerability Reduction: Reduces dependence on volatile portfolio flows.
Conclusion
The RBI’s decision to revive the FCNR(B) swap window reflects its proactive approach to strengthening India’s external sector amid a challenging global interest rate environment. While the facility reduces costs for banks and can potentially attract additional foreign currency inflows, its success will ultimately depend on whether banks offer sufficiently competitive returns to NRIs. Sustained mobilisation of FCNR(B) deposits can enhance foreign exchange reserves, support balance of payments stability, and reduce vulnerability to volatile capital flows, thereby reinforcing India’s macroeconomic resilience.
Value Addition
FCNR(B) Deposits vs NRE Deposits vs NRO Deposits
Feature
FCNR(B)
NRE
NRO
Full Form
Foreign Currency Non-Resident (Bank) Account
Non-Resident External Account
Non-Resident Ordinary Account
Currency
Foreign Currency
Indian Rupee
Indian Rupee
Exchange Rate Risk
No
Yes
Yes
Repatriability
Fully Repatriable
Fully Repatriable
Limited Repatriability
Tax on Interest
Tax Exempt
Tax Exempt
Taxable
Depositor Eligibility
NRI/OCI
NRI
NRI
Importance of NRI Deposits for India
Stable Capital Source: Less volatile than Foreign Portfolio Investment (FPI) and other short-term capital flows.
Foreign Exchange Augmentation: Supports accumulation of Foreign Exchange (Forex) Reserves.
Banking Sector Funding: Provides long-term foreign currency liabilities to banks.
External Financing: Supports financing of the Current Account Deficit (CAD) and other external sector requirements.
Crisis Buffer: Acts as a source of foreign capital during periods of external stress and global financial uncertainty.
RBI Instruments for Managing External Sector Stability
FCNR(B) Swap Window: Mobilises foreign currency deposits from NRIs while reducing hedging costs for banks.
Foreign Exchange (Forex) Market Intervention: Stabilises excessive exchange rate volatility in the rupee.
Foreign Exchange Reserves: Provides a buffer against external shocks and capital outflows.
Monetary Policy Operations: Influences liquidity conditions, interest rates, and capital flows.
Macroprudential Measures: Manages systemic risks arising from volatile capital movements and financial market disruptions.
India’s search for critical minerals has brought the Northeast into the national strategic spotlight. Government narratives increasingly portray states such as Arunachal Pradesh, Manipur, Meghalaya, and Mizoram as resource-rich frontiers capable of supporting India’s clean energy transition and industrial ambitions. This highlights a significant shift in how India views the Northeast. Traditionally it was framed through the lens of borders, security, insurgency, and connectivity.
Why is the Northeast Emerging as India’s Strategic Resource Frontier?
Critical Mineral Demand: Expanding demand for lithium, cobalt, graphite, nickel, and rare earth elements is reshaping global industrial and geopolitical competition.
Energy Transition: Batteries, electric vehicles, renewable energy technologies, and energy storage systems depend heavily on critical minerals.
Technological Manufacturing: Semiconductors and advanced manufacturing require secure access to strategic minerals.
Defence Applications: Defence technologies increasingly rely on mineral-intensive supply chains.
Strategic Autonomy: Reduces dependence on external suppliers and strengthens supply-chain resilience.
Resource Potential: Geological surveys indicate significant mineral potential across several Northeastern states.
How Has Government Discourse on the Northeast Changed?
Borderland Narrative: The Northeast was historically discussed through issues of insurgency, territorial security, border management, and connectivity.
Security-Centric Approach: Infrastructure projects were often justified as instruments of strategic access and territorial integration.
Resource Frontier Narrative: The region is increasingly portrayed as a source of strategic minerals critical for national development.
Expanded Strategic Significance: Discussions now combine security, resource access, industrial policy, and geopolitical competitiveness.
National Economic Integration: Resource development is becoming central to how the region is represented in national policymaking.
What Is the Scale of Critical Mineral Exploration in the Northeast?
Exploration Expansion: Geological Survey of India undertook 43 critical mineral exploration projects in northeastern states during the 2022-23, 2023-24 and 2024-25 field seasons.
Minerals Covered: Exploration focused on graphite, vanadium, lithium, rare earth elements, nickel and cobalt.
Geographical Spread: Activities expanded across Arunachal Pradesh, Meghalaya, Assam, Nagaland and Manipur.
Ownership Disputes: Resource projects often intersect with unresolved questions of land rights.
Political Inclusion: Communities evaluate projects through the lens of representation and participation.
Conflict Sensitivity: Resource development in fragile regions may acquire meanings beyond economic development.
Can Resource Development Create New Governance Challenges?
Institutional Capacity: Extraction may proceed faster than institutions capable of managing its consequences.
Uneven Development: The Northeast has historically experienced uneven infrastructure and economic growth.
Connectivity Mismatch: Infrastructure projects have sometimes emerged without corresponding economic ecosystems.
Participation Deficit: Strategic priorities have often overshadowed local participation and consultation.
Social Risks: Rapid extraction may reproduce tensions if benefits are unevenly distributed.
Governance Imperative: Resource development requires strong institutions, transparency, and social safeguards.
Why Is Inclusion as Important as Extraction?
Benefit Sharing: Local communities seek meaningful economic participation.
Employment Opportunities: Resource projects can address long-standing developmental deficits.
Political Legitimacy: Inclusive governance strengthens acceptance of projects.
Community Ownership: Participation improves trust and reduces conflict.
Sustainable Development: Long-term success depends on balancing strategic objectives with local aspirations.
Conclusion
The Northeast’s emergence as a critical mineral hub presents India with a strategic opportunity to strengthen resource security, support the energy transition, and reduce external dependence. However, the region cannot be treated merely as a repository of minerals waiting for extraction. Sustainable success will depend on reconciling national developmental priorities with local aspirations, customary land rights, ecological safeguards, and participatory governance. The real challenge is not only to extract resources from the Northeast, but to ensure that its people become equal stakeholders in the region’s transformation from a borderland to a strategic resource frontier.