💥Join UPSC 2027,2028 Mentorship (July Batch) + XFactor Notes & Microthemes PDF

GS Paper: Indian Economy

  • Anti-Dumping Duties on Chemicals

    Why in News?

    Indian chemical industry associations and several ministries have sought a pause on anti-dumping investigations due to rising chemical prices and shortages caused by the West Asia conflict.

    What are Anti-Dumping Duties?

    • Anti-dumping duties are tariffs imposed on imported goods sold below fair market value to protect domestic industries from unfair competition.

    Key Issues Raised

    Rising Input Costs

    • Anti-dumping duties increase prices of chemical intermediates.
    • Impacts downstream sectors such as:
      • Textiles
      • Footwear
      • Packaging
      • Auto components
      • Paints

    Supply Chain Disruptions

    • West Asia conflict has caused shortages and price volatility in petrochemicals.

    Government Response

    • Duty Exemptions: Government of India exempted import duty on 40 petrochemical products till June 30.

    Indigenous Manufacturing Push

    The Department for Promotion of Industry and Internal Trade (DPIIT) asked industry to explore domestic production of over 200 highly import-dependent petrochemical items.

    WTO Trade Policy Review Findings

    • 51% of India’s anti-dumping measures relate to chemicals and allied industries.
    • China is the main target of these investigations.

    India’s Chemical Trade Scenario

    • Chemical imports: about $75 billion
    • Chemical exports: about $44 billion
    • Trade deficit: around $31 billion

    [2020] With reference to the international trade of India at present, which of the following statements is/are correct?

    1.India’s merchandise exports are less than its merchandise imports.
    2.India’s imports of iron and steel, chemicals, fertilisers and machinery have decreased in recent years.
    3.India’s exports of services are more than its imports of services.
    4.India suffers from an overall trade/current account deficit.
    Select the correct answer using the code given below:
    a) 1 and 2 only
    b) 2 and 4 only
    c) 3 only
    d) 1, 3 and 4 only

  • Why is the Indian Rupee falling

    Why in the News?

    The Indian rupee recently crossed ₹96 per U.S. dollar in May 2025, compared to nearly ₹85 a year earlier. This marked a sharp depreciation amid global geopolitical tensions, foreign portfolio outflows, and rising import dependence.

    Why does the Indian rupee continue to depreciate despite India’s growing economy?

    1. Demand-Supply Dynamics: Currency prices depend on market demand relative to other currencies. A higher demand for dollars than rupees weakens the rupee.
    2. Import Dependence: India imports large quantities of crude oil, electronics, machinery, and industrial inputs, increasing demand for dollars.
    3. Trade Deficit: India’s imports consistently exceed exports, creating a merchandise trade deficit.
      1. Data Point: Merchandise trade deficit worsened from USD 244.9 billion (2023-24) to USD 286.9 billion (2024-25).
    4. Geopolitical Uncertainty: Global instability encourages investors to shift funds toward safer assets such as the U.S. dollar, strengthening it relative to emerging market currencies.
    5. Dollar Strength: Higher U.S. interest rates attract global capital into dollar-denominated assets.

    How does India’s Balance of Payments (BoP) shape the rupee’s exchange rate?

    India’s Balance of Payments (BoP) directly shapes the rupee’s exchange rate by determining the net demand and supply of foreign currency within the economy.

    1. Analyze Current Account ImpactThe Current Account reflects the net balance of trade in goods, services, and transfer payments
      1. Merchandise Trade Deficit: Increased from USD 244.9 billion (2023-24) to USD 286.9 billion (2024-25).
      2. Invisibles Surplus Buffers Rupee: Strong software services exports and remittances from workers abroad (especially West Asia) created a net invisible surplus rise from USD 218.8 billion to USD 263.9 billion. This creates massive inflows of foreign currency, supporting rupee stability.
      3. Net Deficit Weakens Rupee: Because the merchandise deficit outweighs the invisibles surplus, the overall current account remains in a deficit (CAD).
    2. Evaluate Capital Account Dynamics: The Capital Account tracks the flow of investment capital, loans, and banking capital across national borders.
      1. Financing the Gap: India relies on foreign capital inflows to bridge the CAD.
      2. FDI and Portfolio Inflows: Inflows from Foreign Direct Investment (FDI) and Foreign Portfolio Investment (FPI) demand Indian currency. Foreigners convert USD to INR to buy assets, which strengthens the rupee.
      3. External Borrowing Risks: Relying on short-term loans and external borrowings can cause sudden rupee volatility if global interest rates spike or investors pull funds out rapidly.
    3. Review Exchange Rate Outcomes: The final value of the rupee hinges on the net interaction between these two accounts.
    BoP Condition Market MechanismImpact on Indian Rupee
    Overall BoP SurplusCapital Inflows > Current Account DeficitAppreciates (Rupee strengthens)
    Overall BoP DeficitCapital Inflows < Current Account DeficitDepreciates (Rupee weakens)

    India’s BoP Snapshot (Figures in USD billion)

    Component2023-242024-25
    Current Account-26.1-23.1
    Merchandise Trade-244.9-286.9
    Invisibles218.8263.9
    Capital Account89.4116.6
    FDI54.24.52
    Loans6.529.3
    Others28.7-17.2
    Forex Reserves Change-63.7+5

    How do foreign capital outflows weaken the rupee?

    Foreign capital outflows weaken the rupee through a direct market mechanism of asset liquidation and currency conversion.

    1. The Conversion Mechanism: When foreign portfolio investors (FPIs) decide to exit the Indian market, they liquidate their holdings in domestic stocks and bonds. This process unfolds in two distinct steps that put downward pressure on the currency:
      1. Asset Liquidation: Investors sell Indian equities and debt instruments, receiving payments in Indian Rupees (INR).
      2. Currency Conversion: To repatriate their capital, these investors must immediately sell their newly acquired rupees in the foreign exchange market to buy US Dollars (USD).
    2. Supply and Demand Imbalance: The mass exit of foreign capital disrupts the equilibrium of the foreign exchange market:
      1. Surplus of Rupee: The market experiences a sudden, heavy supply of rupees as exiting investors rush to dump the currency.
      2. Scarcity of Dollars: Simultaneously, the demand for US dollars spikes sharply.
      3. Depreciation: According to standard economic laws of supply and demand, an oversupply of a currency combined with intense demand for a foreign counterparty currency causes the domestic currency (the rupee) to lose value.
    3. FPI vs. FDI Stability: The nature of the capital leaving the country dictates the severity of the exchange rate impact:
      1. High Volatility (FPI): Foreign Portfolio Investment is highly liquid and seeking short-term financial returns. It can exit a country almost instantly, earning it the label “hot money.” This makes FPI the primary driver of sudden, sharp currency depreciation during global market panics.
      2. Resilient Cushion (FDI): Foreign Direct Investment (FDI) involves long-term, physical investments like building factories or buying corporate infrastructure. Because these assets cannot be quickly liquidated, FDI remains stable during crises and serves as a critical structural anchor for the rupee.

    Why does a falling rupee become costly for India’s economy?

    1. Imported Inflation: Depreciation raises costs of imported goods.
    2. Oil Burden: India imports a substantial share of crude oil, making energy prices vulnerable to currency depreciation.
    3. Data Illustration: At ₹96 per dollar, purchasing USD 100 worth of oil requires ₹9,600, compared to ₹8,500 at ₹85 per dollar.
    4. Inflationary Transmission: Higher fuel costs increase logistics and transportation expenses across sectors.
    5. Manufacturing Constraints: Expensive imported raw materials raise production costs.
    6. Growth Trade-off: Depreciation may support exports but simultaneously increases import dependence.

    Does a weaker rupee improve India’s exports automatically?

    1. Export Competitiveness: A cheaper rupee can make Indian goods more affordable globally.
    2. Structural Constraints: Export gains remain limited when manufacturing competitiveness is weak.
      1. Even if the rupee depreciates from ₹96 to ₹120, export gains may remain modest due to supply-side constraints.
    3. Import Dependence in Manufacturing: Many exporters rely on imported inputs, reducing net gains from depreciation.

    What role does the Reserve Bank of India (RBI) play in defending the rupee?

    1. Forex Intervention: RBI sells dollars from reserves to reduce excessive rupee depreciation.
    2. Market Stabilisation: Dollar sales increase dollar supply in forex markets and support rupee demand.
    3. Forex Reserve Strength: India’s reserves stood at approximately USD 691 billion by March 2026, sufficient for around 10.8 months of imports.
    4. Intervention Evidence: RBI actively intervened during October 2024-January 2025 and August-December 2025.
    5. Limitation: RBI can moderate volatility but cannot permanently reverse depreciation caused by structural deficits.

    Why is oil dependency central to rupee vulnerability?

    1. Crude Oil Imports: India imports nearly 85% of its crude oil requirement, increasing dollar demand.
    2. External Vulnerability: Oil price shocks worsen trade deficits and strain forex reserves.
    3. Geopolitical Linkage: Conflicts in energy-producing regions raise crude prices, amplifying pressure on the rupee.
    4. Policy Imperative: Reducing oil dependence through renewables, EVs, ethanol blending, and domestic energy diversification strengthens currency stability.

    Conclusion

    The rupee’s depreciation reflects deeper structural realities of India’s external sector rather than merely short-term market fluctuations. Persistent trade deficits, dependence on imported oil, volatile portfolio flows, and geopolitical disruptions continue to pressure the currency. While RBI intervention and strong forex reserves provide temporary insulation, durable currency stability ultimately depends on strengthening exports, reducing import dependence, and improving external sector resilience.

    PYQ Relevance

    [UPSC 2018] How would the recent phenomena of protectionism and currency manipulations in world trade affect macroeconomic stability of India? 

    Linkage: The PYQ tests understanding of exchange rate volatility, external sector vulnerabilities, capital flows, and macroeconomic stability. The article explains how rupee depreciation, trade deficits, foreign capital outflows, geopolitical tensions, and dollar strengthening affect India’s macroeconomic stability and Balance of Payments. 

  • Nirmala Sitharaman Flags ‘3F’ Concerns: Fuel, Fertiliser and Foreign Exchange

    Why in the News?

    Finance Minister Nirmala Sitharaman highlighted concerns regarding “3Fs” Fuel, Fertiliser and Foreign Exchange amid the economic impact of the ongoing West Asia crisis.

    Key Economic Concerns

    Rupee Depreciation

    • Rupee weakened sharply against the U.S. dollar after the war began.
    • RBI reportedly intervened heavily in forex markets.

    Foreign Portfolio Investment (FPI) Outflows

    • Foreign investors sold: Indian stocks and bonds leading to:
      • Capital outflows
      • Pressure on forex reserves

    Forex Reserves Decline

    • India’s forex reserves reportedly fell significantly compared to pre-war levels.

    Government Measures Taken

    • Higher import duty on:
      • Gold
      • Silver
      • Platinum
    • Restrictions on duty-free gold imports
    • Fuel price hikes
    • Appeals to reduce non-essential imports and foreign travel

    [2022] With reference to the Indian economy, consider the following statements:
    1. If the inflation is too high, Reserve Bank of India (RBI) is likely to buy government securities.
    2. If the rupee is rapidly depreciating, RBI is likely to sell dollars in the market.
    3. If interest rates in the USA or European Union were to fall, that is likely to induce RBI to buy dollars

    Which of the statements given above are correct?

    [A] 1 and 2 only

    [B] 2 and 3 only

    [C] 2 and 3 only

    [D] 1, 2 and 3

  • Why rising government bond yields are bad news for people and businesses

    Why in the News?

    Government bond yields across major economies have risen sharply, reaching some of the highest levels since the 2008 Global Financial Crisis. India’s 10-year government bond yield increased from 6.58% (Dec 2025) to 7.08% (May 2026), while major economies such as the United States and the United Kingdom also witnessed rising yields.

    Why Do Governments Borrow Money?

    1. Revenue Gap: Governments frequently face expenditure commitments exceeding tax and non-tax revenues, requiring borrowing to bridge fiscal deficits.
    2. Developmental Spending: Developing countries often require greater public expenditure on infrastructure, welfare, health, and education.
    3. Weak Tax Base: Lower-middle-income countries face constraints in revenue mobilization due to a smaller formal tax-paying population.
    4. Counter-Cyclical Fiscal Policy: Governments borrow during economic slowdowns to sustain growth through public expenditure.
    5. Debt Refinancing: Existing debt obligations often require fresh borrowing for repayment and rollover.
    6. Example: Advanced economies with slow growth increasingly depend on debt-financed expenditure.

    What Are Bonds?

    1. Debt Instrument: A bond is a financial instrument through which governments or companies borrow money from investors for a fixed period.
    2. Loan Mechanism: Investors lend money to the issuer, who promises periodic interest payments and repayment of principal at maturity.
    3. Fixed Return Structure: Most bonds carry a fixed coupon rate, ensuring regular interest income.

    How Do Governments Borrow Through Bonds?

    1. Government Securities (G-Secs): Governments issue bonds to investors for a specified period in return for annual interest payments.
    2. Fixed Coupon Payments: A bond issued at ₹100 with a 5% coupon pays ₹5 annually until maturity.
    3. Principal Repayment: Governments return the original invested amount at maturity.
    4. Sovereign Guarantee: Government bonds are considered relatively safer because sovereign default risks remain comparatively low.
    5. Benchmark Role: Government bond yields influence borrowing rates for homes, factories, businesses, and infrastructure financing.
    6. Example: India issues government securities (G-Secs), while the United States issues Treasury bonds.

    Why Are Government Bond Yields Rising Globally?

    Bond yield is simply the return (profit/interest) an investor earns from lending money to the government through bonds. Bond yields rise and fall because bond prices change in the market.

    1. Inflationary Pressures: Rising inflation reduces the real return on investments, compelling investors to demand higher yields.
    2. Increased Borrowing Requirements: Governments facing wars, welfare commitments, or fiscal stress require greater borrowing, increasing bond supply.
    3. Higher Risk Perception: Investors demand greater compensation where macroeconomic uncertainty or fiscal deficits rise.
    4. Monetary Tightening: Central banks maintain higher policy rates to control inflation, indirectly pushing bond yields upward.
    5. Debt Sustainability Concerns: High public debt increases investor caution regarding fiscal management.
    6. Example: A hypothetical war-induced rise in government spending increases borrowing demand, leading lenders to seek higher returns.

    How Do Rising Bond Yields Affect Existing Bond Prices?

    1. Inverse Relationship: Bond prices move inversely to yields.
    2. Price Correction: A bond paying a fixed annual return becomes less attractive when newer bonds offer higher returns.
    3. Capital Loss Risk: Existing bondholders may incur losses if they sell older low-yield bonds before maturity.
    4. Illustration: A bond bought at $100 with 5% annual returns becomes unattractive when new bonds offer 10% returns, forcing its market value downward, potentially toward $50.

    Why Are Rising Bond Yields Bad News for Governments?

    1. Fiscal Stress: Governments spend a larger share of budgets on interest payments.
    2. Crowding Out: Higher sovereign borrowing costs reduce fiscal space for productive expenditure.
    3. Welfare Compression: Governments may reduce social welfare spending to accommodate debt servicing.
    4. Tax Burden: States may increase taxes to meet rising debt obligations.
    5. Refinancing Risk: Countries refinancing trillions of dollars face increased fiscal pressure.
    6. Example: High debt servicing can reduce expenditure on welfare schemes and defence modernization.

    How Do Rising Bond Yields Affect Businesses and Citizens?

    1. Higher Loan Costs: Banks and lenders raise interest rates for businesses and households.
    2. Investment Slowdown: Higher borrowing costs discourage industrial expansion.
    3. Housing Impact: Mortgage rates rise, reducing housing affordability.
    4. Consumer Spending Constraints: Expensive loans reduce household purchasing power.
    5. Economic Slowdown: Reduced borrowing lowers investment and aggregate demand.
    6. Example: Costlier factory loans reduce private investment expansion.

    Why Is the Current Global Yield Trend Significant?

    1. Post-2008 Highs: Borrowing costs have reached levels not witnessed since the Global Financial Crisis.
    2. Global Synchronisation: Yield increases are visible across both developed and emerging economies.
    3. Debt Vulnerability: High public debt accumulated after COVID-19 increases refinancing risks.
    4. Policy Dilemma: Governments face trade-offs between inflation control and economic growth support.

    Conclusion

    Rising government bond yields signify tightening financial conditions and growing fiscal pressures across economies. Since sovereign yields act as the benchmark for economy-wide borrowing costs, persistent increases can constrain welfare spending, private investment, and growth prospects. Fiscal prudence, inflation management, and sustainable debt strategies remain essential to mitigate the long-term risks of expensive borrowing.

    PYQ Relevance

    [UPSC 2019] The public expenditure management is a challenge to the Government of India in context of budget making during the post liberalization period. Clarify it.

    Linkage: The PYQ focuses on public expenditure management and fiscal pressures in budget-making after liberalisation. Rising bond yields increase government borrowing costs and interest burden. This reduces fiscal space for welfare, infrastructure, and development spending.

  • Should the rupee be left to depreciate

    Why in the News?

    The Indian rupee has witnessed sustained losses and approached nearly ₹97 against the U.S. dollar. This has revived debate over whether the Reserve Bank of India (RBI) should allow market-driven depreciation or actively intervene. The issue has become significant because depreciation coincides with rising global inflationary pressures and volatile foreign capital flows, increasing risks of imported inflation in essential goods.

    Why Has the Rupee’s Depreciation Become a Major Macroeconomic Concern?

    1. Sustained Depreciation: The rupee has experienced continuous losses and moved close to ₹97 per U.S. dollar, indicating prolonged pressure rather than temporary volatility.
    2. Imported Inflation: A weaker rupee increases costs of imported goods, especially fuel, edible oil, fertilizers, electronics, and industrial inputs, intensifying domestic inflation.
    3. Global Commodity Exposure: Rising energy and commodity prices amplify economic stress because India remains significantly dependent on imports.
    4. Household Impact: Higher import costs translate into increased prices of essential goods, disproportionately affecting lower and middle-income households.
    5. Macroeconomic Vulnerability: Persistent depreciation raises concerns regarding inflation management, current account deficits, and external debt servicing.

    Why Is the Distinction Between a Weak Rupee and a Falling Rupee Important?

    India currently faces a falling rupee, not necessarily a weak rupee, because the decline is linked more to external capital movements than worsening domestic fundamentals.

    1. Weak Rupee: Reflects deeper structural issues such as lower export competitiveness, persistent inflation, weak productivity, or prolonged external imbalances. It indicates pressure arising from domestic economic fundamentals.
    2. Falling Rupee: Refers to a short-term depreciation in currency value, often driven by external factors such as global uncertainty, rising U.S. interest rates, or foreign investor withdrawals.
    3. Current Context: India’s rupee decline reflects temporary market pressures and capital outflows more than deterioration in macroeconomic fundamentals such as growth or reserves.
    4. Policy Implication: Structural weakness requires long-term reforms in exports, manufacturing, and productivity, whereas temporary depreciation may require measured RBI intervention to reduce volatility.
    5. Example: During the 2013 Taper Tantrum, sudden foreign capital exits sharply weakened the rupee despite no immediate collapse in domestic fundamentals.

    Can Currency Depreciation Automatically Correct India’s Current Account Deficit?

    A Current Account Deficit (CAD) occurs when a country’s total outflows for imported goods, services, income, and transfers exceed its total inflows from exports. It means a nation is spending more foreign currency abroad than it is earning, relying on foreign borrowing or investment to cover the gap.

    1. Current Account Adjustment: Currency depreciation theoretically improves trade balance by making exports cheaper and imports costlier.
    2. Export Competitiveness: A weaker rupee can support sectors such as IT services, pharmaceuticals, textiles, engineering goods, and merchandise exports.
    3. Import Compression: Higher import prices may reduce demand for non-essential imported goods.
    4. Structural Limitation: India imports essential commodities such as crude oil, where demand remains relatively inelastic; import reduction therefore remains limited.
    5. Delayed Impact: Trade balance improvements often emerge after a time lag due to the J-Curve Effect, where trade deficits may initially worsen before improving.
    6. Capital Flow Dependence: Current account correction requires adequate foreign capital inflows; persistent capital exits weaken adjustment capacity.

    Why May Market-Driven Depreciation Fail to Deliver Expected Benefits?

    1. Speculative Capital Outflows: The article highlights that much of the rupee’s decline is driven by withdrawals by Foreign Institutional Investors (FIIs) rather than trade fundamentals.
    2. Interest Rate Expectations: Anticipation of rising global interest rates makes Indian assets relatively less attractive, encouraging capital flight.
    3. Uncertain Export Gains: Export growth may remain weak if global demand slows or domestic production constraints persist.
    4. Imported Inflation Pressure: Rising costs of imported inputs increase production expenses, reducing gains from export competitiveness.
    5. Negative Market Sentiment: Continued depreciation may create expectations of further decline, reinforcing speculative selling.

    How Can Unchecked Rupee Depreciation Intensify Inflationary Risks?

    1. Essential Commodity Inflation: Depreciation increases prices of imported essentials, especially fuel and edible oils, feeding broad-based inflation.
    2. Inflation Expectations: Businesses and consumers may expect future price increases, encouraging advance purchases and demand-side inflation.
    3. Cost-Push Inflation: Higher import costs raise production expenses across industries.
    4. Monetary Policy Constraints: Persistent inflation may compel tighter monetary policy and higher interest rates.
    5. Growth-Inflation Trade-off: Higher rates can slow investments and economic growth while attempting to contain inflation.

    What Role Do Foreign Capital Flows Play in Exchange Rate Movements?

    1. Portfolio Capital Dependence: India’s external sector remains dependent on foreign portfolio investment for financing deficits.
    2. FII Outflows: Speculative withdrawal of foreign institutional capital weakens demand for rupees.
    3. Interest Rate Differential: Higher interest rates in advanced economies, especially the U.S. The Federal Reserve tightening cycle often pulls capital away from emerging economies.
    4. Sentiment-Driven Volatility: Exchange rates often reflect investor expectations rather than actual consumption demand.
    5. External Vulnerability: Excessive dependence on volatile capital flows increases susceptibility to sudden exchange rate shocks.

    Should the RBI Intervene or Allow Market Forces to Determine Rupee Value?

    Arguments for Limited Intervention

    1. Market Efficiency: Freely floating exchange rates enable natural external sector adjustments.
    2. Export Advantage: Moderate depreciation improves competitiveness of Indian exports.
    3. Reserve Conservation: Reduced intervention prevents depletion of foreign exchange reserves.

    Arguments for Active Intervention

    1. Inflation Control: Intervention limits imported inflation in essential goods.
    2. Market Stability: RBI action prevents disorderly and speculative currency movements.
    3. Financial Confidence: Stable exchange rates strengthen investor confidence and reduce panic.
    4. External Sector Protection: Controlled volatility protects import-dependent sectors.
    5. Global Precedent: Even advanced economies intervene during excessive volatility. Japan signaled decisive intervention to support the yen during sharp depreciation pressures.

    How Should India Balance Market Forces and Currency Stability?

    1. Calibrated Intervention: RBI may allow gradual market adjustment while preventing disorderly volatility.
    2. Capital Flow Management: Policies ensuring stable long-term foreign investment reduce speculative dependence.
    3. Export Diversification: Expanding high-value manufacturing and services exports strengthens resilience.
    4. Energy Security: Reduced oil dependence lowers vulnerability to imported inflation.
    5. Macroeconomic Coordination: Monetary, fiscal, and trade policies require alignment to stabilize external accounts.

    Conclusion

    Rupee depreciation can help exports and correct trade imbalances, but unchecked decline may increase imported inflation and economic instability. India needs a balanced approach where the RBI allows gradual market adjustment while preventing excessive volatility to protect growth and price stability.

    PYQ Relevance

    [UPSC 2018] How would the recent phenomena of protectionism and currency manipulations in world trade affect macroeconomic stability of India?

    Linkage: This PYQ directly links with the article’s core debate on rupee depreciation, currency valuation, and macroeconomic stability. It tests understanding of how exchange-rate movements, capital flows, inflation, trade balance, and external vulnerabilities affect India’s economy.
  • Five southern states account for 75% of outstanding gold loans

    Why in the News?

    India’s gold loan market has emerged as the fastest-growing retail lending segment. It recorded a sharp 50.4% year-on-year growth, with five southern states, and Tamil Nadu, Andhra Pradesh, Karnataka, Telangana, and Kerala, accounted for nearly 75% of India’s outstanding gold loans. The trend is significant because it reveals a stark regional contrast in credit behaviour, with even populous states like Uttar Pradesh (₹42,300 crore) lagging far behind Tamil Nadu (₹5.96 lakh crore) in gold loan penetration.

    Why Has Southern India Emerged as the Epicentre of Gold Loans?

    1. Agricultural Credit Linkages: High prevalence of agri-gold loans supports southern dominance, as banks use gold-backed lending to meet Priority Sector Lending (PSL) targets for agriculture.
    2. High Household Gold Ownership: Southern households traditionally hold larger quantities of gold jewellery, creating a stronger collateral base for borrowing.
    3. Cultural Acceptance of Gold Monetisation: Gold is widely treated as a financial asset rather than only ornamentation. This makes pledging jewellery socially acceptable during emergencies or for business needs.
    4. Dense Institutional Ecosystem: Strong presence of specialised gold loan NBFCs and bank branches ensures faster disbursal, easier access, and lower transaction costs.
      1. Example: Finance Giants like Muthoot Finance and Manappuram Finance both originated in Kerala.
    5. Greater Formal Credit Adoption: Borrowers in southern states show higher familiarity with organised gold-backed lending compared to informal borrowing channels.
    6. Higher Gold Prices and Loan Ticket Expansion: Rising gold valuations increased collateral worth, enabling borrowers to access larger loans and accelerating market growth.

    What Does the Data Reveal About Southern Dominance?

    1. Regional Concentration: Tamil Nadu, Andhra Pradesh, Karnataka, Telangana, and Kerala account for nearly 75% of India’s gold loan outstanding.
    2. Outstanding Share: Out of ₹18.6 lakh crore, southern states account for ₹13.94 lakh crore (March 2026).
    3. State-wise Distribution:
      1. Tamil Nadu: ₹5.96 lakh crore
      2. Andhra Pradesh: ₹3.08 lakh crore
      3. Karnataka: ₹1.81 lakh crore
      4. Telangana: ₹1.60 lakh crore
      5. Kerala: ₹1.45 lakh crores

    Why Is Uttar Pradesh’s Low Gold Loan Penetration Significant?

    1. Population-Credit Disconnect: Despite being India’s most populous state and possessing substantial household gold holdings, Uttar Pradesh records only ₹42,300 crore in gold loan outstanding. This indicates weak formal credit uptake
    2. Regional Financial Imbalance: Sharp contrast with southern states highlights uneven regional deepening of secured retail credit, despite similar household demand for liquidity.
    3. Lower Formalisation of Household Finance: Greater dependence on informal borrowing channels may persist due to weaker penetration of organised gold-loan institutions.
    4. Limited Banking and NBFC Ecosystem: Lower density of specialised gold-loan providers reduces accessibility and familiarity with gold-backed borrowing.
    5. Credit Behaviour Differences: Unlike southern states where gold functions as a frequently monetised financial asset, northern households may treat gold more as a store of wealth/social asset than collateral.

    What Does the Comparative Data Reveal?

    1. Uttar Pradesh: ₹42,300 crore
    2. West Bengal: ₹35,000 crore
    3. Rajasthan: ₹41,700 crore
    4. Gujarat: ₹57,100 crore

    What Factors Are Driving the Rapid Expansion of Gold Loans?

    1. Rising Gold Prices: Higher collateral value enables borrowers to access larger loan amounts.
      1. Example: More Cash for the Same Gold: If a borrower pledged 50 grams of gold a few years ago, they might have qualified for a loan of ₹1.5 lakh. Today, that exact same jewelry can unlock ₹2.5 lakh or more.
    2. Secured Borrowing Preference: Gold loans provide relatively easier access to credit than unsecured personal loans.
      1. Gold loans require zero credit score checks (CIBIL scores are practically irrelevant), require no proof of income, and can be approved in under 15 minutes.
    3. Digital/Online Gold Loans: The rise of Online Gold Loans (OGL) and fintech partnerships has helped in:
      1. Locker-as-a-Service: Borrowers can store their gold in a bank’s secure vault once.
      2. Instant Drawdowns: Whenever they need cash, they can use a mobile app to instantly draw down a loan against that stored gold directly into their bank account, 24/7. They only pay interest for the exact number of days they use the funds.
    4. Increasing Credit Demand: Borrowers increasingly use gold loans to meet household expenses, consumption needs, and business requirements.
    5. Agricultural Reclassification: Shift of agri-gold loans into retail classification has contributed to portfolio expansion.
    6. Economic Uncertainty: Consumers increasingly prefer asset-backed borrowing during financial stress.

    How Fast Is India’s Gold Loan Market Growing?

    1. Fastest-Growing Lending Segment: Gold loans expanded 50.4% year-on-year and 15% quarter-on-quarter.
    2. Second-Largest Retail Product: Gold loans have emerged as the second-largest product in retail lending after home loans.
    3. Asset Quality Improvement: Early-stage delinquencies declined across ticket sizes between March 2025 and March 2026.
    4. Retail Credit Driver: Gold loans emerged as a major engine of retail credit growth in FY26.

    How Are Banks and NBFCs Competing in the Gold Loan Ecosystem?

    1. PSU Bank Dominance: Public sector banks continue to dominate gold loan originations by value.
    2. Market Share Decline: PSU banks’ share reduced from 51.1% in Q4FY24 to 44.6% in Q4FY26, despite retaining leadership.
    3. NBFC Expansion: NBFCs increased origination value share from 20.7% in Q4FY24 to 31.6% in Q4FY26.
    4. Volume Leadership: NBFCs account for 49% share in origination volume, reflecting strong penetration in smaller ticket loans.
    5. Distribution Advantage: Faster disbursal and deeper regional outreach strengthen NBFC-led growth.

    What Structural Changes Are Emerging in Gold Loan Borrowing?

    1. Higher Ticket Sizes: Borrowers increasingly seek larger loans due to rising gold prices.
    2. Income-Generating Uses: Loans increasingly finance business activity and productive expenditure, rather than only emergency consumption.
    3. Retail Portfolio Shift: Consumers increasingly shift toward secured retail credit amid tighter personal lending conditions.
    4. Collateral Strength: Larger loans in ₹2.5-5 lakh and ₹5 lakh+ categories witnessed improved collateral coverage.

    What Are the Broader Economic and Financial Implications?

    1. Financial Inclusion: Gold loans improve access to formal credit for households lacking traditional collateral.
    2. Credit Formalisation: Reduces dependence on informal moneylenders charging exorbitant interest.
    3. Consumption Stabilisation: Ensures liquidity during emergencies and supports household spending.
    4. MSME Financing: Facilitates short-term working capital for small businesses and self-employed households.
    5. Regional Imbalance: Concentration in southern India signals uneven access to financial products across regions.

    Conclusion

    Gold loans are increasingly emerging as an important pillar of India’s retail credit ecosystem. Ensuring wider regional penetration and balanced access to formal gold-backed finance will be essential for strengthening financial inclusion and reducing dependence on informal credit channels.

    PYQ Relevance

    [UPSC 2022] Is inclusive growth possible under market economy? State the significance of financial inclusion in achieving economic growth in India.

    Linkage: The PYQ tests understanding of financial inclusion, regional disparities in access to institutional credit, and inclusive economic growth.The article highlights how gold loans improve access to formal credit. But it also exposes regional imbalances, with southern states far ahead of states like Uttar Pradesh in secured lending penetration.

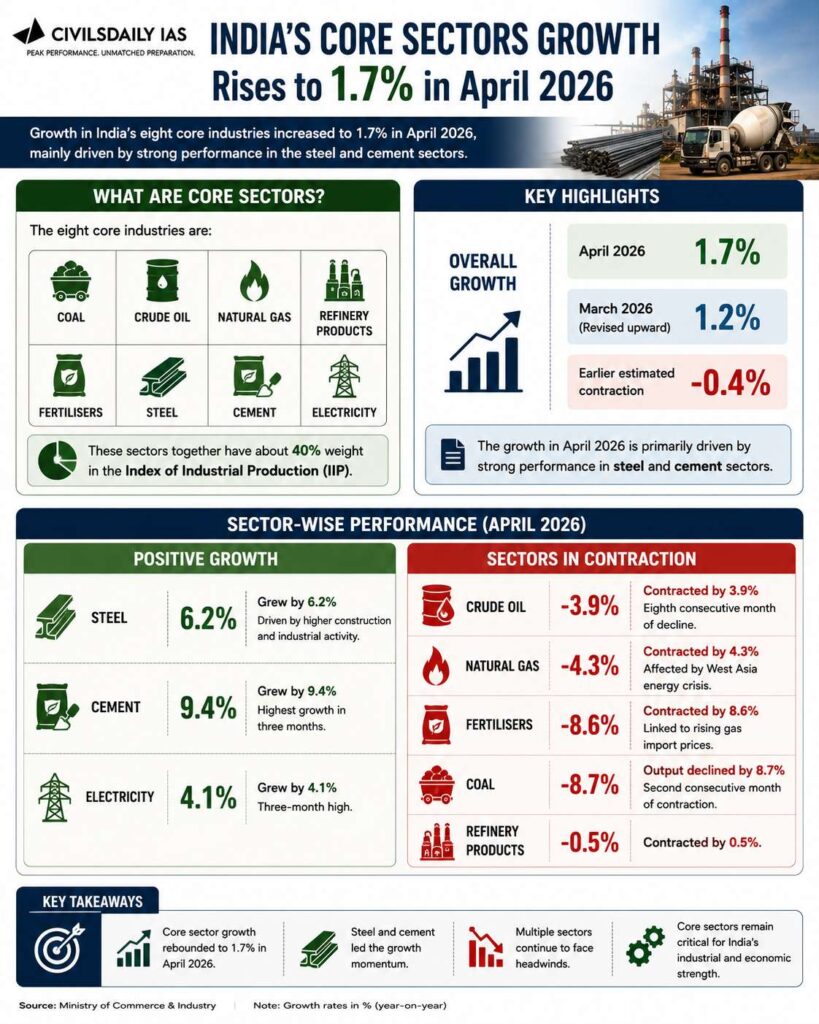
  • Core Sector Growth Rises to 1.7% in April 2026

    Why in the News?

    Growth in India’s eight core industries increased to 1.7% in April 2026, mainly driven by strong performance in the steel and cement sectors.

    What are Core Sectors?

    The eight core industries are:

    • Coal
    • Crude oil
    • Natural gas
    • Refinery products
    • Fertilisers
    • Steel
    • Cement
    • Electricity
    • These sectors together have about 40% weight in the Index of Industrial Production (IIP).

    Key Highlights

    Overall Growth

    • April 2026: 1.7%
    • March 2026:
      • Revised upward to 1.2%
      • Earlier estimated contraction: -0.4%

    Sector-wise Performance

    Positive Growth

    Steel

    • Grew by 6.2%
    • Driven by higher construction and industrial activity.

    Cement

    • Grew by 9.4%
    • Highest growth in three months.

    Electricity

    • Grew by 4.1%
    • Three-month high.

    Sectors in Contraction

    Crude Oil

    • Contracted by 3.9%
    • Eighth consecutive month of decline.

    Natural Gas

    • Contracted by 4.3%
    • Affected by West Asia energy crisis.

    Fertilisers

    • Contracted by 8.6%
    • Linked to rising gas import prices.

    Coal

    • Output declined by 8.7%
    • Second consecutive month of contraction.

    Refinery Products

    • Contracted by 0.5%.

    [2015] In the ‘Index of Eight Core Industries’, which one of the following is given the highest weight?

    (a) Coal Production

    (b) Electricity generation

    (c) Fertilizer production

    (d) Steel production

  • [16th May 2026] The Hindu OpED: Productivity, and not just growth, for Viksit Bharat

    PYQ Relevance[UPSC 2023] Faster economic growth requires increased share of the manufacturing sector in GDP, particularly of MSMEs. Comment on the present policies of the Government in this regard.Linkage: Tests understanding of manufacturing-led growth, productivity enhancement, MSMEs, industrial policy, and employment generation. India’s growth cannot sustain without productive manufacturing expansion and scalable firms, highlighting the “missing middle” problem.

    Mentor’s Comment

    The debate on India’s growth model has gained significance as the Economic Survey 2025-26 places manufacturing at the centre of India’s next development phase. This signals a shift from growth-led optimism to productivity-led structural reform. This marks a contrast with the post-pandemic period, where India relied heavily on strong domestic demand, macroeconomic stability, and services-led growth. The issue is significant because despite being among the fastest-growing major economies, India continues to face manufacturing inefficiencies, labour concentration in low-productivity agriculture, and rising firm-level distress.

    Why is economic growth alone insufficient for achieving Viksit Bharat?

    1. Macroeconomic Stability: India maintained relatively high growth with subdued inflation, gradual fiscal consolidation, and a stable financial sector, ensuring post-pandemic resilience.
    2. Growth Limitation: Sustained long-term growth requires higher productivity in labour, capital, and production systems, not merely aggregate GDP expansion.
    3. Structural Reform Requirement: Transition to Viksit Bharat demands activation of all growth engines through institutional reforms, efficient resource allocation, and productivity enhancement.
    4. Productivity Imperative: Growth without productivity gains risks declining competitiveness, weak income expansion, and stagnation in employment generation.

    Why has manufacturing failed to become the bridge for structural transformation in India?

    1. Manufacturing Deficit: India’s structural transformation remains skewed as services expanded rapidly without proportional manufacturing deepening, limiting labour absorption.
    2. Employment Challenge: Manufacturing failed to absorb surplus labour from agriculture at scale, unlike successful East Asian industrialisation experiences.
    3. Low Productivity Concern: Manufacturing productivity remains below potential despite infrastructure expansion and policy support.
    4. Economic Survey Observation: The Economic Survey 2025-26 identifies manufacturing as central to sustaining growth and employment generation, particularly for large-scale workforce absorption.
    5. Structural Instability: Overdependence on services weakens long-term resilience because services alone cannot generate broad-based productivity gains across the economy.

    How does India’s firm structure constrain productivity growth?

    1. Fragmented Enterprise Base: India’s manufacturing ecosystem consists of large numbers of small, low-productivity firms and relatively few scalable medium-sized enterprises.
    2. Missing Middle Problem: Weak emergence of medium and large firms contrasts sharply with East Asian economies, where industrial growth was driven by competitive export-oriented firms.
    3. Scaling Constraint: Regulatory complexity, labour rigidities, and financing barriers prevent efficient firms from expanding.
    4. Efficiency Loss: Weak firm dynamism restricts efficient factor allocation and slows productivity improvement.
    5. Labour Misallocation: A substantial workforce remains in low-productivity agriculture, reducing economy-wide productivity growth.

    How do zombie firms undermine economic efficiency and productivity?

    1. Zombie Firms: Economically unviable firms continue operations despite weak fundamentals, preventing efficient reallocation of labour and capital.
    2. Creative Destruction Failure: Productivity growth weakens when newer productive firms fail to replace inefficient firms.
    3. Capital Lock-in: Zombie firms absorb disproportionate shares of debt and assets, reducing credit availability for productive enterprises.
    4. Research Evidence: The paper “Zombie Firms in Emerging Markets: Survival and Funding Mechanisms” (2025) highlights that zombie firms account for a relatively small share of firms but disproportionately hold larger shares of debt and assets.
    5. Financial Distress Persistence: Deterioration begins before firms become classified as zombies, and bank-financed firms remain distressed longer and relapse more often.
    6. Equity Financing Advantage: Equity-financed firms display relatively greater resilience and sustainable recovery.

    Why is inefficient financial intermediation emerging as a structural challenge?

    1. Credit Misallocation: Financial systems often sustain inefficient firms instead of facilitating market exit.
    2. Institutional Weakness: Weak insolvency resolution and delayed restructuring reduce productivity-enhancing capital movement.
    3. Crowding-Out Effect: Lending to distressed firms restricts credit access for innovative and productive firms.
    4. Regulatory Constraint: Slow business exit mechanisms weaken industrial competitiveness and productivity growth.

    What manufacturing-led strategy is required for Viksit Bharat?

    1. Scale Expansion: India requires deeper manufacturing expansion capable of generating employment and productivity simultaneously.
    2. Global Value Chains (GVCs): Stronger integration into global production networks ensures export competitiveness and industrial upgrading.
    3. Trade Barrier Rationalisation: Lower frictions strengthen competitiveness and facilitate participation in global manufacturing systems.
    4. Infrastructure Efficiency: Continued infrastructure investment must focus on efficiency gains, not only physical expansion.
    5. Business Dynamism: Productive firms require easier growth conditions, while inefficient firms require smoother exit mechanisms.
    6. Regulatory Simplification: Reduced compliance burdens facilitate industrial scaling and formalisation.
    7. Credit Access: Better financial allocation strengthens investment in productive sectors.
    8. Research and Development: Innovation capacity improves productivity and technological competitiveness.

    How can productivity become the foundation of India’s long-term development model?

    1. Factor Productivity: Higher efficiency in labour and capital utilisation ensures sustainable growth.
    2. Structural Transformation: Labour movement from low-productivity agriculture to higher-productivity manufacturing and services strengthens income generation.
    3. Competitive Industrialisation: Manufacturing productivity enhances exports, wages, and employment resilience.
    4. Institutional Reform: Efficient insolvency systems, financial reforms, and business facilitation strengthen long-term competitiveness.
    5. Viksit Bharat Goal: Growth provides momentum, but productivity determines whether India can sustain high-income transition by 2047.

    Conclusion

    India’s post-pandemic growth performance provides a strong foundation for Viksit Bharat. However, the next phase of development depends on whether growth translates into higher productivity, competitive manufacturing, efficient resource allocation, and stronger business dynamism. Sustained prosperity will require India to move beyond GDP expansion toward a productivity-led development model rooted in structural reforms and industrial competitiveness.

  • How tax relief on bond investments will help FPIs

    Why in the News?

    India is reportedly considering reducing the withholding tax on foreign portfolio investors (FPIs) investing in bonds from nearly 20% to the earlier concessional 5% rate. The move comes amid external vulnerabilities, especially rising crude oil prices, pressure on the current account deficit (CAD), and global uncertainty.

    How do bonds function as a financial instrument?

    1. Bond: A bond is a fixed-income financial instrument through which governments or companies borrow money from investors for a fixed period at a predetermined interest rate.
    2. Issuer-Investor Relationship: The bond issuer receives capital upfront, while the investor receives periodic interest payments (coupon) and repayment of principal at maturity.
    3. Government Securities (G-Secs): Bonds issued by the government to finance fiscal expenditure and public borrowing requirements.
    4. Corporate Bonds: Bonds issued by companies to raise funds for business expansion, infrastructure, or debt refinancing.
    5. Fixed Returns: Bonds generally provide relatively predictable returns compared to equities because they carry fixed interest obligations.

    What is meant by bond investment?

    1. Debt Investment: Bond investment refers to investing money in debt instruments in return for regular interest income and capital repayment at maturity.
    2. Interest Income: Investors earn periodic returns through coupon payments.
    3. Capital Appreciation: Bond prices may rise if interest rates decline, allowing investors to sell at higher prices.
    4. Portfolio Diversification: Institutional investors use bonds to reduce volatility and balance high-risk equity exposure.
    5. Sovereign Debt Market: In India, foreign investors primarily invest in government securities and rupee-denominated bonds.

    How do external sector pressures increase the need for foreign capital inflows?

    1. Current Account Vulnerability: Rising crude oil prices increase India’s import bill and widen the current account deficit, creating pressure on the external account.
    2. Forex Reserve Stability: Higher FPI inflows into debt markets strengthen foreign exchange reserves and improve India’s ability to manage external shocks.
    3. Capital Flow Requirement: Foreign debt inflows provide non-inflationary financing and reduce pressure on domestic borrowing requirements.
    4. Global Uncertainty: Volatile global financial conditions require India to maintain attractive investment conditions to sustain capital inflows.

    How does high withholding tax reduce India’s attractiveness for global bond investors?

    1. Tax Burden: Withholding tax directly reduces post-tax returns because it is deducted at source before income reaches foreign investors.
      1. Withholding Tax (WHT): Tax deducted at source on payments such as interest, dividends, royalties, and fees before remittance to recipients. Its purpose is to ensure upfront tax collection and reduce evasion.
    2. Relative Disadvantage: India’s withholding tax reverted to nearly 20% after July 2023, making India a relatively high-tax jurisdiction for global bond investors.
    3. Transaction Costs: Higher taxes reduce risk-adjusted returns and increase the effective cost of investing in Indian debt markets.
    4. Regulatory Frictions: Complex tax claims under Double Taxation Avoidance Agreements (DTAAs) increase compliance costs for FPIs.
    5. Liquidity Constraints: Tax deductions lock investor capital temporarily until refunds or tax credits are processed.

    What was India’s earlier concessional withholding tax regime?

    1. Policy Shift in 2012: India introduced a concessional 5% withholding tax in 2012 on interest earned by foreign investors from government securities and specified rupee-denominated bonds under Section 194LD of the Income Tax Act.
    2. Investment Incentive: The concessional regime ensured better post-tax returns and improved India’s attractiveness to global investors.
    3. Expiry of Regime: The concessional tax structure expired in July 2023, after which taxation reverted to approximately 20%.
    4. Policy Reconsideration: The government is now evaluating a restoration of lower rates to revive overseas debt inflows.

    How do international tax structures shape global capital allocation?

    1. Comparative Taxation: Global investors allocate capital by comparing post-tax yields across jurisdictions.
    2. United States: Imposes approximately 30% withholding tax on foreign investors.
    3. Germany: Imposes nearly 26.4% withholding tax.
    4. France: Applies nearly 25% withholding tax.
    5. China: Maintains roughly 10% withholding tax.
    6. Hong Kong and Singapore: Do not impose withholding tax on foreign bond investors, increasing market competitiveness.
    7. Tax Competitiveness: Jurisdictions with lower tax burdens attract larger foreign debt participation.

    How important are FPIs for India’s bond market?

    The RBI defines FPI as any investment made by a non-resident entity in transferable financial assets (such as equity shares, corporate bonds, government securities, or mutual funds) without seeking operational or management control over the underlying company. An FPI can hold a maximum of less than 10% of the total paid-up equity capital of a single listed Indian company.

    1. Debt Market Participation: FPIs hold a relatively small share of India’s government debt market but their exposure is increasing.
    2. Global Bond Index Inclusion: India’s inclusion in the JPMorgan Government Bond Index-Emerging Markets (GBI-EM) has increased investor interest in Indian sovereign debt.
    3. Investment Cap: The Reserve Bank of India (RBI) permits FPI investment up to 6% of outstanding government securities stock.
    4. Sharp Rise in Investments: FPI investment in dated government securities increased from $30.6 billion (March 2024) to $43.2 billion (March 2025).

    What are the possible macroeconomic gains from lowering withholding tax?

    1. Higher Capital Inflows: Improves overseas participation in Indian debt markets.
    2. Exchange Rate Stability: Supports rupee stability by improving foreign exchange availability.
    3. Borrowing Cost Efficiency: Larger investor participation can lower sovereign borrowing costs.
    4. Bond Market Deepening: Strengthens liquidity and improves depth of India’s debt market.
    5. Global Financial Integration: Facilitates smoother integration with international capital markets after bond index inclusion.

    What concerns may arise from excessive dependence on FPI debt flows?

    1. Capital Flight Risk: Portfolio investments remain sensitive to global interest rates and geopolitical uncertainty.
    2. External Vulnerability: Sudden reversals can weaken the rupee and intensify external sector stress.
    3. Tax Revenue Trade-off: Lower withholding tax may reduce short-term tax collections.
    4. Market Volatility: Excessive foreign participation may amplify bond yield fluctuations.

    Conclusion

    Reducing withholding tax on bond investments can strengthen India’s attractiveness as a debt investment destination at a time of external uncertainty and rising financing requirements. However, durable gains require balancing tax competitiveness with macroeconomic stability, prudent capital flow management, and deeper domestic bond market reforms.

    PYQ Relevance

    [UPSC 2018] How would the recent phenomena of protectionism and currency manipulations in world trade affect macroeconomic stability of India?

    Linkage: The PYQ tests understanding of external sector stability, capital flows, exchange rate management, and macroeconomic resilience in a globalised economy. Higher bond inflows can improve forex reserves, rupee stability, and financing of the current account deficit, directly affecting macroeconomic stability.

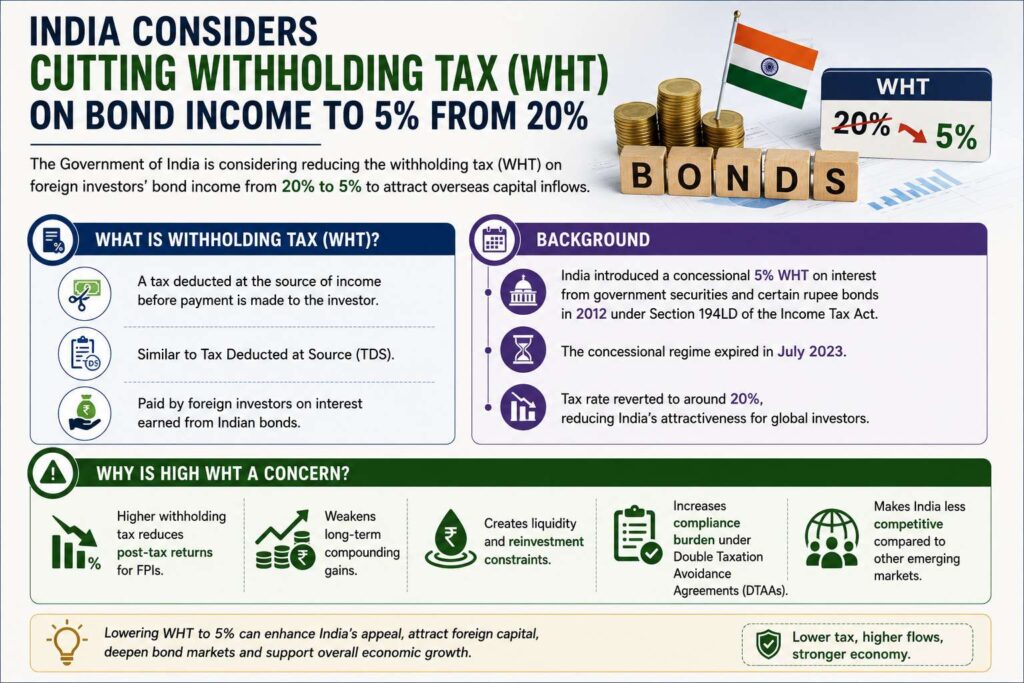
  • Tax Relief on Bond Investments and FPIs

    Why in the News?

    The Government of India is considering reducing the withholding tax (WHT) on foreign investors’ bond income from 20% to 5% to attract overseas capital inflows.

    What is Withholding Tax (WHT)?

    • A tax deducted at the source of income before payment is made to the investor.
    • Similar to Tax Deducted at Source (TDS).
    • Paid by foreign investors on interest earned from Indian bonds.

    Background

    • India introduced a concessional 5% WHT on interest from government securities and certain rupee bonds in 2012 under Section 194LD of the Income Tax Act.
    • The concessional regime expired in July 2023.
    • Tax rate reverted to around 20%, reducing India’s attractiveness for global investors.

    Why is High WHT a Concern?

    Higher withholding tax:

    • Reduces post-tax returns for FPIs.
    • Weakens long-term compounding gains.
    • Creates liquidity and reinvestment constraints.
    • Increases compliance burden under Double Taxation Avoidance Agreements (DTAAs).

    How Will Tax Reduction Help FPIs?

    • Improve effective yields on Indian bonds.
    • Increase attractiveness of Indian debt markets.
    • Encourage foreign capital inflows.
    • Support forex reserves and external stability.

    Global Comparison

    • Countries imposing WHT on foreign investors:
      • United States: 30%
      • Germany: 26.4%
      • France: 25%
      • China: 10%
    • No WHT: Hong Kong and Singapore

    FPIs in India’s Debt Market

    • FPIs hold a limited share of India’s government debt market.
    • Investments increased after inclusion in global bond indices such as:
      • JPMorgan Government Bond Index-Emerging Market
    • RBI cap on FPI investment in government securities:
      • 6% of outstanding stock
    [2019] Which of the following is issued by registered foreign portfolio investors to overseas investors who want to be part of the Indian stock market without registering themselves directly? 
    (a) Certificate of Deposit 
    (b) Commercial Paper 
    (c) Promissory Note 
    (d) Participatory Note