💥Join UPSC 2027,2028 Mentorship (July Batch) + XFactor Notes & Microthemes PDF

GS Paper: GS3-13.Infrastructure: Energy, Ports, Roads, Airports, Railways etc:

  • Centre Directs Refiners to Maximise LPG Production

    Why in the News

    The Government of India invoked the Essential Commodities Act, 1955 to direct oil refiners to maximise production of Liquefied Petroleum Gas (LPG) and prioritise domestic cooking gas supply amid disruptions in global energy supply chains.

    About Essential Commodities Act, 1955 (ECA)The Essential Commodities Act, 1955 (ECA) is a law enacted by the Government of India to ensure the availability of essential goods to consumers at fair prices and prevent hoarding, black marketing, and artificial scarcity.Amendment and Reforms (2020)In 2020, the government introduced reforms to liberalise agricultural markets.Key changes:Cereals, pulses, oilseeds, edible oils, onions, and potatoes were removed from the list of essential commodities under normal circumstances.Stock limits can be imposed only under extraordinary situations such as: War, Famine, and Extraordinary price rise.

    Key Government Directive

    • All oil refining companies must use propane and butane streams primarily for LPG production.
    • Refiners are not allowed to divert propane or butane for:
      • Petrochemical products
      • Other downstream industrial uses.
    • LPG produced must be supplied to public sector oil marketing companies.

    Major public sector oil marketing companies include:

    • Indian Oil Corporation Limited
    • Bharat Petroleum Corporation Limited
    • Hindustan Petroleum Corporation Limited
    • These companies will distribute LPG only to domestic consumers.
    [2010] Consider the following statements: The Union Government fixes the Statutory Minimum Price of sugarcane for each sugar season. Sugar and sugarcane are essential commodities under the Essential Commodities Act. Which of the statements given above is/are correct? (a) 1 only  (b) 2 only  (c) Both 1 and 2  (d) Neither 1 nor 2
  • [24th february 2026] The Hindu OpED: India’s energy shift through the green ammonia route

    PYQ Relevance

    [UPSC 2022] Do you think India will meet 50 percent of its energy needs from renewable energy by 2030? Justify your answer. How will the shift of subsidies from fossil fuels to renewables help achieve the above objective?

    Linkage: Green ammonia auctions operationalise renewable energy targets through industrial decarbonisation. The subsidy shift logic mirrors SIGHT incentives and viability gap funding for green hydrogen.

    Mentor’s Comment

    India’s green hydrogen strategy has entered an implementation phase through competitive green ammonia auctions. The Solar Energy Corporation of India (SECI) has operationalised aggregated demand under the National Green Hydrogen Mission, securing long-term offtake contracts at prices nearly 40-50% lower than earlier global benchmarks. The development signals a structural shift from policy intent to market creation and positions India as a price-setter in emerging clean fuel markets.

    Why in the News?

    At India Energy Week 2026, the government operationalised its clean energy vision through SECI’s large-scale green ammonia auctions under the SIGHT programme, offering 10-year fixed-price contracts. 

    What is Green Ammonia?

      1. Green ammonia is a 100% renewable, carbon-free fertilizer and energy carrier produced by combining nitrogen from the air with green hydrogen (generated via water electrolysis using solar or wind energy). 
      2. Unlike traditional “grey” ammonia that uses fossil fuels, green ammonia emits zero, offering a sustainable solution for agriculture, energy storage, and marine fuel.
    • Production: Water is split into hydrogen and oxygen using renewable electricity. This green hydrogen is then combined with nitrogen using the Haber-Bosch process to produce ammonia.

    What is the SECI Green Ammonia Auction Model?

    The SECI Green Ammonia Auction Model, under the National Green Hydrogen Mission’s SIGHT Scheme (Mode 2A), is a competitive, cost-based e-reverse auction for procuring green ammonia. It is designed to bridge the price gap with conventional ammonia. It features a 10-year, fixed-price contract, with SECI acting as an intermediary to facilitate demand, resulting in record-low prices around ₹55.75/kg as of mid-2025

    Key Features of the SECI Green Ammonia Model:

    1. SIGHT Scheme Mode 2A: The auction is part of the Strategic Interventions for Green Hydrogen Transition (SIGHT) scheme, which provides financial incentives for producing and supplying green ammonia, implemented by SECI.
    2. Intermediary Procurement Model: SECI acts as an intermediary, bidding for and procuring green ammonia from producers and supplying it to fertilizer companies, addressing the “chicken-and-egg” demand-supply challenge.
    3. Competitive Bidding & Reverse Auction: The process involves e-bidding followed by an e-reverse auction to ensure the most competitive, market-driven pricing.
    4. Long-Term Contracts: Green Ammonia Purchase Agreements (GAPA) are signed for a period of 10 years, providing certainty to developers and investors.
    5. Payment Security Mechanism: A robust, built-in payment security mechanism ensures the financial viability of projects and reassures stakeholders.
    6. Aggregated Demand: The model aggregates demand for green ammonia, with planned auctions covering a cumulative capacity of over 7 lakh MT per annum, promoting economies of scale.
    7. Record-Low Pricing: The first auction in 2025 achieved a significant breakthrough, with prices dropping to roughly ₹55.75/kg, making green ammonia increasingly competitive with traditional, gray ammonia.

    How Does the Green Ammonia Auction Model Reflect a Governance Shift from Subsidy to Market Creation?

    1. Aggregated Demand Mechanism: SECI pooled demand of up to 7,24,000 tonnes annually across 13 fertiliser plants, reducing fragmented procurement and enhancing scale efficiency.

    2. Long-term Offtake Contracts: Provides 10-year fixed-price agreements, ensuring revenue certainty and reducing investor risk.
    3. Competitive Bidding Framework: Attracted 15 bidders, with 7 successful awardees, strengthening transparency and price discovery.
    4. Production Subsidy Support: Includes viability gap support of ₹8.82/kg, ₹7.06/kg, and ₹5.3/kg over three years under SIGHT.
    5. Outcome: Establishes a cost-competitive domestic green ammonia market.

    How Does India’s Price Discovery Compare with Global Benchmarks and What Does it Indicate?

    1. Price Range Achieved: ₹49.75-₹64.74/kg ($572-$744/tonne).
    2. Global Benchmark Comparison: Nearly 40-50% lower than H2Global auction prices.
    3. Grey Ammonia Benchmark: Grey ammonia prices reach $515/tonne, narrowing cost gap significantly.
    4. Cost Gap Reduction: Long-term contracts and subsidies reduce transition risks.
    5. Outcome: Positions India as a potential global price influencer in green fuels.

    How Does the Policy Strengthen Energy Security and Reduce Import Vulnerability?

    1. Import Substitution: Contracted volume equals nearly 30% of India’s ammonia imports.
    2. Price Predictability: Fixed-price contracts reduce exposure to global volatility, currency risks, and geopolitical disruptions.
    3. Domestic Value Chain Creation: Integrates renewable energy, storage, hydrogen electrolysis, and ammonia synthesis.
    4. Energy Independence Objective: Aligns with India’s shift from energy security to energy independence.
    5. Outcome: Enhances strategic autonomy in fertiliser and energy sectors.

    What Institutional and Regulatory Innovations Support Market Viability?

    1. Pre-identified Delivery Points: Located near coastal fertiliser plants, enabling maritime logistics and reducing transportation bottlenecks.
    2. Banking and Grid Regulations: Requires harmonised regulations for renewable integration.
    3. Certification Alignment: Necessitates globally accepted green hydrogen certification frameworks.
    4. Risk Mitigation Mechanisms: Long-tenor blended finance and extended offtake agreements enhance bankability.
    5. Outcome: Strengthens institutional accountability and reduces implementation risks.

    How Does Green Ammonia Contribute to India’s Decarbonisation Commitments?

    1. Industrial Decarbonisation: Supports fertiliser sector transition from grey to green ammonia.
    2. Hard-to-Abate Sectors: Enables decarbonisation in shipping, power generation, and heavy industry.
    3. Renewable Integration: Utilises low-cost renewable energy at scale.
    4. National Green Hydrogen Mission Alignment: Operationalises Mission targets through market instruments.
    5. Outcome: Advances India’s Nationally Determined Contributions (NDCs).

    What Implementation Risks Could Affect Long-Term Sustainability?

    1. Financial Risk: High capital intensity of electrolysers and renewable infrastructure.
    2. Technology Risk: Need for hybrid renewable-storage integration.
    3. Regulatory Uncertainty: Grid access, incentives, and safety standards require stability.
    4. Global Competition: Emerging green ammonia producers may affect export competitiveness.
    5. Outcome: Sustained coordination between policymakers, developers, and financiers remains essential.
  • Textile Mills Closure in Tamil Nadu 

    Why in the news? 

    As per the Annual Survey of Industries data released by the Union Ministry of Textiles, over 300 textile mills in Tamil Nadu went out of operation between 2021 to 22 and 2023 to 24.

    Key Data

    • 2021 to 22
      • Total mills: 2,773
      • Operational: 2,121
    • 2023 to 24
      • Total mills: 2,455
      • Operational: 1,672
    • Nearly 2 lakh powerlooms reportedly shut in the last few years.
    • Majority units fall under MSME segment.

    Major Reasons for Closures

    • High Power Cost

      • Electricity tariff around ₹9.25 per unit
      • Higher than competing States
      • Units with wind and solar investments survived relatively better
    • Raw Material Issues

      • Cotton, polyester, viscose sourced largely from northern India
      • High transportation cost
      • Earlier import duty on cotton impacted mills
      • Quality Control Orders created compliance burden
    • Environmental Compliance

      • Mandatory Zero Liquid Discharge norms for processing units
      • Higher compliance cost compared to States permitting marine discharge
    • Financial Stress

      • Higher bank interest rates
      • Limited subsidy coverage
      • MSMEs more vulnerable
    [2010] Tamil Nadu is a leading producer of mill-made cotton yarn in the country. What could be the reason? 1. Black cotton soil is the predominant type of soil in the State. 

    2. Rich pool of skilled labour is available. 

    Which of the above is/are the correct reasons? 

    (a) 1 only  (b) 2 only  (c) Both 1 and 2  (d) Neither 1 nor 2

  • India’s First Private Helicopter Assembly Line at Vemagal

    Why in the News?

    India’s first private sector helicopter Final Assembly Line was inaugurated at Vemagal, Kolar district, Karnataka to manufacture Airbus H125 helicopters through a partnership between Tata Advanced Systems and Airbus.

    Key Entities Involved

    • Tata Advanced Systems Limited
    • Airbus
    • France
    • Hindustan Aeronautics Limited

    About the Facility

    • Location: Vemagal, Kolar district, Karnataka
    • Type: Private sector Final Assembly Line
    • Product: Airbus H125 single engine helicopter
    • Initial annual capacity: 10 helicopters
    • First delivery expected: Early 2027
    • Will serve Indian and South Asian markets

    This becomes the fourth global production site for the H125 after France, USA and Brazil.

    About H125 Helicopter

    • One of the world’s best selling single engine helicopters
    • Over 4,300 units flying globally
    • Certified under European Union Aviation Safety Agency standards
    • Designed for high altitude and rugged terrain operations

    Military Variant

    • H125M version proposed
    • Seen as a successor to Cheetah and Chetak helicopters
    • Suitable for:
      • Tactical reconnaissance
      • High altitude logistics
      • Search and rescue
      • Medical evacuation
    [2024] Consider the following aircraft: 

    1. Rafael 

    2. MiG-29 

    3. Tejas MK-1 

    How many of the above are considered fifth generation fighter aircraft? 

    (a) Only one (b) Only two (c) All three (d) None

  • The cost of controls on the fertiliser industry

    Why in the News?

    The Uttar Pradesh government has prohibited urea manufacturers and suppliers from selling “gair-anudaanit” (non-subsidised) fertilisers in the state. The order affects cooperative, public, and private firms.

    The action follows allegations of “tagging,” wherein farmers were allegedly compelled to purchase non-subsidised products along with subsidised fertilisers. However, the non-subsidised segment constitutes only 0.4 million tonnes annually, compared to India’s 67 million tonnes total fertiliser market, making the regulatory response appear disproportionate in scale.

    What is the Structure of the Fertiliser Industry in India

    1. High Regulatory Intensity: One of the most regulated industries in India.
    2. Core Products: Urea, Di-Ammonium Phosphate (DAP), Muriate of Potash (MOP), NPK complexes.
    3. Statutory Framework: Governed under Fertiliser Control Order (FCO), 1985.
    4. Administered Pricing: Urea MRP fixed at same level since November 2012.
    5. Subsidy Regime: P&K fertilisers operate under Nutrient-Based Subsidy (NBS) with capped retail pricing.
    6. Decontrol Paradox: Though labelled “decontrolled,” effective price and profit oversight continues through subsidy-linked conditions.

    How has fertiliser consumption and import dependence evolved?

    1. Rising Consumption: Total consumption increased significantly over recent years, reaching 67 million tonnes (2024-25).
    2. Urea Dominance: Urea consumption significantly exceeds P&K usage due to lower administered prices.
    3. Import Dependence: High import reliance for phosphatic and potassic fertilisers increases vulnerability to global price volatility.
    4. Price Differential: DAP priced at ₹27/kg and MOP at ₹19.40/kg under subsidy regime; non-subsidised variants priced substantially higher.
    5. Nutrient Imbalance: Excessive nitrogen usage distorts soil health due to price asymmetry.

    How does the fertiliser price control regime operate under the Fertiliser Control Order (FCO), 1985?

    1. Statutory Control: Operates under the Fertiliser Control Order, 1985 issued under the Essential Commodities Act framework.
    2. Administered Pricing: Fixes Maximum Retail Price (MRP) of urea at ₹266.5 per 45 kg bag.
    3. Subsidy Mechanism: Compensates manufacturers for cost-production gap through Direct Benefit Transfer (DBT) to companies.
    4. Input Regulation: Controls MRP of urea; phosphatic and potassic (P&K) fertilisers operate under Nutrient-Based Subsidy (NBS) scheme.
    5. Movement Control: Allocates fertiliser supply across states based on assessed demand.

    Is the fertiliser sector truly decontrolled, or does effective government control persist?

    The fertilizer sector operates under the Fertiliser Control Order, 1985 issued under the Essential Commodities Act framework.

    1. Profit Oversight: Department of Fertilisers can recover subsidy if “unreasonable profit” is detected.
    2. Conditional Decontrol: Companies cannot freely price products without risking subsidy clawback.
    3. Operational Dependence: Business viability tied to state reimbursement mechanisms.

    How does state control extend beyond pricing into movement and distribution?

    1. Agreed Supply Plan: Department of Fertilisers prepares state-wise, season-wise, month-wise allocation.
    2. Railway Rake Planning: Dispatches governed by official rail and road movement schedules.
    3. District Allocation: Agriculture officers allocate fertiliser dealer-wise upon arrival.
    4. FOR Basis Delivery: Companies must supply on freight-on-road basis.
    5. Limited Commercial Autonomy: Private firms cannot independently determine timing, quantity, or geography of sales.

    Does price control ensure equity or generate inefficiency in fertiliser distribution?

    1. Affordability Objective: Ensures low input costs for farmers, supporting food security.
    2. Fiscal Burden: Expands fertiliser subsidy bill significantly; recurrent pressure on Union Budget.
    3. Inefficient Usage: Encourages overuse of subsidised urea due to artificially low prices.
    4. Leakages and Diversion: Facilitates diversion for industrial use or cross-border smuggling.
    5. Soil Degradation: Skews NPK ratio, affecting long-term soil productivity.

    What economic role do non-subsidised fertilisers play in the industry’s survival model?

    1. Cross-Subsidisation Mechanism: Higher margins from speciality nutrients offset thin margins from urea.
    2. Capital Recovery: Supports working capital cycles in a subsidy-dependent system.
    3. Innovation Incentive: Enables R&D in micronutrients and water-soluble fertilisers.
    4. Market Size Contrast: 0.4 million tonnes speciality vs 67 million tonnes total market.
    5. Profitability Cushion: Provides financial flexibility under price-capped regime.

    What governance concerns arise from restrictions on non-subsidised fertiliser sales?

    1. Market Distortion: Restricting non-subsidised fertiliser sales limits firms’ ability to offset losses from controlled urea pricing.
    2. Investment Sentiment: Reduces profitability of a ₹13,000 crore segment, affecting private sector participation.
    3. Regulatory Overreach: State-level intervention in areas traditionally governed by central FCO raises federal coordination concerns.
    4. Cross-subsidisation Constraint: Prevents companies from leveraging higher-margin non-subsidised products.
    5. Policy Uncertainty: Sudden bans create unpredictability in regulatory environment.

    Does price asymmetry distort nutrient usage and environmental sustainability?

    1. Price Signal Distortion: Urea at ₹5.9/kg incentivises excessive nitrogen application.
    2. Nutrient Imbalance: Skews N:P:K ratio in Indian soils.
    3. Soil Health Impact: Degrades soil productivity over time.
    4. High-Value Crop Use: Speciality fertilisers critical for fruits, vegetables, sugarcane.
    5. Environmental Externalities: Overuse contributes to groundwater contamination and emissions.

    What are the governance and federalism implications of the UP ban?

    1. Concurrent Jurisdiction: Fertilisers fall under Entry 33, Concurrent List.
    2. Centre-State Overlap: FCO issued by Centre; implementation often state-driven.
    3. Regulatory Fragmentation: State-specific bans risk policy inconsistency.
    4. Investor Sentiment Impact: Capital-intensive industry requires regulatory predictability.
    5. Unintended Consequence Risk: May enable unorganised low-quality suppliers to fill supply gap.

    Does heavy subsidy dependence raise fiscal sustainability concerns?

    1. Large Subsidy Outlay: Fertiliser subsidy remains a major budgetary commitment.
    2. Fiscal Trade-offs: Crowds out productive expenditure.
    3. Import Dependence: Raw materials such as phosphate rock and potash largely imported.
    4. Global Price Exposure: Vulnerable to external commodity shocks.
    5. Reform Stagnation: Urea decontrol proposals repeatedly deferred.

    Conclusion

    India’s fertiliser sector demonstrates the limits of excessive state control in a market critical to food security. While administered pricing and subsidies ensure affordability, layered controls over pricing, movement, and profitability risk distorting nutrient use, weakening industry viability, and discouraging investment. A calibrated approach that rationalises subsidies, restores balanced price signals, and ensures regulatory predictability is essential to align farmer welfare with long-term agricultural sustainability.

    PYQ Relevance

    [UPSC 2023] What are the direct and indirect subsidies provided to farm sector in India? Discuss the issues raised by the World Trade Organization (WTO) in relation to agricultural subsidies.

    Linkage: This question directly links to India’s fertiliser subsidy regime, price controls, and DBT architecture. It also connects to debates on subsidy distortion, fiscal burden, and compliance with the WTO’s Agreement on Agriculture (AoA), especially concerning input subsidies and trade distortion limits.

  • R&D Roadmap for CCUS Launched to Achieve Net Zero by 2070

    Why in the News?

    The R&D Roadmap to Enable India’s Net Zero Targets through Carbon Capture, Utilization and Storage CCUS was launched on 2 December 2025 by the Department of Science and Technology and unveiled by the Principal Scientific Adviser to the Government of India.

    Context

    • India has committed to achieving Net Zero emissions by 2070.
    • Hard to abate sectors such as Power, Cement and Steel require technological solutions beyond renewables.
    • CCUS is identified as a critical pillar for deep decarbonisation.

    What is CCUS?

    Carbon Capture, Utilization and Storage is a technology that:

    1. Captures carbon dioxide emissions from industrial sources.
    2. Utilizes captured CO₂ for industrial purposes such as chemicals or fuels.
    3. Stores CO₂ underground in geological formations to prevent atmospheric release.

    Key Features of the Roadmap

    1. Strategic guidance on thematic R&D priorities.
    2. Focus on moving technologies from lab scale to commercial readiness.
    3. Support for breakthrough next generation carbon management technologies.
    4. Emphasis on regulatory standards, safety norms and skilled manpower.
    5. Promotion of early shared infrastructure and public private partnerships.

    Institutional Framework

    • Prepared by DST based on nearly seven years of CCUS research support.
    • Guided by a High Level Task Force.
    • Establishment of three National Centres of Excellence in CCUS.
    • Linked with ₹1 lakh crore Research Development and Innovation Scheme to promote private sector led industrial decarbonisation.

    Focus Sectors

    • Thermal power plants, Cement industry, Steel sector and Energy intensive manufacturing. 
    • These sectors contribute significantly to India’s greenhouse gas emissions.
    [2023] Consider the following activities: 

    1. Spreading finely ground basalt rock on farmlands extensively. 

    2. Increasing the alkalinity of oceans by adding lime. 

    3. Capturing carbon dioxide released by various industries and pumping it into abandoned subterranean mines in the form of carbonated waters. 

    How many of the above activities are often considered and discussed for carbon capture and sequestration? 

    (a) Only one (b) Only two (c) All three (d) None

  • What are bio-based chemicals and enzymes

    Why in the News?

    The Biotechnology for Economy, Employment and Environment (BioE3) Policy has prioritised bio-based chemicals and enzymes as strategic sectors. Bio-based chemicals and enzymes use renewable biological feedstocks and reduce dependence on fossil-based industrial inputs. The sector is important for India to cut petrochemical imports (e.g., $479.8 million acetic acid in 2023), strengthen energy security, and support climate goal.

    What are Bio-based chemicals and enzymes?

    1. Bio-based chemicals are industrial chemicals produced using biological feedstocks like sugarcane, corn, starch, or biomass residues, often through fermentation or enzymatic processes. 
    2. Examples include organic acids (such as lactic acid), bio-alcohols, solvents, surfactants, and intermediates used in plastics, cosmetics, and pharmaceuticals. 
    3. Enzymes are biological catalysts widely used in detergents, food processing, pharmaceuticals, textiles, pulp and paper, and increasingly in biomanufacturing. 
    4. Enzymes often work at lower temperatures and pressures, reducing energy use and emissions.

    How Do Bio-based Chemicals Align with India’s Energy Security and Industrial Policy Objectives?

    1. Import Substitution: Reduces dependence on petrochemical imports such as acetic acid valued at $479.8 million in 2023.
    2. Feedstock Utilisation: Leverages agricultural residues, sugarcane, and starch base to create industrial value chains.
    3. Manufacturing Expansion: Strengthens domestic production capacity in sustainable chemicals.
    4. Energy Efficiency: Enables lower temperature and pressure processing, reducing industrial energy consumption.
    5. Strategic Autonomy: Diversifies raw material base beyond fossil fuels.

    How Does the BioE3 Policy Institutionalise Bio-manufacturing as a Governance Priority?

    1. Policy Prioritisation: Places bio-based chemicals and enzymes under the Department of Biotechnology’s BioE3 framework.
    2. Economic Integration: Links biotechnology with employment generation and environmental sustainability.
    3. Sectoral Coordination: Aligns industrial biotechnology with manufacturing sector expansion.
    4. Innovation Ecosystem: Encourages microbial strategy development for chemical production.

    Does India Possess Institutional and Market Capacity to Scale Bio-based Production?

    1. Corporate Leadership: Praj Industries and Godrej Industries lead bio-chemical initiatives.
    2. Refinery Innovation: Godavari Biorefineries produces acetyls and intermediates such as acetic anhydride (ethyl acetate).
    3. Enzyme Market Consolidation: Top players account for over 75% market share.
    4. Key Industry Actors: Novozymes India, DuPont, DSM, Advanced Enzyme Technologies, BASF SE, and Ultreze Enzymes Private Limited operate in India.
    5. Fermentation Expertise: Strong pharmaceutical and vaccine manufacturing base supports scaling.

    What Governance and Regulatory Challenges Constrain Sectoral Expansion?

    1. Capital Intensity: Bio-refineries require high initial investment.
    2. Feedstock Volatility: Agricultural raw material supply fluctuates seasonally.
    3. Technology Dependence: Advanced microbial engineering still requires global collaboration.
    4. Regulatory Clearances: Multi-layer approvals delay commercial scaling.
    5. Market Competitiveness: Petrochemical alternatives remain cost-competitive due to legacy infrastructure.

    How Does Global Policy Context Shape India’s Strategic Choices?

    1. EU Bioeconomy Strategy: Integrates bio-based chemicals into circular economy and climate transformation goals.
    2. USDA BioPreferred Program: Mandates federal procurement preference for bio-based products.
    3. Climate Alignment: Links industrial decarbonisation with bio-manufacturing.
    4. Waste Reduction: Encourages conversion of biomass residues into chemicals.
    5. Global Competition: Positions bio-based chemicals as emerging industrial frontier.

    Conclusion

    Bio-based chemicals and enzymes integrate industrial growth with environmental sustainability. India’s agricultural base, fermentation expertise, and BioE3 policy provide structural advantage. Scaling requires regulatory reform, technology deepening, and feedstock security. The sector offers scope for import substitution, green growth, and strategic industrial positioning.

    PYQ Relevance

    [UPSC 2023] Discuss several ways in which microorganisms can help in meeting the current fuel shortage.

    Linkage: This PYQ tests understanding of industrial biotechnology in addressing energy security and reducing fossil fuel dependence under GS 3. Bio-based chemicals and enzymes similarly use microbial processes to enable green manufacturing and reduce petrochemical imports.

  • India’s Power Generation Capacity Update

    Why in the News?

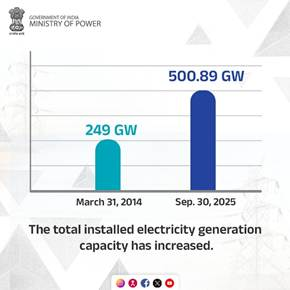
    India has added 52,537 MW of electricity generation capacity in the current financial year up to January 31, 2026. This is the highest ever annual capacity addition, taking total installed capacity to 5,20,510.95 MW.

    Key Data

    1. Total capacity addition (FY 2025-26 till Jan 31): 52,537 MW
    2. Previous record: 34,054 MW in FY 2024-25
    3. Total installed capacity (Jan 31, 2026): 5,20,510.95 MW
    4. Growth over last FY: More than 11 percent increase

    Breakup of Installed Capacity

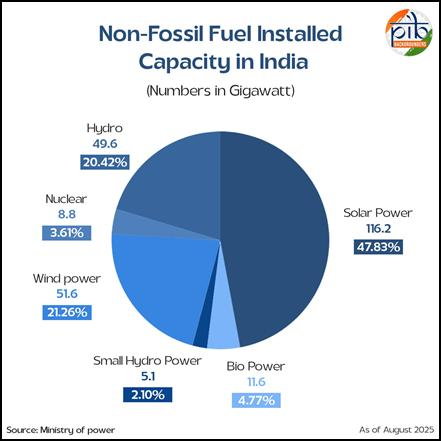
    1. Renewable Energy:
      • 2,63,189.33 MW
      • Around 50.5 percent of total capacity
      • Solar: 34,955 MW added this year
      • Wind: 4,613 MW added
    2. Fossil Fuel Based:
      • 2,48,541.62 MW
      • Around 48 percent of total
    3. Nuclear Energy:
      • 8,780 MW
      • Around 1.6 percent

    Important Concepts for Prelims

    • Installed Capacity: Maximum electricity that can be generated under ideal conditions.
    • Renewable Energy Sources: Solar, wind, hydro, biomass etc.
    • Energy Mix: Composition of different energy sources in total generation capacity.

    Significance

    • India’s renewable share has crossed 50 percent of installed capacity.
    • Indicates progress toward climate commitments and energy transition goals.
    • Strengthens energy security and reduces fossil fuel dependence in long term.
    [2025] Consider the following statements about ‘PM Surya Ghar Muft Bijli Yojana’: I. It targets installation of one crore solar rooftop panels in the residential sector. 

    II. The Ministry of New and Renewable Energy aims to impart training on installation, operation, maintenance and repairs of solar rooftop systems at grassroot levels. 

    III. It aims to create more than three lakhs skilled manpower through fresh skilling and up-skilling, under scheme component of capacity building. 

    Which of the statements given above are correct? 

    (a) I and II only (b) I and III only (c) II and III only (d) I, II and III

  • Carbon Capture to Drive India’s Green Steel Transition

    Why in the News

    The Prime Minister shared an article highlighting the role of Carbon Capture, Utilisation and Storage in decarbonising India’s steel sector, aligning with India’s Net Zero 2070 commitment.

    India’s Steel Sector at a Glance

    • India is the world’s second largest crude steel producer.
    • Production: Around 152 million tonnes in FY 2024-25.
    • Target under National Steel Policy 2017:
      • 300 million tonnes by 2030-31
      • 500 million tonnes by 2047

    Note: Steel production contributes nearly 10 to 12 percent of India’s total greenhouse gas emissions due to coal based blast furnace and direct reduced iron routes.

    What is CCUS

    Carbon Capture, Utilisation and Storage involves:

    • Capturing carbon dioxide from industrial processes
    • Utilising it for industrial applications or
    • Storing it underground to prevent atmospheric release

    It helps address process emissions that cannot be eliminated through energy efficiency or renewable power alone.

    Government Measures

    • Green Steel Taxonomy:Defines emission intensity benchmark: Less than 2.2 tonnes of CO2 equivalent per tonne of finished steel
      • Introduces star rating framework
    • National Green Hydrogen Mission: ₹455 crore allocated for pilot projects in steel sector
    • Union Budget Allocation: ₹20,000 crore for piloting CCUS across five sectors including steel

    Significance

    • Helps decarbonise existing steel plants without immediate asset replacement
    • Enhances global competitiveness amid carbon border measures
    • Supports Net Zero 2070 target
    • Encourages industrial ecosystems around carbon transport and storage
    [2023] Consider the following heavy industries: 1. Fertilizer plants 

    2. Oil refineries 

    3. Steel plants 

    Green hydrogen is expected to play a significant role in decarbonizing how many of the above industries? 

    (a) Only one (b) Only two (c) All three (d) None

  • A reckoning for India’s aviation sector

    Why in the News?

    India’s aviation sector is under scrutiny following operational failures, rising safety incidents, and declining passenger confidence. This sector is the world’s third-largest domestic aviation market carrying over 350 million passengers annually. The December crisis marked the first large-scale disruption for IndiGo, exposing systemic stress in the country’s largest airline, which controls nearly 60% of the domestic market. Simultaneously, pilot shortages, FDVT violations, high ATF volatility, and congestion at 85+ airports operating beyond capacity have intensified vulnerabilities. The sector faces a structural reckoning as new regional carriers enter an already overstretched ecosystem.

    What is the growth and economic significance of India’s Aviation Sector?

    1. Market Size Expansion: India is the world’s third-largest domestic aviation market, with airports increasing from 74 (2014) to 163 (2025).
    2. Economic Multiplier Effect: Aviation generates over three times economic activity for every rupee invested and supports more than six times employment in allied sectors.
    3. Employment Contribution: The sector supports over 7.7 million jobs, including 369,000 direct jobs.
    4. Traffic Growth: Domestic passenger traffic has grown at an annual rate of 10-12% over the past decade.
    5. Global Integration: India has over 116 bilateral Air Service Agreements, strengthening international connectivity.
    6. Industrial Linkages: Aviation drives FDI inflows, technology transfer, and growth in aircraft manufacturing, MRO, and ground handling services under Make in India.

    Why is India’s aviation sector facing operational stress?

    1. Scale without proportional capacity: Carries 350+ million passengers annually with over 840 aircraft, but expansion has outpaced structural preparedness.
    2. December disruption as stress test: First large-scale disruption affecting IndiGo exposed systemic fragility.
    3. Airport congestion: 85 airports operating beyond capacity; 102 new routes planned under UDAN 2025-26.
    4. Network dependency risk: High route concentration increases vulnerability to cascading delays and cancellations.

    What explains the pilot shortage and regulatory strain?

    1. Pilot-to-aircraft imbalance: India’s ratio remains below global benchmark of 18-20 pilots per aircraft; IndiGo at 14, Air India at 36 (group level including subsidiaries), Air India Express at 15.
    2. FDVT violations: DGCA issued 19 safety violation notices in 2025 citing breaches of flight duty time limitations, lapses in quality assurance, and expired emergency equipment use.
    3. Training pipeline constraints: CPL issuance inconsistent with estimated annual requirement of 7,000 pilots; issuance around 5,700 between 2020-24.
    4. Operational fatigue risks: Regulatory exemptions for scheduling rather than structural hiring reforms.

    How does market concentration amplify systemic risk?

    1. Duopoly structure: IndiGo (63-65%) and Air India group (27%+) together control nearly 90% of the domestic market.
    2. Route concentration: IndiGo dominant on 600 monopoly routes and 200 duopoly routes.
    3. Financial vulnerability: Past airline failures-Jet Airways (2019), Kingfisher Airlines (2012), Air Deccan collapse, Go First (2023-24), demonstrate systemic contagion risk.
    4. Passenger dependency: 60.4% of domestic capacity concentrated under a single carrier.

    How do infrastructure and fuel volatility impact viability?

    1. ATF volatility: Aviation Turbine Fuel priced in U.S. dollars; exposes airlines to exchange rate fluctuations.
    2. High cost structure: ATF remains one of the largest operational expenditures.
    3. Infrastructure bottlenecks: Congested metro airports; Tier-2 and Tier-3 airports underdeveloped despite UDAN push.
    4. Limited hedging mechanisms: Absence of systematic fuel hedging increases cost unpredictability.

    What role do new regional entrants play?

    1. New NOCs (December 2025): Shankh Air, Al Hind Air, and Fly91 approved.
    2. Regional connectivity expansion: Planned routes include Noida International Airport linkages and underserved regions such as Kochi and Shankh Air’s Uttar Pradesh focus.
    3. Deconcentration potential: Entry could reduce excessive dependence on major carriers.
    4. Structural risk persists: New entrants operate in an already capacity-stressed environment.

    Conclusion

    India’s aviation sector has evolved into a strategic growth engine, combining infrastructure expansion, employment generation, and global integration. Sustained capacity augmentation, regulatory strengthening, and balanced regional connectivity will determine whether the sector can translate its rapid growth into long-term economic resilience and inclusive development.

    PYQ Relevance

    [UPSC 2024] What is the need for expanding the regional air connectivity in India? In this context, discuss the government’s UDAN Scheme and its achievements.

    Linkage: It falls under GS Paper III-Infrastructure (Airports), Regional Connectivity, Inclusive Growth and Balanced Regional Development. Airport congestion and traffic concentration make regional connectivity expansion essential for decongestion and balanced growth.