💥Join UPSC 2027,2028 Mentorship (July Batch) + XFactor Notes & Microthemes PDF

GS Paper: Indian Economy

  • Centre scraps capital gains, interest tax on FII govt bond investments to pull foreign funds

    Why in the News?

    The Union Government promulgated the Income-tax (Amendment) Ordinance, 2026, which received President Droupadi Murmu’s assent on June 5, 2026. The ordinance completely exempts Foreign Institutional Investors (FIIs) from capital gains tax and withholding tax on interest income earned from Indian government securities, effective from April 1, 2026. The move seeks to attract large foreign debt inflows, address a projected $50-60 billion Balance of Payments (BoP) gap, and support rupee stability amid weak portfolio and FDI inflows.

    How Has The Tax Treatment Of Foreign Investors Changed?

    Previous Tax Regime

    1. Long-Term Capital Gains Tax (LTCG): FIIs paid 12.5% tax on gains from bonds held for more than 12 months.
    2. Short-Term Capital Gains Tax (STCG): FIIs paid 30% tax on short-term gains.
    3. Withholding Tax: Foreign investors paid nearly 20% tax on interest income from government bonds.
    4. Global Comparison: India’s withholding tax was among the highest globally after the concessional 5% rate expired in 2023.
    5. Gross Taxation: Non-resident investors paid withholding tax on gross interest income and could not offset losses against past gains.

    New Tax Regime

    1. Capital Gains Exemption: The government has completely scrapped both Long-Term Capital Gains (LTCG) and Short-Term Capital Gains (STCG) taxes on investments made by FIIs in government bonds.
    2. Interest Income Exemption: The government has also scrapped the withholding tax (Tax Deducted at Source) that FIIs were required to pay on their interest income derived from government debt instruments/bonds.
    3. Coverage: Applies to investments through the General Route and Fully Accessible Route (FAR).
    4. Effective Date: Changes become effective from April 1, 2026 following Presidential assent to the ordinance amending the Income Tax Act, 2025.
    5. Institutional Coverage: Benefits extend to FIIs and the Bank for International Settlements (BIS).

    Why Is India Seeking Greater Foreign Debt Inflows?

    1. Balance of Payments Pressure
      1. BoP Deficit: India may face a $50-60 billion BoP deficit in FY27.
      2. External Financing Need: Sustained capital inflows are necessary to finance the deficit without exerting pressure on foreign exchange reserves.
    2. Rupee Stability
      1. Exchange Rate Stress: The rupee had nearly breached the ₹97 per US dollar level recently.
      2. Recent Recovery: Rupee strengthened from ₹95.79/$ on Thursday to ₹94.94/$ on Friday.
      3. Currency Support: Higher debt inflows increase foreign exchange supply and support currency stability.
    3. Weak Portfolio and FDI Flows
      1. Equity Outflows: FPIs have withdrawn approximately $28 billion from Indian equities in FY26.
      2. FDI Moderation: Net FDI inflows have weakened, increasing reliance on alternative capital sources.

    How Large Could The Potential Foreign Inflows Be?

    1. Expected Debt Inflows
      1. Axis Bank Estimate: Tax exemptions could attract $45-50 billion into government debt markets over the next two years.
      2. BoP Gap Financing: Such inflows could bridge a major portion of the projected external financing requirement.
    2. Untapped Market Potential
      1. Current Holdings: FIIs hold only ₹3.75 lakh crore.
      2. Total Market Size: Government securities outstanding amount to ₹112.42 lakh crore.
      3. Foreign Share: Foreign participation remains limited at 3.34%.
    3. Global Investor Appeal
      1. Tax Neutrality: Aligns India more closely with major sovereign bond markets.
      2. Yield Attraction: Indian government bonds offer relatively attractive yields compared to many developed markets.

    What Additional Measures Have Been Taken To Liberalize Government Bond Investments?

    1. Expansion Of Fully Accessible Route (FAR) Securities
      1. Coverage Expansion: RBI is considering inclusion of all new issuances of 15-year, 30-year and 40-year government bonds under FAR.
      2. Accessibility: Ensures unrestricted foreign investment in a larger segment of sovereign debt.
    2. Removal Of Investment Restrictions
      1. Short-Term Investment Limits: Proposed removal of caps on short-duration investments.
      2. Concentration Limits: Removal of concentration restrictions on FII investments.
      3. Individual Security Limits: Greater flexibility for investors across government securities.
    3. Complementary RBI Measures
      1. Overseas Borrowing: RBI eased norms for state-owned enterprises to borrow abroad.
      2. Foreign Currency Deposits: Banks allowed greater mobilization of foreign currency deposits.
      3. Objective: Strengthens overall foreign capital inflow architecture.

    How Can Greater Debt Inflows Benefit The Indian Economy?

    1. External Sector Stability
      1. BoP Financing: Ensures financing of current account and capital account gaps.
      2. Reserve Protection: Reduces pressure on foreign exchange reserves.
    2. Rupee Appreciation
      1. Forex Supply: Higher inflows increase dollar availability.
      2. Exchange Rate Support: Reduces depreciation pressures on the rupee.
    3. Bond Market Development
      1. Market Depth: Broadens investor base in government securities.
      2. Liquidity: Enhances trading activity and price discovery.
    4. Lower Borrowing Costs
      1. Demand Expansion: Increased demand for government bonds may lower yields over time.
      2. Fiscal Benefit: Reduces government borrowing costs.
    5. Global Financial Integration
      1. Market Confidence: Signals policy commitment to capital market reforms.
      2. International Participation: Improves India’s standing in global bond markets.

    What Risks And Concerns Remain?

    1. Dependence On Portfolio Flows
      1. Volatility Risk: Debt inflows can reverse quickly during global financial stress.
      2. External Vulnerability: Excessive reliance on foreign capital may increase exposure to global shocks.
    2. Revenue Implications
      1. Tax Foregone: Government sacrifices tax revenues to attract foreign investment.
      2. Cost-Benefit Question: Actual inflows must justify revenue losses.
    3. Monetary Management Challenges
      1. Liquidity Effects: Large inflows may complicate liquidity and exchange-rate management.
      2. Sterilization Costs: RBI may need intervention to manage excess forex inflows.
    4. Structural Constraints
      1. Investment Decisions: Tax incentives alone may not overcome concerns relating to regulations, global risk appetite, and geopolitical uncertainties.

    Conclusion

    Amid global economic uncertainty and pressure on India’s external sector, the reform seeks to attract foreign capital, support the rupee, and deepen the sovereign debt market. It aligns with India’s broader aspiration of becoming a $5 trillion economy and a globally integrated financial powerhouse while ensuring macroeconomic stability.

    PYQ Relevance

    [UPSC 2016] Justify the need for FDI for the development of the Indian economy. Why is there a gap between MOUs signed and actual FDIs? Suggest remedial steps for increasing actual FDIs in India

    Linkage: The PYQ examines policy measures undertaken by the government to attract foreign capital and strengthen investment inflows. The reform uses tax incentives to attract foreign capital and deepen India’s debt market.
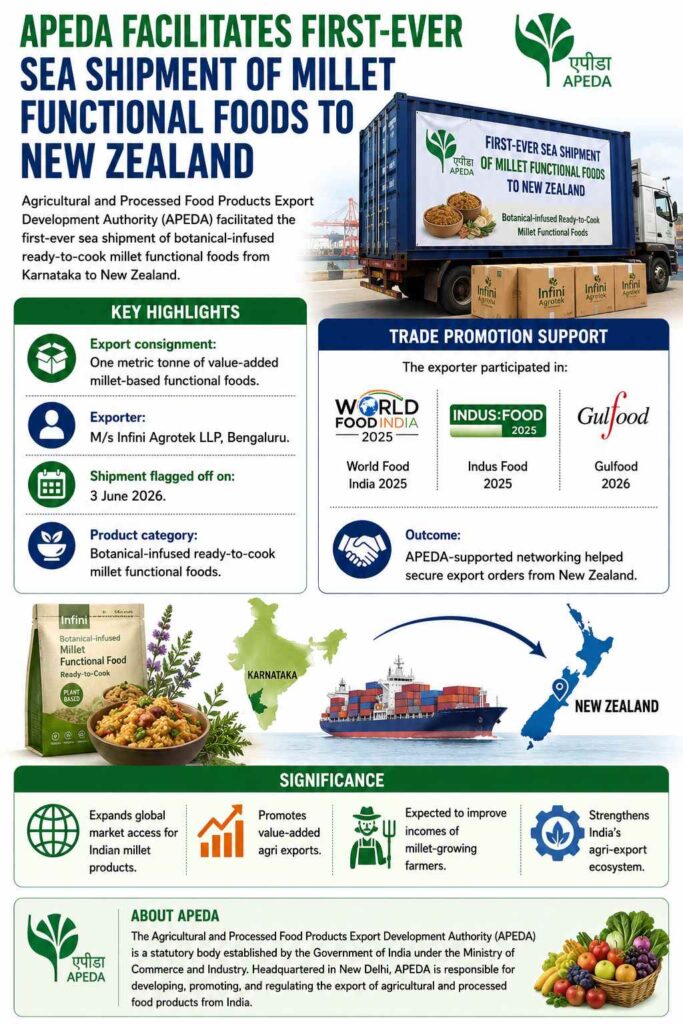
  • APEDA Facilitates Export of Millet Functional Foods to New Zealand

    Why in the news?

    Agricultural and Processed Food Products Export Development Authority (APEDA) facilitated the first-ever sea shipment of botanical-infused ready-to-cook millet functional foods from Karnataka to New Zealand.

    Key Highlights

    • Export consignment:
      • One metric tonne of value-added millet-based functional foods.
    • Exporter:
      • M/s Infini Agrotek LLP, Bengaluru.
    • Shipment flagged off on:
      • 3 June 2026.
    • Product category:
      • Botanical-infused ready-to-cook millet functional foods.
    • Trade promotion support:
      • Exporter participated in:
        • World Food India 2025
        • Indus Food 2025
        • Gulfood 2026
    • Outcome:
      • APEDA-supported networking helped secure export orders from New Zealand.
    • Significance:
      • Expands global market access for Indian millet products.
      • Promotes value-added agri exports.
      • Expected to improve incomes of millet-growing farmers.
      • Strengthens India’s agri-export ecosystem.

    About APEDA

    • The Agricultural and Processed Food Products Export Development Authority (APEDA) is a statutory body established by the Government of India under the Ministry of Commerce and Industry.
    • Headquartered in New Delhi, APEDA is responsible for developing, promoting, and regulating the export of agricultural and processed food products from India.

    [2018] With reference to organic farming in India, consider the following statements:
    1.‘The National ‘Programme for Organic Production’ (NPOP) is operated under the guidelines and ‘directions of the Union Ministry of Rural Development.
    2.‘The Agricultural and Processed Food Product Export Development Authority ‘(APEDA) functions as the Secretariat for the implementation of NPOP.
    3.Sikkim has become India’s first fully organic State.
    Which of the statements given above is/are correct?

    [A] 1 and 2 only

    [B] 2 and 3 only

    [C] 3 only

    [D] 1, 2 and 3

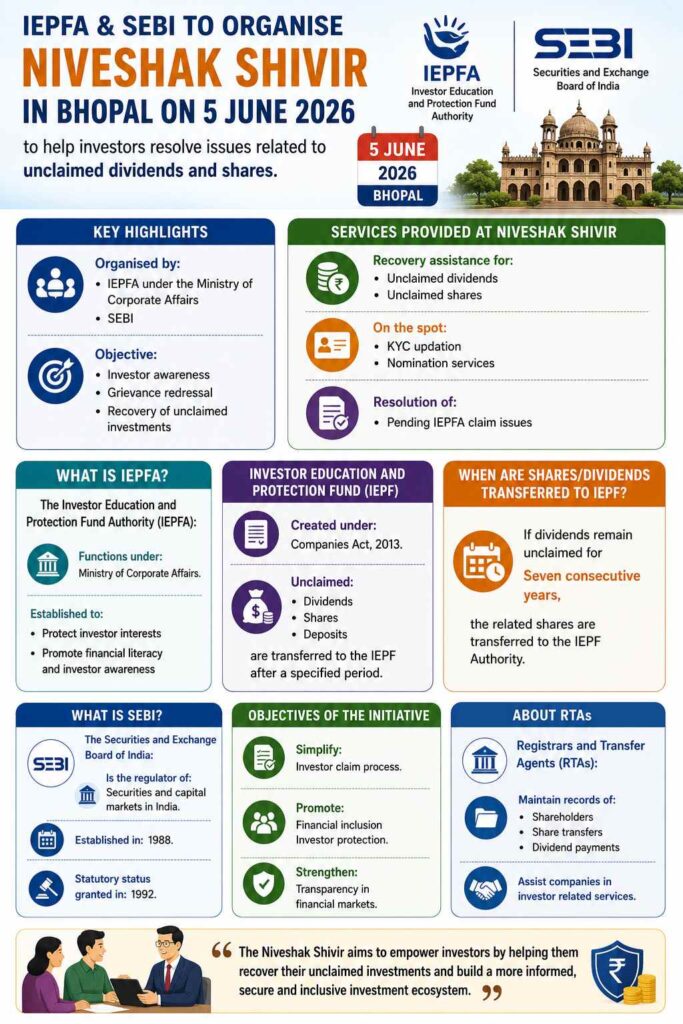
  • Niveshak Shivir by IEPFA and SEBI

    Why in the news?

    Investor Education and Protection Fund Authority and Securities and Exchange Board of India will organise a Niveshak Shivir in Bhopal on 5 June 2026 to help investors resolve issues related to unclaimed dividends and shares.

    Key Highlights

    • Organised by:
      • IEPFA under the Ministry of Corporate Affairs
      • SEBI.
    • Objective:
      • Investor awareness
      • Grievance redressal
      • Recovery of unclaimed investments.

    Services Provided at Niveshak Shivir

    • Recovery assistance for:
      • Unclaimed dividends
      • Unclaimed shares.
    • On the spot:
      • KYC updation
      • Nomination services.
    • Resolution of:
      • Pending IEPFA claim issues.

    What is IEPFA?

    The Investor Education and Protection Fund Authority (IEPFA):

    • Functions under: Ministry of Corporate Affairs.
    • Established to:
      • Protect investor interests.
      • Promote financial literacy and investor awareness.

    Investor Education and Protection Fund (IEPF)

    • Created under: Companies Act, 2013.
    • Unclaimed: Dividends, Shares, and Deposits are transferred to the IEPF after a specified period.

    When are Shares/Dividends Transferred to IEPF?

    • If dividends remain unclaimed for Seven consecutive years, the related shares are transferred to the IEPF Authority.

    What is SEBI?

    The Securities and Exchange Board of India:

    • Is the regulator of Securities and capital markets in India.
    • Established in 1988.
    • Statutory status granted in 1992.

    Objectives of the Initiative

    • Simplify Investor claim process.
    • Promote:
      • Financial inclusion
      • Investor protection.
    • Strengthen: Transparency in financial markets.

    About RTAs

    Registrars and Transfer Agents (RTAs):

    • Maintain records of:
      • Shareholders
      • Share transfers
      • Dividend payments.
    • Assist companies in investor-related services.

    [2025] Consider the following statements:
    I. India accounts for a very large portion of all equity option contracts traded globally thus exhibiting a great boom.
    II. India’s stock market has grown rapidly in the recent past even overtaking Hong Kong’s at some point of time.
    III. There is no regulatory body either to warn the small investors about the risks of options trading or to act on unregistered financial advisors in this regard.
    Which of the statements given above are correct?

    [A] I and Il only

    [B] II and III only

    [C] I and III only

    [D] I, II and III

  • Mission “Senehjori” for Assam Muga Silk

    Why in the news?

    Jyotiraditya M. Scindia launched Mission “Senehjori”, a cluster-based initiative aimed at transforming Assam’s Muga silk sector into a globally competitive luxury textile ecosystem.

    Key Highlights

    • Mission launched in collaboration with:
      • Ministry of Development of the North-Eastern Region
      • Government of Assam
      • Central Silk Board
      • Ministry of Textiles.
    • Focus: Strengthening the entire Muga silk value chain.

    About Muga Silk

    • Muga silk is: The world’s only naturally golden silk.
    • Produced mainly in: Assam
    • It is India’s first GI tagged silk.

    Geographical Indication (GI)Tag

    • A tag given to products originating from a specific geographical region.
    • Indicates:
      • Unique quality
      • Reputation
      • Traditional characteristics.

    Major Objectives of Mission Senehjori

    • Promote: Global branding of Assam Muga silk.
    • Improve:
      • Export potential
      • Traceability
      • Quality assurance.
    • Increase incomes of:
      • Rearers
      • Weavers
      • Artisans.

    Cluster-Based Approach

    • Mission covers major Muga silk districts:Jorhat, Sivasagar, Lakhimpur, Dhemaji, Dibrugarh, Tinsukia, Majuli, and Sualkuchi.

    [2018] India enacted The Geographical Indications of Goods (Registration and Protection) Act, 1999 in order to comply with the obligations to

    [A] ILO

    [B] IMF

    [C] UNCTAD

    [D] WTO

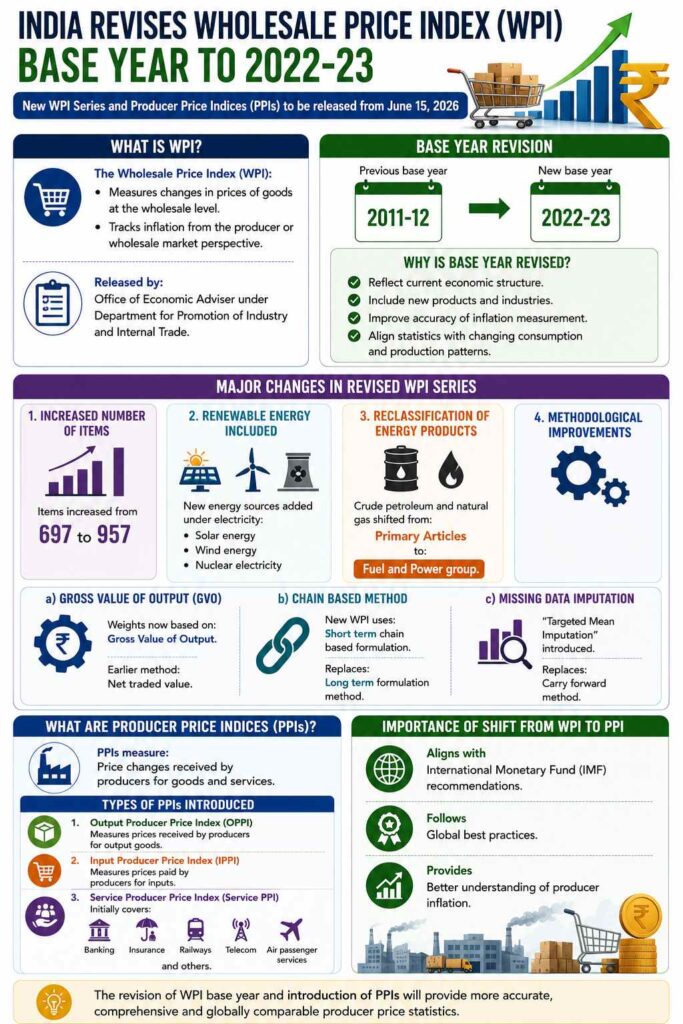
  • Base Year Revision of Wholesale Price Index (WPI)

    Why in the news?

    The Government of India has revised the base year of the Wholesale Price Index (WPI) from 2011-12 to 2022-23. The revised WPI series and new Producer Price Indices (PPIs) will be released from June 15, 2026.

    What is WPI?

    The Wholesale Price Index (WPI):

    • Measures changes in prices of goods at the wholesale level.
    • Tracks inflation from the producer or wholesale market perspective.
    • Released by:
      • Office of Economic Adviser under the Department for Promotion of Industry and Internal Trade.

    Base Year Revision

    • Previous base year: 2011-12.
    • New base year: 2022-23.

    Why is Base Year Revised?

    Base year revision helps:

    • Reflect current economic structure.
    • Include new products and industries.
    • Improve accuracy of inflation measurement.
    • Align statistics with changing consumption and production patterns.

    Major Changes in Revised WPI Series

    Increased Number of Items

    • Items increased from: 697 to 957.

    Renewable Energy Included

    New energy sources added under electricity:

    • Solar energy
    • Wind energy
    • Nuclear electricity

    What are Producer Price Indices (PPIs)?

    • PPIs measure: Price changes received by producers for goods and services.

    How is PPI connected to WPI?

    1. WPI is essentially a traditional form of producer price measurement for goods.
    2. PPI expands the scope of WPI by:
      • including services,
      • measuring both input and output prices,
      • capturing production stage inflation more accurately.
    3. India’s revised WPI and introduction of PPI indicate a gradual transition toward a modern producer inflation framework.

    Components Linking WPI and PPI

    1. Output Producer Price Index (OPPI)

    • Similar to WPI because it measures prices received by producers for selling goods.
    • WPI can be viewed as partially comparable to OPPI for goods.

    2. Input Producer Price Index (IPPI)

    • Measures prices paid by producers for raw materials, fuel, machinery, etc.
    • WPI does not capture this aspect separately.

    3. Service PPI

    • Completely absent in WPI.
    • Covers sectors like banking, telecom, insurance, railways, aviation.

    [2020] Consider the following statements:
    1. The weightage of food in the Consumer Price Index (CPI) is higher than that in the Wholesale Price Index (WPI).
    2. The WPI does not capture changes in the prices of services, which the CPI does.
    3. The Reserve Bank of India uses WPI as its key measure of inflation to decide changes in policy rates.
    Which of the statements given above is/are correct?

    [A] 1 and 2 only

    [B] 2 and 3 only

    [C] 1 and 3 only

    [D] 1, 2 and 3

  • Remittance anchor the rupee, India’s external balances

    Why in the News?

    The Indian rupee has lost nearly 12% of its value against the U.S. dollar since May 2025, leading to renewed concerns regarding India’s external-sector vulnerability. Many analysts have attributed this trend to weakening foreign investment inflows. But at the same time, India received $138 billion in remittances in 2024, making it the world’s largest remittance recipient by a wide margin. More significantly, remittances have, on average, financed more than the entirety of India’s trade deficit since mid-2013.

    What are Remittances?

    1. A remittance refers to the transfer of money from one party to another, most commonly signifying foreign remittance, which involves cross-border funds transferred between individuals or entities in India and abroad. 
    2. While it technically encompasses domestic wire transfers, the term is primarily used for the money sent home by Non-Resident Indians (NRIs) and migrant workers to support their families or make investments.

    Types of Remittances in India

    The Reserve Bank of India (RBI) and the Foreign Exchange Management Act (FEMA) classify these financial transfers into two main types: 

    1. Inward Remittance: Funds sent from a foreign country into a domestic bank account in India. An example is an NRI working in the United States sending money to their parents living in Mumbai.
    2. Outward Remittance: Funds sent from a local bank account in India to an account located abroad. An example is parents in India sending money to a child studying at a university in Singapore.

    Why Does the Conventional Explanation for Rupee Depreciation Present an Incomplete Picture?

    1. Rupee Depreciation: The rupee has depreciated by nearly 12% against the U.S. dollar since May 2025.
    2. FDI Narrative: Several analysts attribute the depreciation primarily to declining net FDI inflows.
    3. FPI Narrative: Volatile portfolio investments are also cited as a major source of pressure on the rupee.
    4. Negative Net FDI: Net FDI became negative in Q2 FY2025-26 after showing a declining trend since Q2 FY2021-22.
    5. Analytical Gap: Excessive attention to Financial Account flows understates the contribution of remittances recorded under the Current Account.

    If Net FDI Has Turned Negative, Why Has India’s External Position Not Deteriorated More Sharply?

    1. Remittance Cushion: Large remittance inflows continue to provide foreign exchange despite weakening capital flows.
    2. Scale of Inflows: India received approximately $138 billion in remittances during 2024.
    3. CAD Financing: Remittances absorb a substantial portion of the financing burden created by trade deficits.
    4. Exchange-Rate Support: Stable inflows reduce pressure on the rupee and foreign exchange reserves.
    5. External Stability: Remittances offset some of the risks arising from negative FDI and volatile FPI.

    What is the Current Account Deficit (CAD)? (Points Form)

    1. Definition: Current Account Deficit arises when a country’s payments to the rest of the world exceed its receipts through the Current Account of the Balance of Payments.
    2. Components of Current Account:
      1. Trade Balance (Exports-Imports of Goods)
      2. Net Services (IT, tourism, shipping, etc.)
      3. Net Primary Income (interest, dividends, profits)
      4. Net Secondary Income (remittances, gifts, grants)
    3. Cause: Occurs when imports and income outflows exceed exports, services earnings and transfer receipts.
    4. Significance: Indicates the extent to which a country depends on external financing.
    5. Financing Sources: FDI, FPI, external commercial borrowings and foreign exchange reserves.
    6. Impact of High CAD:
      1. Increases external vulnerability.
      2. Creates depreciation pressure on the domestic currency.
      3. Raises dependence on foreign capital inflows.
    7. India-Specific Context: Large remittance inflows generate a surplus under Net Secondary Income (NSI), which helps reduce the CAD and strengthens external-sector stability.

    How Have Remittances Financed More Than the Entire Trade Deficit Since Mid-2013?

    This is due to their immense scale, steady growth, and structural shift toward high-value transfers from advanced economies. In India’s Balance of Payments (BoP), the massive gap created by importing more goods than exporting (the merchandise trade deficit) is largely cancelled out by “invisibles,” where remittances play an anchoring role.

    1. Record Inflows: India received approximately $138 billion in remittances in 2024, making it the world’s largest remittance recipient and generating foreign exchange inflows equivalent to nearly 3% of GDP.
    2. Net Secondary Income Surplus: Remittances constitute the largest component of India’s Net Secondary Income (NSI) surplus in the Current Account.
    3. Trade Deficit Offset: The NSI surplus generated by remittances offsets a substantial portion of the merchandise trade deficit.
    4. Structural Shift in Sources: A growing share of remittances originates from high-income economies, increasing the value and stability of transfers.
    5. Sustained Foreign Exchange Buffer: Consistently positive remittance inflows have enabled them to finance more than the entirety of India’s trade deficit on average since mid-2013.

    What Has Been the Impact of Remittances on India’s External Sector?

    1. Current Account Impact: Net Secondary Income surpluses significantly reduce the Current Account Deficit.
    2. Residual CAD: Remaining deficits become substantially smaller after accounting for remittance inflows.
    3. Financing Burden: Lower CAD reduces the amount that must be financed through FDI, FPI or external borrowing.
    4. External Resilience: Remittances act as the first line of defence against external imbalances and sudden capital-flow reversals.
    5. Exchange Rate Support: Stable foreign exchange inflows reduce pressure on the rupee and forex reserves.

    How Do Remittances Reduce India’s Dependence on FDI and FPI?

    1. Trade Deficit Absorption: Remittance inflows offset a substantial portion of India’s merchandise trade deficit.
    2. CAD Reduction: Net Secondary Income (NSI) surpluses narrow the Current Account Deficit.
    3. Lower External Financing Needs: A smaller CAD requires less financing through FDI, FPI and external borrowing.
    4. Reduced Vulnerability: Lower dependence on volatile capital flows strengthens external-sector stability.
    5. Exchange Rate Support: Stable foreign exchange inflows help moderate pressure on the rupee.

    Are Remittances a More Reliable Source of External Financing Than FDI and FPI?

    1. Scale: Remittances amount to nearly 3% of GDP and exceed net FDI and FPI inflows.
    2. Stability: Household-driven transfers exhibit lower volatility than financial investments.
    3. Continuity: Family obligations sustain flows even during periods of uncertainty.
    4. Predictability: Migrant earnings and savings decisions generate more stable inflows.
    5. Resilience: Remittances rarely experience sudden stops comparable to capital flight.

    Why Do Remittances Strengthen India’s External Position Without Creating Future Liabilities?

    1. Transfer Nature: Remittances are transfers rather than investment claims.
    2. Liability-Free Inflows: Remittances do not require repayment.
    3. No Profit Repatriation: Unlike FDI, remittances do not generate future dividend or profit outflows.
    4. No Exit Risk: Unlike FPI, remittances cannot be withdrawn from domestic financial markets.
    5. Low Vulnerability: Remittances strengthen the external sector without creating future obligations.

    Conclusion

    India’s external resilience is increasingly anchored in remittances rather than volatile capital flows. While FDI and FPI remain important, remittances have financed a substantial share of the trade deficit, reduced the Current Account Deficit and supported the rupee without creating future liabilities. A comprehensive assessment of India’s external-sector health must therefore place remittances alongside, and in some contexts above, conventional measures of foreign capital inflows.

    PYQ Relevance

    [UPSC 2014] How does the Current Account Deficit affect the external stability of an economy?

    Linkage: The PYQ directly examines the relationship between the Current Account Deficit (CAD) and India’s external-sector resilience. The article revolves around the argument that remittances significantly reduce CAD and thereby strengthen external stability.

  • IIP Growth Slows to 4.9% in April 2026

    Why in the news?

    India’s industrial output, measured by the Index of Industrial Production (IIP), grew by 4.9% in April 2026, slower than 5.8% recorded in April 2025. The government also released a revised IIP series with a new base year of 2022-23.

    What is IIP?

    The Index of Industrial Production (IIP) measures:

    • Short term changes in industrial production in India.
    • Published monthly by:
      • Ministry of Statistics and Programme Implementation.

    It is an important indicator of:

    • Industrial performance
    • Economic activity
    • Manufacturing trends

    New IIP Series

    • Base year changed from: 2011-12 to 2022-23.
    • Index value for base year is taken as: 100.
    • New basket includes:
      • 1,042 products
      • 463 item groups.
    • Earlier series had:
      • 839 items
      • 407 item groups.

    Major Changes in the New Series

    The revised IIP has expanded coverage by including:

    • Gas supply
    • Water supply
    • Sewerage activities
    • Waste management activities

    Sectoral Performance

    • Mining and Quarrying: Output contracted by more than 5% in April 2026.
    • Manufacturing Grew by: 6.2%.
    • Manufacturing contributes nearly: 75% of IIP weight.

    [2015] In the ‘Index of Eight Core Industries’, which one of the following is given the highest weight?

    (a) Coal Production

    (b) Electricity generation

    (c) Fertilizer production

    (d) Steel production.

  • Why inflation rate is not the same as affordability

    Why in the News?

    India’s inflation has remained mostly under the RBI’s target range of 2-6%, showing success in controlling price rise. However, many people still feel daily expenses are high because prices have increased over the years faster than incomes for many families. This has raised an important question: Does low inflation really mean things are affordable?

    Why is inflation different from affordability?

    1. Different Meaning: Inflation measures the rise in prices, while affordability measures whether people can still buy goods and services comfortably.
    2. Different Basis: Inflation focuses on price increase, whereas affordability depends on income growth relative to prices.
    3. Lower Inflation ≠ Lower Prices: A fall in inflation means prices are rising slowly, not that prices have reduced.
    4. Cumulative Effect: Affordability depends on the total increase in prices over time, not only yearly inflation.
    5. Real Purchasing Power: Even with low inflation, affordability declines if wages and incomes do not rise adequately.

    How has RBI succeeded in controlling inflation but not affordability concerns?

    1. Inflation Targeting Framework: RBI adopted formal inflation targeting in 2016, aiming to maintain retail inflation at 4% ±2%.
    2. Policy Success: Retail inflation remained largely within the 2-6% comfort band, except during exceptional shocks.
    3. Monetary Tightening: RBI increased repo rates to curb inflationary pressures arising from excess demand.
    4. Structural Limitation: Monetary policy controls the rate of price increase, not already elevated prices.
    5. Persistent Cost Burden: Even with lower inflation, consumers continue paying higher prices accumulated over previous years.

    Data Highlight:

    1. General price level increased by around 75% between April 2014 and March 2026.
    2. Prices rose by 41% between March 2019 and March 2026.

    How have rising prices affected different categories of workers?

    1. Salaried Workers: Experienced relatively better affordability as income growth outpaced inflation in several periods.
    2. Self-Employed Workers: Faced weaker affordability due to slower and irregular income growth.
    3. Casual Labourers: Remained most vulnerable because of lower absolute earnings despite wage increases.
    4. PLFS Classification: Periodic Labour Force Survey (PLFS) divides workers into:
      1. Salaried workers
      2. Self-employed workers
      3. Casual labourers
    5. Data (2017-18 to 2023-24):
      1. Casual Labour Income: Increased by 43%, yet average monthly earnings remained only around ₹13,590.
      2. Self-Employed Income: Reached around ₹14,861/month.
      3. Salaried Workers: Earned around ₹22,690/month, showing relatively higher resilience.

    Why does cumulative inflation matter more than annual inflation?

    1. Limited Picture of Annual Inflation: Shows price increase only compared to the previous year and may hide long-term cost burden.
    2. Rising Cost of Living: Cumulative inflation reflects the total increase in prices over several years, giving a clearer picture of household expenses.
    3. Real Affordability: Affordability depends on whether incomes grow faster than total price rise, not yearly inflation alone.
    4. Consumer Experience: Households feel the effect of accumulated increase in food, rent, transport, health, and education costs.
    5. Example from Article: If the price index was 100 in 2014 and rose to 175 by 2026, even moderate yearly inflation still results in much higher everyday costs.

    Why is affordability becoming a major policy concern?

    1. Consumption Slowdown: Weak purchasing power suppresses domestic demand.
    2. Growth Challenge: Lower household spending affects sectors dependent on mass consumption.
    3. Income Inequality: Divergence in wage growth widens economic disparities.
    4. Employment Quality Issue: Income growth depends on availability of stable and productive jobs.
    5. Policy Dilemma: Excessive inflation control through higher interest rates may further suppress investment and employment.

    Can RBI alone solve the affordability challenge?

    1. Monetary Policy Constraint: RBI can contain inflation but cannot directly raise incomes.
    2. Fiscal Policy Role: Government intervention through wage support, social protection, and targeted subsidies improves affordability.
    3. Employment Generation: Productive employment raises real wages sustainably.
    4. Supply-Side Reforms: Better logistics, food supply chains, and productivity reduce cost pressures.
    5. Welfare Measures: Public provisioning in health, education, and food reduces household expenditure burden.

    Conclusion

    Inflation management and affordability are not synonymous. While India has achieved relative success in maintaining inflation within RBI’s target range, household well-being ultimately depends on real purchasing power rather than inflation statistics alone. Sustainable affordability requires a combination of price stability, faster income growth, productive employment generation, and reduced cost burden on essential services.

    PYQ Relevance

    [UPSC 2024] What are the causes of persistent high food inflation in India? Comment on the effectiveness of the monetary policy of the RBI to control this type of inflation.

    Linkage: The PYQ tests understanding of inflation, RBI’s monetary policy, and limits of inflation control in improving economic outcomes. The article extends this debate by arguing that controlling inflation alone does not ensure affordability, as real income growth determines purchasing power.

  • RBI data shows why government is concerned about dollars flowing outs

    Why in the News?

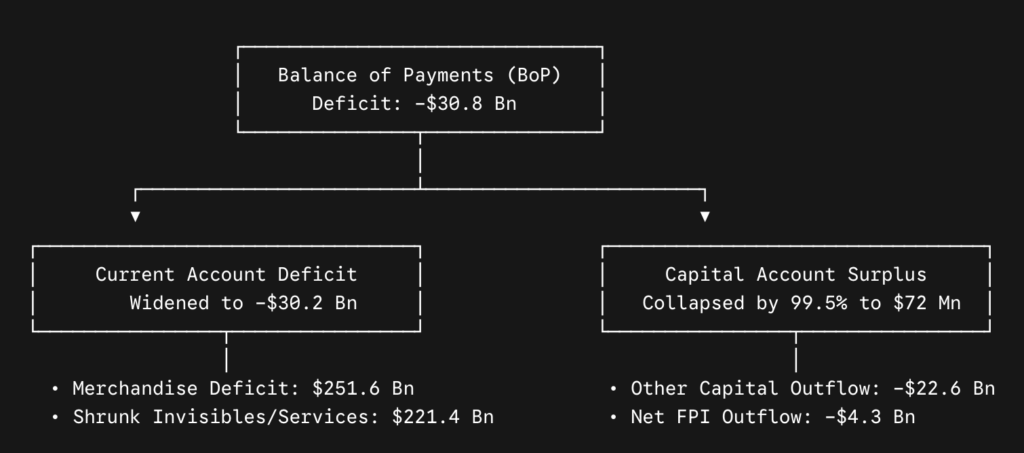
    RBI’s Annual Report 2025-26 showed that India’s Balance of Payments (BoP) deficit widened sharply to $30.8 billion in 2025-26, compared to $5 billion in 2024-25. This marks a major reversal from the $63.7 billion surplus in 2023-24. This highlights rising pressure on India’s external sector due to weaker foreign investments and high dollar outflows for imports such as oil and gold.

    What is Balance of Payments (BoP)?

    The Balance of Payments (BoP) is a systematic record of all economic transactions between a country and the rest of the world during a specific period (usually a year). It tracks the flow of foreign currency (mainly dollars) into and out of the country. In simple terms, BoP shows whether a country is earning more dollars than it spends or spending more than it earns.

    What are the components of BoP?

    1. Current Account (Trade and Income Flows): It records transactions related to:
      1. Goods Trade: Exports and imports of merchandise (e.g., crude oil, machinery).
      2. Services Trade: IT services, tourism, consulting, shipping.
      3. Remittances: Money sent by Indians working abroad.
      4. Investment Income: Interest, dividends, profits.
      5. Example: India imports crude oil and exports IT services.
    2. Capital Account: Investments and Capital Flows: It records:
      1. Foreign Direct Investment (FDI): Long-term investments in industries.
      2. Foreign Portfolio Investment (FPI): Investment in stocks and bonds.
      3. External Borrowings: Loans from abroad.
      4. Banking Capital and Other Transfers
      5. Example: A foreign company investing in India or FIIs buying Indian shares.

    How is BoP interpreted?

    1. BoP Surplus: Dollar inflows exceed outflows, strengthens forex reserves.
    2. BoP Deficit: Dollar outflows exceed inflows, RBI may use foreign exchange reserves to bridge the gap.
    3. In 2025-26, India recorded a BoP deficit of $30.8 billion, meaning the country spent more foreign currency than it received, raising concerns about external sector stability.

    Why has India’s Balance of Payments deteriorated sharply in 2025-26?

    1. Balance of Payments Deficit: India recorded a BoP deficit of $30.8 billion in 2025-26, compared to $5 billion in 2024-25, showing a sharp deterioration in external sector stability.
    2. Sharp Reversal: India moved from a BoP surplus of $63.7 billion in 2023-24 to a large deficit in just two years, indicating weakening capital inflows.
    3. Foreign Exchange Pressure: RBI had to finance the deficit through foreign exchange reserves, leading to reserve depletion.
    4. Investment Slowdown: Net foreign investment inflows into India witnessed a sharp decline, worsening the external financing gap.

    How do the current account and capital account shape India’s external position?

    1. Current Account: Captures trade in goods and services, remittances, and cross-border income flows.
    2. Capital Account: Includes foreign direct investment (FDI), foreign portfolio investment (FPI), external borrowings, and assistance.
    3. Persistent Current Account Deficit (CAD): India generally imports more than it exports, making CAD a structural feature of the economy.
    4. Trade Deficit: India’s merchandise trade deficit stood at $251.6 billion in 2025–26, improving from $286.9 billion in the previous year, but still remaining substantially large.
    5. Services Surplus (‘Invisible Trade’): India earned a services surplus of $221.4 billion in 2025-26, lower than $263.9 billion in 2024-25, reducing the cushion available against merchandise deficits.

    Why did the capital account weaken despite India’s growth story?

    1. Capital Account Contraction: Capital account surplus declined sharply to $72 million in 2025-26, compared to $16.6 billion in 2024-25. This indicates weak external financing.
    2. Funds Held Abroad: Indians parked larger amounts abroad through delayed export receipts, advance import payments, and overseas holdings. This creates a deficit of $22.6 billion, compared to $7.4 billion previously.
    3. Geopolitical Impact: Trade disruptions linked to the West Asia crisis increased payment uncertainties and external pressures.
    4. Foreign Portfolio Investor (FPI) Outflows: FPIs withdrew $4.3 billion more than they invested in 2025-26, reversing the previous trend where inflows exceeded outflows.

    Why is the government especially concerned about oil and gold imports?

    1. Oil Dependence: India imports nearly 90% of its crude oil requirement, making external balances highly vulnerable to global oil price shocks.
    2. Gold Demand: India produces negligible gold domestically despite large consumer demand, increasing pressure on dollar reserves.
    3. Dollar Outflow: A substantial portion of India’s foreign exchange outflow is used to pay for oil and gold imports.
    4. Policy Response: The government raised import duty on gold and silver from 6% to 15% and restricted imports of several silver categories to reduce external pressure.
    5. Consumption Advisory: Prime Minister Narendra Modi urged citizens to moderate fuel consumption and gold purchases, reflecting concern regarding dollar outflows.

    What are the broader macroeconomic implications of a worsening BoP deficit?

    1. Forex Reserve Depletion: Persistent BoP deficits force RBI to utilise foreign exchange reserves, reducing external buffers.
    2. Currency Pressure: Sustained dollar outflows may weaken the Indian Rupee, increasing imported inflation.
    3. Inflationary Impact: Higher oil import costs raise transportation and manufacturing expenses.
    4. External Vulnerability: Reduced capital inflows increase dependence on volatile external borrowing.
    5. Investor Sentiment: Weak BoP signals may affect foreign investor confidence and macroeconomic stability perceptions.

    Can India reduce structural vulnerability in its external sector?

    1. Export Diversification: Strengthens merchandise exports beyond traditional sectors.
    2. Manufacturing Expansion: Supports Make in India and production-linked incentives to reduce import dependence.
    3. Energy Transition: Accelerates renewable energy and domestic energy security to reduce oil import dependence.
    4. Financial Stability: Enhances resilience through stable FDI rather than volatile portfolio flows.
    5. Gold Monetisation: Encourages financialisation of savings through sovereign gold bonds and monetisation schemes.

    Conclusion

    RBI’s latest data highlights a growing imbalance in India’s external sector marked by widening dollar outflows, weakening foreign investments, and structural dependence on imported commodities. While India’s strong services exports continue to provide resilience, sustaining external stability will require export competitiveness, reduced import dependence, stable capital inflows, and prudent macroeconomic management.

    PYQ Relevance

    [UPSC 2019] How would the recent phenomena of protectionism and currency manipulations in world trade affect macroeconomic stability of India?

    Linkage: India’s worsening Balance of Payments (BoP) and rising dollar outflows directly affect macroeconomic stability, exchange rate management, foreign exchange reserves, and external vulnerability. The issue links external trade dynamics with rupee stability and capital flows.

  • Balance of Payments (BoP) Deficit & Dollar Outflow

    Why in the news?

    The Reserve Bank of India’s (RBI) Annual Report for 2025-26 revealed that India’s Balance of Payments (BoP) stood at a major deficit of $30.8 billion, marking an alarmingly sharp, six-fold increase over the previous year’s deficit.

    Key Findings

    • The Deficit Surge: The overall BoP went from a surplus of $63.7 billion in 2023-24 to a deficit of $5 billion in 2024-25, before cascading further to a $30.8 billion deficit in 2025-26 (provisional data up to Dec 31).
    • Depletion of Forex: To plug this widening gap, the RBI had to draw directly from India’s foreign exchange reserves, causing a significant dent in national buffers.

    Understanding the Double Whammy: Current vs. Capital Account

    The sudden collapse of India’s BoP position is driven by structural slippages in both component accounts:

    1. Widening Current Account Deficit (CAD)

    • Status: Hit a three-year high of $30.2 billion in 2025-26.
    • The Core Mechanism: While the physical trade deficit (merchandise) actually improved slightly—dropping to $251.6 billion from $286.9 billion—the surplus from India’s “invisibles” (software, services, and remittances) shrank much faster (falling from $263.9 billion to $221.4 billion).
    • Result: The services sector could no longer cushion the trade deficit, causing CAD to expand.

    2. Near-Total Collapse of the Capital Account Surplus

    • Status: Shrank by an unprecedented 99.5%, collapsing down to a mere $72 million from $16.6 billion the year prior.
    • Driven by “Other Capital”: Hit a record deficit of $22.6 billion. This reflects delayed export receipts, advance payments for imports amidst geopolitical friction, and domestic funds being parked abroad.
    • Foreign Portfolio Investment (FPI) Flight: Reversing a two-year positive streak, FPIs turned into net sellers, pulling out $4.3 billion more from Indian markets than they put in.

    [2014] With reference to Balance of Payments, which of the following constitutes/constitute the Current Account?
    1.Balance of invisibles
    2.Special Drawing Rights
    3.Balance of trade
    Select the correct answer using the codes given below;

    [A] 1 only

    [B] .2 and 3 only

    [C] .1 and 3 only

    [D] 1, 2 and 3