💥Join UPSC 2027,2028 Mentorship (July Batch) + XFactor Notes & Microthemes PDF

GS Paper: Population & Associated Issues

  • Sample Registration Survey (SRS) 2024 and India’s Demographic Transition

    Why in the News?

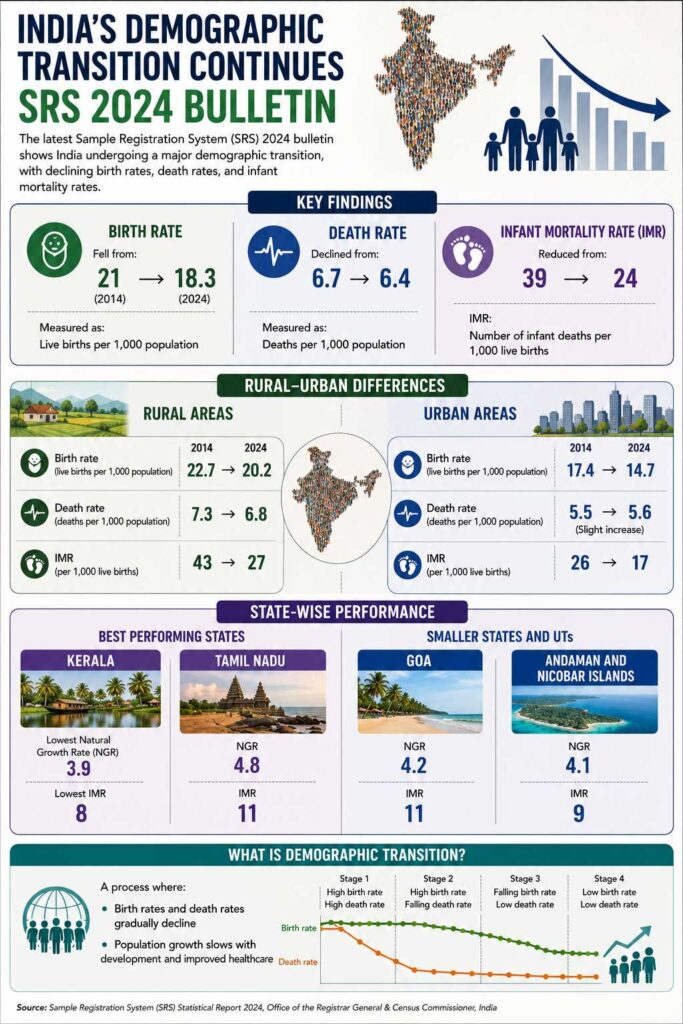
    The latest Sample Registration System (SRS) 2024 bulletin shows India undergoing a major demographic transition, with declining birth rates, death rates, and infant mortality rates.

    Key Findings

    Birth Rate

    • Fell from: 21 (2014) to 18.3 (2024)
    • Measured as: Live births per 1,000 population

    Death Rate

    • Declined from: 6.7 to 6.4
    • Measured as: Deaths per 1,000 population

    Infant Mortality Rate (IMR)

    • Reduced from 39 to 24
    • IMR: Number of infant deaths per 1,000 live births

    Rural-Urban Differences

    Rural Areas

    • Birth rate: 22.7 to 20.2
    • Death rate: 7.3 to 6.8
    • IMR: 43 to 27

    Urban Areas

    • Birth rate: 17.4 to 14.7
    • Death rate: Slight increase from 5.5 to 5.6
    • IMR: 26 to 17

    State-wise Performance

    Best Performing States

    • Kerala: Lowest Natural Growth Rate (NGR): 3.9. Lowest IMR: 8
    • Tamil Nadu: NGR: 4.8. IMR: 11

    Smaller States and UTs

    • Goa: NGR 4.2. IMR 11
    • Andaman and Nicobar Islands: NGR 4.1. IMR 9

    What is the Demographic Transition?

    A process where:

    • Birth rates and death rates gradually decline
    • Population growth slows with development and improved healthcare

  • Top 10% rural households own 44% land in India: Study

    Why in the News?

    A recent April 2026 study by the World Inequality Lab titled “Land Inequality in India: Nature, History, and Markets” reveals that land ownership in rural India is highly concentrated. Land ownership in rural India remains highly unequal, with the top 10% of households controlling 44% of total land, while nearly 46% households are landless. This reflects structural imbalance in agrarian distribution, impacting equity, productivity, and rural livelihoods.

    Why is land ownership inequality in rural India a major concern?

    1. High Concentration: Top 10% households own 44% of total land, indicating extreme inequality.
    2. Widespread Landlessness: Around 46% rural households own no land, reflecting exclusion from productive assets.
    3. Skewed Ownership Pyramid: Top 5% own 32%, and top 1% own 18% of land, showing elite capture.
    4. Agrarian Distress Link: Landlessness leads to dependence on wage labour, increasing vulnerability.

    What are the regional patterns of land inequality and landlessness?

    1. High Inequality States: Bihar and Punjab show villages where a single landlord owns >50% land.
    2. High Landlessness: Punjab has 73% landless households, highest among states.
    3. Low Inequality: Karnataka has lowest Gini coefficient (65), indicating relatively equitable distribution.
    4. High Inequality Index: Kerala has Gini coefficient of 90, followed by Bihar, Punjab, Tamil Nadu, West Bengal (~80).
    5. Agrarian States Pattern: Rajasthan (34%) and Uttar Pradesh (39%) have lower landlessness than Madhya Pradesh (51%) and Bihar (59%).

    What does the Gini coefficient reveal about land inequality?

    The Gini coefficient for land inequality is a statistical measure (0 to 1 or 0 to 100) determining how land ownership is distributed across a population. A coefficient of 0 indicates perfect equality (everyone owns the same amount of land), while a value near 1 or 100 indicates perfect inequality (one person owns all the land). It shows the deviation from equal land distribution.

    1. Inequality Measure: Higher Gini coefficient indicates greater inequality in land distribution.
    2. Kerala Case: Highest Gini (90) shows extreme concentration despite social development indicators.
    3. Impact of Landless Inclusion: Excluding landlessness reduces Gini significantly, showing inequality is driven by landlessness.
    4. Policy Insight: Landlessness contributes more to inequality than unequal distribution among landowners.

    How is land distributed across different landholding classes?

    1. Marginal Holdings: 48.6% households own 0-1 hectare, indicating fragmentation.
    2. Small Holdings: Significant share in 1-2 hectares, limiting economies of scale.
    3. Average Size (Landowners): Around 6.2 hectares, showing disparity within landed class.
    4. Large Holders’ Dominance: Largest landowners control 12.4% land in villages, rising to >50% in 3.8% villages.

    What are the structural causes behind land inequality in India?

    1. Historical Legacy: Zamindari and feudal systems created concentrated ownership patterns.
    2. Incomplete Land Reforms: Weak implementation of land ceiling and redistribution laws.
    3. Population Pressure: Fragmentation due to inheritance reduces viability of holdings.
    4. Market Forces: Commercial agriculture increases land consolidation in developed regions like Punjab.
    5. Data Limitations: Last comprehensive caste-land linkage from SECC 2011, indicating outdated policy inputs.

    What are the implications for the economy and society?

    1. Rural Inequality: Reinforces socio-economic disparities and caste-based exclusion.
    2. Low Productivity: Small fragmented holdings reduce mechanization and efficiency.
    3. Migration Push: Landless households migrate for informal urban employment.
    4. Credit Access Issues: Lack of land ownership restricts access to institutional credit.
    5. Social Conflict Risk: Concentration of land can lead to agrarian unrest. 

    What government reforms have been undertaken to address land inequality in India?

    1. Abolition of Intermediaries: Eliminates zamindari system; ensures direct ownership between state and cultivator; implemented post-independence across states.
    2. Land Ceiling Laws: Imposes upper limits on landholding; redistributes surplus land to landless households; varies across states (e.g., 10-54 acres depending on land type).
    3. Tenancy Reforms: Provides security of tenure, regulates rent, and grants ownership rights to tenants; successful examples seen in West Bengal (Operation Barga).
    4. Consolidation of Holdings: Reduces fragmentation of land; promotes efficient farming; implemented effectively in Punjab, Haryana, and Western UP.
    5. Bhoodan and Gramdan Movements: Voluntary land donation movements led by Vinoba Bhave; redistributes land to landless, though limited success in long term.
    6. Digital India Land Records Modernization Programme (DILRMP): Digitizes land records; ensures transparency, reduces disputes, and improves land ownership clarity.
    7. SVAMITVA Scheme: Provides property ownership rights in rural inhabited areas using drone mapping; enables access to credit and reduces informal land ownership.
    8. Forest Rights Act, 2006: Recognizes land rights of tribal and forest-dwelling communities; addresses historical injustice and improves tenure security.
    9. PM-KISAN Scheme: Provides income support to farmers; ensures financial stability, though excludes landless agricultural labourers.

    Conclusion

    Land inequality in rural India reflects structural imbalance rooted in historical, institutional, and economic factors. Addressing landlessness, improving land records, and enabling equitable access to productive assets remain essential for inclusive rural development and sustainable agricultural growth.

    PYQ Relevance

    [UPSC 2023] State the objectives and measures of land reforms in India. Discuss how land ceiling policy can be considered effective.

    Linkage: The PYQ addresses agrarian inequality and land concentration, directly aligning with current evidence of top 10% owning 44% land and widespread landlessness. It enables evaluation of land ceiling policy effectiveness, linking historical reforms with present challenges of uneven implementation and persistent rural inequality.

  • [27th January 2026] The Hindu OpED: Mind the time: On the financial burden of India’s ageing population

    PYQ Relevance

    [UPSC 2024] What is the concept of a ‘demographic winter’? Is the world moving towards such a situation?

    Linkage: It falls under GS Paper I: Population and Associated Issues, with direct links to ageing, fertility decline, and socio-economic sustainability. The article reflects an emerging sub-national demographic winter in India, where States like Kerala and Tamil Nadu face rapid ageing, mirroring the global trend of falling fertility and rising old-age dependency.

    Mentor’s Comment

    This article is important because India’s population change is no longer a future issue, it is already happening unevenly across States. It is in the news as it questions the RBI’s advice that ageing States should cut subsidies to manage rising pension and healthcare costs, while younger States should focus on education, skills, and labour-intensive growth. The article highlights a key gap: without public, State-funded geriatric care, demographic advantage may turn into a serious social and fiscal burden.

    Why in the News

    India faces its first clear inter-State demographic divergence where ageing and youth coexist simultaneously at scale. Kerala and Tamil Nadu will become “ageing States” by 2036, with elderly populations exceeding 22% and 20%, respectively. This marks a sharp shift from earlier decades when demographic transition was gradual and nationally uniform.

    Why is India’s demographic transition uneven across States?

    1. Demographic divergence: Southern States experience rapid ageing due to sustained fertility decline, while Bihar, Uttar Pradesh, and Jharkhand retain expanding working-age populations beyond 2031.
    2. Middle-ground States: Karnataka and Maharashtra face simultaneous growth and ageing pressures, complicating fiscal planning.
    3. Policy implication: Uniform demographic assumptions no longer apply to inter-State fiscal transfers or social sector planning.

    How does the RBI propose managing ageing-related fiscal stress?

    1. Subsidy rationalisation: Advises ageing States to reduce subsidies to manage rising pension and healthcare expenditure.
    2. Human capital investment: Urges youthful States to invest heavily in education and skills to exploit a “window of opportunity.”
    3. Labour-intensive growth: Recommends expansion of labour-intensive sectors to absorb the growing workforce.

    Why is the RBI’s fiscal advice politically and structurally constrained?

    1. Fiscal federalism imbalance: Population-weighted Finance Commission formulas reduce tax devolution to ageing southern States despite higher welfare burdens.
    2. Delimitation impact: Upcoming delimitation reduces parliamentary representation of States that controlled population growth early.
    3. Double disadvantage: Successful population stabilisation results in lower fiscal transfers and reduced political voice.

    Are youthful States adequately positioned to harness demographic advantage?

    1. Education spending stagnation: Share of State expenditure on education has stagnated or declined despite workforce expansion.
    2. Employability gap: Persistent mismatch between education outcomes and job readiness.
    3. Technological disruption: Workforce entry coincides with rising automation and AI-driven manufacturing, reducing labour absorption capacity.
    4. Premature ageing risk: Possibility of “ageing before getting rich” due to weak industrial absorption.

    How does ageing disproportionately affect women

    1. Longevity-finance gap: Elderly women live longer but possess fewer financial assets.
    2. Workforce exclusion: Majority of elderly women were never part of the formal workforce and lack pension coverage.
    3. Policy blind spot: Workforce-centric ageing strategies exclude unpaid care workers and homemakers.
    4. Social dependency: Absence of income security deepens dependence on family or State transfers.

    Why can family-based elderly support no longer be assumed?

    1. Migration patterns: Youth migration weakens intergenerational co-residence.
    2. Nuclear families: Decline of joint family structures erodes informal care networks.
    3. Safety net collapse: Assumptions of familial support no longer hold as a universal fallback.

    What structural solutions does the article propose beyond fiscal adjustments?

    1. Industrial policy shift: Job creation in new sectors such as green energy and the care economy.
    2. Early institution-building: Youthful States must build healthcare and pension systems before fertility decline accelerates.
    3. Social pension expansion: Large-scale expansion of non-contributory social pensions despite fiscal consolidation pressures.
    4. Public geriatric care: Absence of State-funded geriatric infrastructure risks limiting “graceful ageing” to the wealthy.

    Conclusion

    India’s demographic transition demands a shift from narrow fiscal management to long-term social planning. Without early investment in public geriatric care, social pensions, and health systems, ageing will deepen inequality and strain federal finances. A balanced approach that links demographic responsibility with fiscal equity is essential to ensure that population change strengthens, rather than destabilises, India’s development trajectory.

  • Are India’s small towns being increasingly urbanised?

    Why in the News?

    India still focuses its urban future on megacities, even though only about 500 towns are large cities, while nearly 9,000 are small towns, most with populations below one lakh. Earlier, urbanisation was led mainly by metros, but this pattern is now changing. Small towns are increasingly absorbing surplus labour, migrant workers, and consumption activities as metros face high land prices, stressed infrastructure, and rising living costs. This shift reflects not inclusive growth, but the spread of urban crisis to smaller towns, with serious economic and social consequences.

    How have India’s small towns proliferated since the 1970s?

    1. Metropolitan Concentration: Organised capital accumulation during the 1970s-1990s prioritised large cities as centres of industry, infrastructure, and state investment.
    2. Labour Absorption: Cities like Delhi, Mumbai, Chennai, Kolkata, and later Bengaluru and Hyderabad absorbed surplus labour and expanded consumption.
    3. Spatial Fix: Metros functioned as spatial fixes for capitalism by enabling accumulation through land, infrastructure, and labour concentration.

    Why are India’s metros facing a crisis of over-accumulation today?

    1. Land Detachment: Land prices have become disconnected from productive economic use.
    2. Infrastructure Stress: Urban systems are stretched beyond functional limits.
    3. Cost Escalation: Rising housing and living costs have become unaffordable for working groups.
    4. Accumulation Limits: Metros have exhausted their capacity to absorb surplus capital and labour efficiently.

    Why have small towns emerged as new sites of urbanisation?

    1. Capital Redirection: Small towns offer cheaper land and lower entry barriers for capital.
    2. Labour Availability: They absorb migrants displaced from metros and rural youth exiting agrarian livelihoods.
    3. Functional Integration: Towns such as Sattenapalle (Andhra Pradesh), Dhamtari (Chhattisgarh), Barabanki (Uttar Pradesh), Hassan (Karnataka), Bongaigaon (Assam), and Una (Himachal Pradesh) now act as logistics nodes, agro-processing hubs, warehouse towns, service centres, and consumption markets.

    How are small towns embedded within the urban process?

    1. Urban Continuum: Small towns operate fully within urban capitalist systems rather than existing as rural-urban intermediaries.
    2. Regulatory Gaps: Weaker regulation and minimal political scrutiny facilitate capital expansion.
    3. Cost Arbitrage: Lower land prices and pliable labour make small towns attractive for accumulation under stress conditions.

    Are small towns a better alternative to metropolitan urbanisation?

    1. No Emancipatory Promise: The article rejects the notion that small towns ensure inclusive or equitable growth.
    2. Urbanisation of Poverty: What unfolds is the relocation of rural deprivation into urban spaces.
    3. Informal Labour Dominance: Construction workers without contracts, women in home-based work, and youth in platform economies face insecurity and lack of social protection.
    4. Emerging Hierarchies: Towns such as Bhadol (Madhya Pradesh) and Raichur (Karnataka) show consolidation of power among real estate brokers, contractors, micro-financiers, and local intermediaries controlling land and labour.

    What does this reveal about India’s urban policy framework?

    1. Metro-Centric Bias: Flagship urban missions remain focused on large cities.
    2. Policy Failure: Small towns remain under-governed despite being central to contemporary urbanisation.
    3. Political Neglect: Absence of adequate scrutiny deepens informalisation and inequality.

    Conclusion

    India’s small towns are not emerging as alternatives to the metropolitan crisis but as its extension. They represent a new spatial frontier for capitalist accumulation under stress, marked by informal labour, weak regulation, and entrenched local hierarchies. Without policy recalibration, small-town urbanisation risks reproducing the very inequalities it was expected to resolve.

    PYQ Relevance

    [UPSC 2024] Why do large cities tend to attract more migrants than smaller towns? Discuss in the light of conditions in developing countries.

    Linkage: The question examines structural drivers of rural-urban migration in developing countries. It connects with debates on metro-centric growth, over-accumulation, and the emerging role of small towns as secondary but constrained urban destinations.

  • [3rd January 2026] The Hindu OpED: Transforming a waste-ridden urban India

    PYQ Relevance

    [UPSC 2018] What are the impediments in disposing of the huge quantities of discarded solid wastes which are continuously being generated? How do we remove safely the toxic wastes that have been accumulating in our habitable environment?

    Linkage: The question aligns with India’s urban solid waste crisis, where poor segregation, limited municipal capacity, and weak recycling systems hinder safe disposal. The article’s focus on circular economy, waste-to-energy, and regulated toxic waste management directly addresses environmental pollution mitigation.

    Mentor’s comment

    Urban India is facing a structural waste management crisis that threatens environmental sustainability, public health, and economic efficiency. At COP30 UNFCCC, global consensus reinforced the circular economy as a growth pathway, placing Indian cities at the center of climate, resource, and governance reforms. This article examines the scale of India’s urban waste challenge, structural bottlenecks, and the urgent need to transition from linear waste disposal to circular urban management.

    Introduction

    India’s urbanisation has been rapid but uneven, producing clean enclaves alongside waste-ridden cities. Despite flagship programmes such as Swachh Bharat Mission (SBM), urban waste management remains fragmented and inefficient. With waste volumes rising sharply and cities becoming hotspots of pollution and emissions, India must urgently adopt circular economy principles that minimise waste, recover resources, and integrate governance across sectors.

    Why in the News?

    At COP30 UNFCCC (Belém, November 2025), global leaders committed to a No Organic Waste, Now initiative and emphasised circularity as the pathway to inclusive growth and climate mitigation. Indian cities were explicitly urged to accelerate circular waste management. This marks a shift from traditional waste disposal approaches towards resource recovery, aligning climate commitments with urban governance reforms.

    Urban India and the Scale of the Waste Crisis

    Why is urban waste a growing structural challenge?

    1. Rapid urbanisation: Expanding cities generate waste volumes beyond municipal handling capacity.
    2. Environmental impact: Indian cities underperform global standards in clean air, water, and sanitation.
    3. Emission burden: Cities projected to generate 165 million tonnes of waste annually by 2030, emitting 41 million tonnes of greenhouse gases.
    4. Future risk: Waste burden projected to rise to 436 million tonnes by 2050 with urban population growth.
    5. Economic and health costs: Unmanaged waste contributes to disease, pollution, and productivity loss.

    From Linear Disposal to Circular Management

    Why must India move away from linear waste systems?

    1. Linear model limitation: Disposal-focused systems treat waste as an endpoint.
    2. Circular opportunity: Treats waste as a resource for energy, materials, and inputs.
    3. Policy objective: Minimising waste generation while maximising recovery of energy and materials.
    4. Feasibility: SBM Urban 2.0 aims for Garbage-Free Cities (GFC) by 2026, making circularity operational rather than aspirational.

    Plastic, Organic, and Construction Waste: Sectoral Realities

    How significant is organic waste in municipal streams?

    1. Waste composition: Over 50% of municipal waste is organic.
    2. Processing options: Composting and bio-methanation from household to large-scale plants.
    3. Energy recovery: Compressed Biogas (CBG) plants generate fuel and power.
    4. Efficiency gains: Complete combustion can yield energy equal to one-third of waste volume.

    Why is plastic waste the most difficult category?

    1. Environmental risk: Plastic poses long-term ecosystem and human health hazards.
    2. Segregation dependency: Recycling efficiency depends on source-level segregation.
    3. Infrastructure gap: Material Recovery Facilities require continuous upgrading.
    4. Market constraint: Plastic-derived fuels and cement inputs lack mature market linkages.

    Why is construction and demolition (C&D) waste a major blind spot?

    1. Volume: Generates ~12 million tonnes annually, concentrated in major cities.
    2. Cause: Unplanned construction in fast-growing urban centres.
    3. Disposal practice: Frequent roadside and vacant land dumping.
    4. Recycling gap: Existing capacity insufficient relative to waste generation.
    5. Resource loss: Reusable materials remain unsegregated and unprocessed.

    Water, Sanitation, and Circularity Linkages

    How does waste management affect urban water security?

    1. Causal linkage: Water security depends on treated wastewater and faecal sludge management.
    2. Policy integration: AMRUT and SBM focus on wastewater treatment and reuse.
    3. Resource constraint: India’s water stock insufficient to meet future urban demand.
    4. Circular solution: Recycling and reuse emerge as the only sustainable pathway.

    Governance and Implementation Challenges

    What hinders circular waste implementation in cities?

    1. Segregation gaps: Weak household-level compliance.
    2. Logistics inefficiency: Poor collection, aggregation, and processing chains.
    3. Market constraints: Recycled products face quality and demand limitations.
    4. Testing shortfalls: Inadequate monitoring and certification systems.
    5. Extended Producer Responsibility (EPR): Incomplete integration with construction and building laws.
    6. Institutional fragmentation: Weak inter-departmental coordination.
    7. Municipal capacity: Financial and technical resource shortages.

    Regulatory and Policy Interventions

    What regulatory steps are being strengthened?

    1. C&D Waste Management Rules, 2016: Levy charges on bulk waste generators.
    2. Environment (Construction & Demolition) Waste Rules, 2025: Enforced from April 1, 2026.
    3. State responsibility: Waste management, sanitation, and water under State List.
    4. Reuse mandate: Encourages use of treated wastewater in agriculture, horticulture, and industry.

    Behavioural and Economic Dimensions

    Why citizen participation is critical to circularity?

    1. Behavioural shift: Reuse requires conscious consumption changes.
    2. Profit clarity: Citizens and enterprises need economic incentives.
    3. Hierarchy challenge: Reduce-Reuse-Recycle difficult in consumer-driven markets.
    4. Technology role: Recycling supported by innovation and private enterprise.
    5. Urban transformation: Circularity enables cities to move away from landfill dependence.

    Conclusion

    India’s urban waste crisis is not merely a sanitation issue but a governance, resource, and climate challenge. Circular waste management offers a pathway to reduce emissions, conserve resources, and strengthen urban resilience. Achieving this requires regulatory enforcement, infrastructure investment, market creation for recycled products, and sustained citizen participation. Circularity must transition from policy intent to urban practice.
  • Swahid Diwas – PM’s Tribute 

    Why in the News

    The Prime Minister paid tribute on Swahid Diwas (10 December 2025), honouring the martyrs of the Assam Movement and reaffirming the Government’s commitment to strengthening Assam’s culture and ensuring holistic development of the state.

    About Swahid Diwas

    • Observed in Assam to commemorate the martyrs of the Assam Movement (1979–1985).
    • Recognises those who died during the agitation for identification, deletion and deportation of illegal migrants to protect the demographic, cultural and linguistic identity of the Assamese people.

    About the Assam Movement  

    • Period: 1979–1985.
    • Led by AASU (All Assam Students’ Union) and AAGSP.
    • Trigger: Concerns over illegal immigration from Bangladesh affecting Assam’s demographic balance.
    • Core demands:
      • Detection of illegal migrants
      • Updating electoral rolls
      • Preservation of Assamese culture and identity
    • Culmination: Assam Accord (1985) signed between AASU, AAGSP and the Government of India; provided mechanisms for identifying and addressing illegal immigration.
    UPSC Prelims Pointers

    • Swahid Diwas → linked to Assam Movement, not to national movements.
    • Assam Movement → resulted in Assam Accord 1985.
    • Led mainly by AASU and AAGSP.
    • Focus → illegal migration, cultural identity, demographic protection.
    • Term “Swahid” means martyr in Assamese.
    Satya Shodhak Samaj organized (2016)

    (a) a movement for upliftment of tribals in Bihar 

    (b) a temple-entry movement in Gujarat 

    (c) an anti-caste movement in Maharashtra 

    (d) a peasant movement in Punjab

  • Govt to begin year-long National Migration Survey from July 2026

    Why in the News?

    The Ministry of Statistics and Programme Implementation (MoSPI), through the National Statistics Office (NSO), will conduct the National Migration Survey 2026–27 from July 2026 to June 2027.

    About the National Migration Survey (2026–27):

    • Overview: A nationwide MoSPI–NSO survey conducted from July 2026 to June 2027 to measure India’s migration rates, patterns, and impacts.
    • Scope: Covers rural–urban and inter-state migration, including short-term, long-term, and return migration.
    • Coverage: Includes all states and UTs except inaccessible parts of the Andaman and Nicobar Islands.
    • Focus Area: Captures individual migration, which forms the bulk of movements in India.
    • Data Collected: Records income changes, employment status, health, education, housing, and remittance patterns.
    • Technology Use: Relies on digital handheld devices for accurate, real-time data entry.
    • Return Migration: Examines pandemic-driven and cyclical return flows as a separate category.
    • Policy Use: Enables evidence-based planning for jobs, welfare delivery, and urban development.
    • Historical Context:
      • Earlier Rounds: Dedicated migration surveys conducted in 1955, 1963–64, and 2007–08.
      • Data Gap: After 2007–08, migration information came only partially through PLFS 2020–21.
      • Gender Trend: Female migration mainly due to marriage; male migration largely employment-driven.
      • Need for Survey: First comprehensive national migration study in 17 years.

    Revised Definitions and Methodological Updates:

    • Short-Term Migrant: Updated to include stays of 15 days to less than 6 months for work or job search.
    • Broader Causes: Includes employment, education, marriage, displacement, climate stress, and economic distress.
    • Well-Being Indicators: Adds measures on post-migration stability, access to services, and living conditions.
    • Digital Verification: Uses GPS-enabled handheld devices for real-time validation.
    • Return Migration Category: Formalised to assess cyclical and post-pandemic movements.
    [UPSC 2024] Which one of the following statements is correct as per the Constitution of India?

    (a) Inter-State trade and commerce is a State subject under the State List.

    (b) Inter-State migration is a State subject under the State List.

    (c) Inter-State quarantine is a Union subject under the Union List.

    (d) Corporation tax is a State subject under the State List.


  • [11th October 2025] The Hindu Op-ed: The real need is a holistic demographic mission

    PYQ Relevance:

    [UPSC 2024] What is the concept of a ‘demographic winter’? Is the world moving towards such a situation? Elaborate.

    Linkage: Demographic shifts in border regions can exacerbate tensions, linking the topic to communalism and regionalism.  Illegal migration links directly to organized crime, such as human trafficking, drug trafficking (India’s proximity to illicit opium-growing states is a major concern mentioned in 2018 PYQ), and the potential penetration by external state and non-state actors.

    Introduction:

    On August 15, 2025, the Prime Minister had announced the launch of India’s Demographic Mission, a comprehensive national initiative aimed at monitoring, managing, and interpreting India’s demographic transitions.

    Initially projected as a mechanism to monitor undocumented immigration from Bangladesh and its demographic implications in India’s border regions, the mission’s vision extends to a broader national strategy for demographic management.

    The initiative comes at a time when India, now the world’s most populous nation, stands at a demographic crossroads, balancing its youth potential with emerging challenges of migration, ageing, inequality, and social security.

    What is the Demographic Mission?

    1. Launch: Unveiled by PM on 15 August 2025, it is a national initiative to monitor, manage, and interpret India’s demographic transitions in a holistic and strategic manner.
    2. Focus: Initially targeted at undocumented immigration from Bangladesh, addressing demographic and border-security implications through biometric systems, AI-based surveillance, and smart fencing.
    3. Expanded Mandate: Evolved into a comprehensive population governance framework, integrating security, social, and developmental objectives across ministries.
    4. Institutional Measures: Includes formulation of a National Refugee Law, implementation of the National Register of Indian Citizens (NRC), and demographic data integration across sectors.
    5. Policy Shift: Moves from population control to capability development, treating demographic potential as a source of economic strength and human capital formation.

    Socio-Political Dimensions of Demography:

    1. Reframing the Debate: Shifts the focus from population control to issues of equity, inclusion, and sustainability.
    2. Migration and Identity Politics: Highlights that migration and fertility transitions shape social hierarchies and electoral narratives, influencing policy priorities and identity construction.
    3. Institutional Sensitivity: Calls for embedding demographic awareness in governance, particularly in urbanisation, labour mobility, and welfare systems.
    4. Demographic Diversity as Strength: Treats India’s multi-ethnic and multi-lingual population as an asset for national integration rather than division.
    5. National Integration Framework: Positions demography as a foundation for inclusive federal policy and cohesive nation-building.

    Various Issues:

    1. Illegal Immigration: Ongoing influx from Bangladesh strains border security and regional demographics, complicating citizenship and resource distribution.
    2. Migration & Identity Exclusion: Internal migrants lack voting rights and welfare access due to “usual residence” definitions, leading to political marginalisation.
    3. Ageing and Longevity: Rising life expectancy necessitates rethinking retirement age, social security, and elder-care policies.
    4. Regional Inequality: Unequal spread of education, health, and skilling infrastructure widens developmental divides among states.
    5. Policy Insensitivity: Centralised, per capita-based planning ignores population composition, gender ratio, and dependency structures.
    6. Governance Centralisation: Demographic planning remains highly centralised, with limited state participation in design and monitoring.

    Various Solutions for Demographic Balance:

    1. Migration Reform: Provide legal recognition of migrant rights, ensure voting portability and welfare mobility, and promote balanced internal migration.
    2. Education and Skill Equity: Build uniform educational and vocational infrastructure and establish regional skill hubs to reduce capability gaps.
    3. Active Ageing Policies: Redefine retirement norms, expand financial security, and create avenues for productive ageing.
    4. Technological Integration: Deploy AI, GIS, and big-data platforms for real-time demographic mapping, analysis, and predictive planning.
    5. Decentralised Demographic Planning: Create federal demographic councils linked with NITI Aayog for region-specific strategies.
    6. Demographic Sensitisation: Mainstream population literacy and demographic research in policymaking, academia, and public discourse.

    Global Context and Strategic Positioning:

    1. Youth Advantage: With a median age of 29 years, India stands out amid ageing societies like Japan, Europe, and China.
    2. Human Capital Vision: The mission aligns with India’s aspiration to become the “Skill Capital of the World,” enhancing global labour competitiveness.
    3. Geopolitical Relevance: Integrates population policy into national security and global strategy, positioning demography as a tool of soft power and developmental diplomacy.
    4. Long-Term Significance: By combining population management, human development, and digital governance, the mission redefines India’s demographic policy for the 21st century — linking security, sustainability, and sovereignty.

    Way Forward:

    1. Institutionalise Demographic Policy: Establish a National Demographic Council for cross-ministerial coordination.
    2. Focus on Human Capital: Prioritise investments in education, health, and skill ecosystems over mere population management.
    3. Protect Migrant Rights: Legislate a Migrant Workers’ Charter to ensure political and social inclusion.
    4. Reform Social Security: Develop portable pension and healthcare systems adaptable to mobility and longevity trends.
    5. Adopt Data Ethics: Balance demographic surveillance with privacy protection and civil liberties.
    6. Mainstream Demographic Literacy: Integrate population studies into governance, academia, and public administration.
  • Particularly Vulnerable Tribal Groups (PVTGs)

    Why in the News?

    The Ministry of Tribal Affairs (MoTA) has written to the Registrar General and Census Commissioner of India (RGI) to enumerate PVTGs separately in Census 2027.

    Who are the PVTGs?

    • Overview: Sub-category of Scheduled Tribes (STs) marked by stagnant or declining population, geographical isolation, pre-agrarian subsistence, economic backwardness, and very low literacy.
    • Origin: Concept recommended by the Dhebar Commission (1960–61) noting inequalities among STs.
    • Historical Evolution:
      • Fourth Five-Year Plan (1969–74): creation of Primitive Tribal Groups (PTGs).
      • Fifth Five-Year Plan (1974–79): 52 groups identified.
      • 2006: PTGs renamed as PVTGs.
    • Present Status: 75 PVTGs recognized across 18 states and 1 UT (Andaman & Nicobar Islands).
    • Characteristics: Small numbers, remote habitation, pre-agricultural practices, hunting and gathering reliance, and in some cases zero or negative population growth.

    Enumeration and Population Estimates:

    • 2011 Census Status: PVTGs were NOT separately enumerated, counted under the broader ST category.
    • Special Cases:
      • 2011 Census: Baigas counted separately, while Abujh Marias, Bharias, Hill Korbas, Kamars subsumed under STs.
      • 2013: Abujh Maria and Hill Korba explicitly added to Chhattisgarh’s ST list via legislation.
    • Recent Estimates: 2023 PM JANMAN survey estimated the population at 47.5 lakh.
      • Madhya Pradesh: 13.22 lakh (highest).
      • Maharashtra: about 6.7 lakh.
      • Andhra Pradesh: about 5.18 lakh.
    • Largest and Smallest:
      • Largest: Baiga of Madhya Pradesh with about 4.14 lakh.
      • Smallest: Sentinelese of Andaman & Nicobar Islands with just 15 individuals.
    • Micro Groups: In 2011, 13 PVTGs had populations below 1,000 including Jarawa, Onge, Sentinelese, Shompen (A&N Islands), Raji (Uttarakhand), Kota (Tamil Nadu), Birhor (Odisha/Bihar), Kamar (Madhya Pradesh), and others.
    [UPSC 2019] Consider the following statements about Particularly Vulnerable Tribal Groups (PVTGs) in India:

    1. PVTGs reside in 18 States and one Union Territory.

    2. A stagnant or declining population is one of the criteria for determining PVTG status.

    3. There are 95 PVTGs officially notified in the country so far.

    4. Irular and Konda Reddi tribes are included in the list of PVTGs.

    Which of the statements given above are correct?

    Options: (a) 1, 2 and 3 (b) 2, 3 and 4 (c) 1, 2 and 4* (d) 1, 3 and 4


  • National Population Register (NPR)

    Why in the News?

    The Government of India recently clarified in the Lok Sabha that no final decision has been taken regarding the updation of the National Population Register (NPR) during the upcoming Population Census 2027.

    What is the National Population Register (NPR)?

    • Overview: NPR is a register of “usual residents” in India—individuals who have lived in an area for 6 months or intend to stay for the next 6 months.
    • Conducted by: Office of the Registrar General of India (RGI), Ministry of Home Affairs.
    • Legal Basis: Prepared under the Citizenship Act, 1955 and Citizenship Rules, 2003.
    • Mandatory Nature: Registration in NPR is compulsory for all usual residents.
    • Exclusion: Assam is excluded as it has completed the National Register of Citizens (NRC) process.
    • Historical Background:
      • First Created: In 2010 during the House Listing phase of Census 2011.
      • Updated: Again in 2015–16 via door-to-door survey.
      • Database Size: Contains data of around 119 crore residents.
      • Aadhaar Link: Biometric data collection is linked to Aadhaar; however, ration card data collection was dropped in the 2020 plan.
      • Current Status: NPR update plans (2020) are on hold. NPR’s priority has reduced due to Aadhaar’s expanded utility in benefit delivery.
    • Scope and Data Collected:
      • Coverage Levels: Conducted at local, sub-district, district, state, and national levels.
      • Demographic Data: Includes name, age, gender, relationship, marital status, etc.
      • Biometric Data: Sourced via Aadhaar enrolment—fingerprints, iris scan, and photo.

    NPR vs National Register of Citizens (NRC):

    Feature National Population Register (NPR) National Register of Citizens (NRC)
    Purpose Record of all usual residents Register of Indian citizens
    Coverage Includes citizens and non-citizens Only Indian citizens
    Legal Basis Citizenship Act, 1955 & Rules (2003) Citizenship Rules (2003)
    Primary Use Welfare schemes, demographic data Citizenship verification
    Mandatory? Yes Not uniformly across India


    [UPSC 2009] Consider the following statements:

    1. Between Census 1951 and Census 2001, the density of the population of India has increased more than three times.

    2. Between Census 1951 and Census 2001, the annual growth rate (exponential) of the population of India has doubled.

    Which of the statements given above is/are correct?

    Options: (a) 1 only (b) 2 only (c) Both 1 and 2 (d) Neither 1 nor 2*