💥Join UPSC 2027,2028 Mentorship (August Batch) + XFactor Notes & Microthemes PDF

GS Paper: Poverty & Development Issues

  • [10th August 2024] The Hindu Op-ed: Refugee rights, the gendered nature of displacement

    [10th August 2024] The Hindu Op-ed: Refugee rights, the gendered nature of displacement

    PYQ Relevance:

    Mains:

    Q1 “Refugees should not be turned back to the country where they would face persecution or human right violation”. Examine the statement with reference to ethical dimension being violated by the nation claiming to be democratic with open society.  (UPSC IAS/2021) 

    Q2 Cross-border movement of insurgents is only one of the several security challenges facing the policing of the border in North-East India. Examine the various challenges currently emanating across the India-Myanmar border. Also, discuss the steps to counter the challenges. (UPSC IAS/2019) 

    Note4Students: 

    Mains: Conventions and Rights;

    Mentor comments:  By the end of June 2023, 110 million people worldwide were forcibly displaced due to persecution, conflict, violence, and severe disruptions to public order. This included 36.4 million refugees (30.5 million under UNHCR and 5.94 million Palestine refugees under UNRWA), 62.1 million internally displaced persons, 6.08 million asylum seekers, and 5.6 million Venezuelans needing protection. Additionally, millions of stateless individuals lack nationality and basic rights. In the first half of 2023, 90% of new displacements arose from major crises in Afghanistan, the DRC, Latin America, Myanmar, Somalia, Sudan, and Ukraine.

    Let’s learn!

    __

    Why in the News? 

    Armed conflict, violence, human rights abuses, and persecution force millions globally to escape their homes and homelands, resulting in their status as ‘displaced people’.

    Challenges Faced by Female Refugee 

    • India as a Refugee-Receiving Nation: India has hosted over 200,000 diverse refugee groups since independence. As of January 31, 2022, 46,000 refugees and asylum-seekers were registered with UNHCR India, with 46% being women and girls.
    • Gendered Responsibilities: Women and girls in refugee populations are disproportionately burdened with caregiving responsibilities for children, the elderly, and family sustenance. They are often the last to flee conflict zones, carrying the additional responsibility of managing family survival.
    • Impact on Physical and Mental Health: The gendered nature of displacement severely impacts the physical and mental well-being of refugee women. They face numerous stressors, including the loss of partners and children, hardships of camp life, altered family dynamics, and reduced safety.
    • Increased Risk of Gender-Based Abuse: Refugee women are exposed to heightened risks of gender-based violence, including transactional sex, due to prolonged conflict, disrupted social support systems, and socio-economic challenges.
    • Psychological and Psychosocial Conditions: Displaced women are particularly susceptible to psychological disorders such as PTSD, anxiety, and depression. They are twice as likely to experience PTSD and four times more likely to suffer from depression compared to male counterparts. For example, a study in Darfur, Sudan, found 72% of displaced women affected by PTSD and distress.

    Conventions and Rights  

    • UNCRPD Recognition:
      • The UN Convention on the Rights of Persons with Disabilities (UNCRPD) recognizes ‘psychosocial disability’ as long-term mental or intellectual impairments that hinder full participation in society.
      • Article 6 of the UNCRPD mandates protection against multiple discrimination faced by women and girls with disabilities and ensures their full enjoyment of human rights.
    • India’s Ratification and Legislation:
      • India ratified the UNCRPD and enacted the Rights of Persons with Disabilities Act, 2016 (RPWDA).
      • While the term ‘psychosocial disability’ is not explicitly used in Indian law, “mental illness” is recognized and covered under the RPWDA.
      • The RPWDA guarantees various rights to persons with disabilities, including the right to health care (Section 25) and equal rights for women with disabilities (Section 4).
    • Absence of Legal Framework: India is not a signatory to the 1951 Refugee Convention and its 1967 Protocol. There is no specific domestic legislation addressing refugees, particularly those with disabilities.
    • Right to Life and Health: The Supreme Court of India has upheld the right to life under Article 21, which includes the right to health, for refugees.

    Way forward: 

    • Enact Comprehensive Legislation: Need to introduce a uniform legal framework that specifically addresses the rights and protections of refugees, with provisions for those with disabilities, aligning with international commitments like the 2030 Agenda.
    • Inclusive Policy Implementation: The government should integrate refugees with disabilities into existing and new national policies and programs, ensuring accessible services and participation in decision-making processes.
  • Counting the ‘poor’ having nutritional deficiency       

    Why in the news?

    The National Sample Survey Office has released the Household Consumption Expenditure Survey (HCES) report for 2022-23, along with public access to unit-level data on household expenditures.

    What does the recent NSSO Report tell us?

    • The report utilizes various definitions of poverty established by past committees, with the poverty line (PL) being anchored to calorie norms of 2,400 kcal for rural and 2,100 kcal for urban areas as per the Lakdawala Committee. The Rangarajan Committee’s approach considers broader normative levels, including non-food expenses.
    • The average per capita calorie requirement (PCCR) is estimated at 2,172 kcal for rural and 2,135 kcal for urban populations. The report highlights that the average per capita calorie intake (PCCI) for the poorest segments falls significantly below these requirements, indicating nutritional deficiencies.
    • The total monthly per capita consumption expenditure (MPCE) thresholds are set at ₹2,197 for rural and ₹3,077 for urban areas, with proportions of the population identified as ‘poor’ being 17.1% in rural and 14% in urban contexts. If non-food expenditures for the poorest 10% are considered, these thresholds rise, increasing the proportion of the deprived.

    Approach for measurement is the Issue:

    • Defining Poverty: The report defines the poor based on MPCE, which is linked to the ability to purchase essential food and non-food items.
      • The reliance on MPCE does not adequately address nutritional needs. While the poverty line is linked to the ability to purchase food and non-food items.
    • Caloric Requirement Calculation: The PCCR is derived from the ICMR-National Institute of Nutrition’s latest recommendations, weighted by the population distribution across age-sex-activity categories.
      • The ICMR-National Institute of Nutrition’s (ICMR-NIN) recommendations for caloric requirements in India are derived from the Recommended Dietary Allowances (RDA) for Indians.
      • The RDA does not adequately account for regional and cultural differences in dietary habits and food availability.
    • Fractile Class Analysis: Households are categorized into 20 fractile classes based on MPCE, allowing for the calculation of average PCCI and MPCE for each class.
      • Each fractile class represents 5% of the population, allowing for a detailed understanding of expenditure distribution and nutritional intake variations within the population
      • MPCE reflects consumption patterns but does not capture the full spectrum of economic well-being or deprivation.
    • State-Specific Adjustments: The all-India thresholds are adjusted for regional price differences to derive state-specific MPCE thresholds.
      • The methodology for deriving state-specific MPCE thresholds relies on regional price indexes, which can vary significantly in their construction and accuracy.

    Recommendations for Improving Nutritional Levels (Way Forward) 

    • Nutritional Schemes: Govt. needs to develop and expand schemes specifically aimed at improving the nutritional intake of the poorest households.
    • Awareness and Education: Govt. should increase awareness about nutrition and healthy eating practices among low-income households.
    • Subsidized Food Programs: Need to enhance access to subsidised food items to ensure that households can meet their caloric and nutritional needs.
    • Monitoring and evaluation: Govt. should establish robust mechanisms to monitor the effectiveness of nutritional interventions and adjust strategies as necessary.

    Conclusion: ​​The NSSO HCES 2022-23 report reveals significant nutritional deficiencies among the poorest. To align with SDG goals, expanding targeted nutritional schemes, subsidized food programs, and robust monitoring is essential.

    Mains PYQ: 

    Q How far do you agree with the view that the focus on the lack of availability of food as the main cause of hunger takes the attention away from ineffective human development policies in India? (2013)

  • For the social sector, it is old wine in an old bottle 

    Why in the News?

    Budget 2024 maintains the same approach as previous years regarding social sector allocations.

    Decreasing allocations in the Budget for social sector schemes

    • Education Sector: The allocations for school education increased by ₹5,000 crore and for higher education by ₹3,000 crore. The increased recoveries from fees and self-financing schemes suggest a shift towards cost recovery in educational institutions.
    • Health Sector: The allocation for the Department of Health and Family Welfare rose by only ₹1,500 crore.
      • Food Subsidy: There is a limited increase in food subsidies despite rising economic costs and the need to update coverage based on the latest population figures.
    • Shift in Approach: The government giving greater emphasis on cost-effectiveness and privatization in education and health, shifting focus towards contributory schemes like the Atal Pension Yojana.

    Social Sector Schemes in Budget 2024-25

    • Social Protection Schemes:
        • POSHAN Scheme: There is a slight increase from ₹11,600 crore to ₹12,467 crore, but still less than the actual expenditure in 2022-23.
        • Saksham Anganwadi Scheme: The allocation increased to ₹21,200 crore from ₹20,554 crore, but no increase in salaries for Anganwadi workers or honorarium for mid-day meal cooks.
    • Maternity and Social Assistance:
        • Samarthya Scheme: The budget reduced to ₹2,517 crore from ₹2,582 crore. The PMMVY scheme’s maternity benefits have remained unchanged since 2017.
        • NSAP: Allocation for social security pensions remains unchanged at ₹9,652 crore, reducing real coverage and value.

    Schemes for the Unemployed

        • The ‘Prime Minister’s Package for Employment and Skilling’ includes government-sponsored internships, formalization of jobs through incentives for EPFO enrolments, and skill-development programmes
        • An allocation of ₹2 lakh crore over five years for the employment package, linked to industry response

    Schemes for Street Vendors

      • The PM SVANidhi Scheme (PM Street Vendor’s AtmaNirbhar Nidhi) aims to benefit over 50 Lakh street vendors across India
      • All lending institutions, including NBFCs, are participating in the scheme to provide affordable loans to street vendors

    Employment Challenges

    • Stagnant Wages and Dampened Demand: The Indian economy faces significant challenges with stagnant wages, which affect consumer demand. This stagnation can hinder overall economic growth and employment generation.
    • Reliance on the Private Sector for Job Creation: The government is increasingly looking to the private sector to address employment challenges.
      • Initiatives like the ‘Prime Minister’s Package for Employment and Skilling’ aim to incentivize private sector job creation through government-sponsored internships and skill development programs.
    • Limited Budgetary Allocations: The budgetary allocations for employment-related schemes are limited, with the entire employment package amounting to ₹2 lakh crore over five years.
    • Focus on Supply-Side Solutions: The current approach emphasizes supply-side measures to incentivize the private sector rather than addressing the underlying demand-side issues, such as low consumer spending and economic uncertainty.

    Way forward: 

    • Enhance Social Sector Investments: The government should significantly increase budget allocations for critical social sector schemes, particularly in education, health, and social protection.
    • Comprehensive Employment Strategy: Need to develop a holistic approach to employment that addresses both supply and demand-side issues.
  • [11th July 2024] The Hindu Op-ed: India’s Demographic journey of hits and misses

    PYQ Relevance:

    Mains: 

    Q) What are the salient features of the National Food Security Act, of 2013? How has the Food Security Bill helped in eliminating hunger and malnutrition in India? (UPSC IAS/2021)
    Q) Discuss the main objectives of Population Education and point out the measures to achieve them in India in detail.  (UPSC IAS/2020)

    Prelims:
    India is regarded as a country With a “Demographic Dividend” This is due to (UPSC IAS/2011)
    (a) Its high population in the age group below 15 years.
    (b) Its high population in the age group of 15-64 years.
    (c) Its high population in the age group above 65 years.
    (d) Its high total population.

    Note4Students: 

    Prelims: World Population Day; Demographic Dividend;

    Mains:  Demographic Dividend; Poverty; Mortality; Food Security;

    Mentor comment: Over the decades, the world has seen significant demographic changes, with declining fertility rates and increasing life expectancy globally. India has also made notable progress, with fertility rates falling below replacement level and improvements in maternal and child health indicators. However, population dynamics continue to pose challenges that require attention and proactive measures. As the world approaches the 2030 target for the Sustainable Development Goals, understanding a country’s population trends is crucial to tailoring solutions and driving progress.

    Let’s learn!

    __

    Why in the news? 

    The day July 11, was established by the United Nations as the ‘World Population Day’ in 1989, to raise awareness about global population issues and their impact on development, the environment, and individual well-being.

    World Population – Then and Now:
    1. The decades of the 1960s and 1970s were scary as the global population was growing at a yearly rate of 2%. 
    2. The Total Fertility Rate of the world has dropped from around five children per woman in 1950, to 2.3 children per woman in 2023. 

    About Malthus Theory of Population
    1. Thomas Malthus’ Theory of Population, proposed in 1798, posited that population growth would outpace food production, leading to widespread famine and poverty.
    2. He believed population grows exponentially while food production increases linearly. However, advancements in agriculture and technology have prevented the catastrophic outcomes he predicted.

    India’s population dynamics – The main components:

    • Fertility: According to the National Family Health Survey (NFHS)-5, India’s total fertility rate (TFR) decreased from 3.4 to 2 between 1992 and 2021, dropping below the replacement level of 2.1. 
    • Mortality: There has been a significant drop in the mortality rate as well. The average life expectancy of Indians has also increased over time.
    • Aging Population:  India is experiencing a demographic shift, towards an aging population. According to the 2011 Census, individuals aged 60 years and above constituted 8.6% of the total population. The figure is projected to rise to 19.5% by 2050. 
    • Migration: 
      • Urbanization: Rapid Rural-to-Urban migration is straining urban infrastructure.
      • Gender Equality: Women’s labor force participation and political representation are crucial for sustainable development
    But what do these changing dynamics signify?

    India’s population dynamics are intertwined with its ‘development’ scenario. The reduction in fertility signifies a transition toward smaller family norms.  It has many implications for the Social Development as follows:

    Demographic Dividend: A smaller dependent population can lead to a larger working-age population, potentially boosting economic growth.
    Healthcare and Living Standards: Declining mortality rates and increasing life expectancy indicate improvements in healthcare and living standards.
    Population Ageing: Requires long-term planning for geriatric care and social security benefits.
    Gender Equality: Women’s labour force participation, which is straggling, their notable absence from Political representation, and their unending plight within society. Ensuring women’s rights and participation is essential for sustainable development.

    India’s Journey towards the Sustainable Development Goals (SDGs)

    • Poverty Reduction (SDG 1)
      • The population living below the poverty line reduced from 48% to 10% between 1990 and 2019.
      • Government Initiatives:
      • Mahatma Gandhi National Rural Employment Guarantee Act (MGNREGA) was critical in addressing rural poverty.
      • Janani Suraksha Yojana (2005) increased institutional deliveries and reduced health expenditures for poor families.
    • Food Security and Nutrition (SDG 2)
      • India became self-sufficient in crop production after the Green Revolution hence, the proportion of the population suffering from hunger reduced from 18.3% in 2001 to 16.6% in 2021. However, India still contributes a third of the global burden of malnutrition.
      • Government Initiative:
      • POSHAN Abhiyaan (2018) aims to improve nutrition, but achieving ‘Zero Hunger’ by 2030 remains challenging.
    • Health Improvements (SDG3)
      • Maternal Mortality Rate (MMR) decreased from 384.4 in 2000 to 102.7 in 2020.
      • Under-five mortality rate and infant mortality rate significantly reduced post-2000s. Improvements in quality and coverage of healthcare, but still need to reach targets.

    What needs looking into?

    • Population Dynamics: India needs to harness demographic dividend by creating job opportunities for the youth by addressing the rising burden of non-communicable diseases (NCDs) and strengthening social safety nets.
    • Nutrition: The government needs to increase budgetary allocation for health and nutrition sectors and strengthen nutrition programs to address malnutrition.
    • Gender Equality: Empowering socio-economically the section of vulnerable women and adopting a gender-equal approach in policy and development initiatives.
    • Collaborative Approach: Encouraging a multi-sectoral collaboration and ensuring a strong political will to drive progress efficiently.
  • Declining Poverty Ratio: A Continuing Trend

    Why in the News? 

    The National Sample Survey Organization’s and Household Consumption Expenditure Survey (2022-23) prompted researchers to estimate Poverty and Inequality trends, highlighting data comparability and measurement issues.

    Present trends of Poverty and Inequality in Indian Society: 

    1. Poverty Declined:

    • Poverty ratios declined from 29.5% in 2011-12 to 10% in 2022-23 (1.77% points per year) based on the Rangarajan Committee’s poverty lines.
    • Poverty ratios declined from 21.9% in 2011-12 to 3% in 2022-23 (1.72% points per year) based on the Tendulkar Committee’s poverty lines. Earlier period estimates showed a decline from 37.2% in 2004-05 to 21.9% in 2011-12 (2.18 percentage points per year).

    2. Inequality Declined :

    • Subramanian’s estimates indicate the Gini coefficient declined from 0.278 to 0.269 for rural areas and from 0.358 to 0.318 for urban areas between 2011-12 and 2022-23.
      • The Gini coefficient measures the inequality among the values of a frequency distribution, such as levels of income.
    • Bansal et al show similar trends: Gini coefficient for rural areas declined from 0.284 to 0.266, and for urban areas from 0.363 to 0.315 over the same period. (significant decline in urban inequality compared to rural areas between 2011-12 and 2022-23)

    Back2Basics:

    Lakdawala Committee (1993):

    • It disaggregated poverty lines into state-specific poverty lines.
    • Poverty lines: same as Alagh’s committee of 1979. (2400 kcal per capita per day for rural areas and 2100 kcal per capita per day in urban areas.)
    • Poverty lines were updated using the Consumer Price Index of Industrial Workers (CPI-IW) in urban areas and the Consumer Price Index of Agricultural Labour (CPI-AL) in rural areas rather than using National Accounts Statistics.
    • Estimates of poverty: 54.9% (All India)

    Tendulkar Committee (2009):

    • Constituted: In 2005
    • Submitted report: 2009.
    • Recommendations:
      • Firstly, the incorporation of private expenditure on health and education while estimating poverty.
      • Secondly, to shift away from two separate poverty line baskets (PLBs) (for rural and Urban) towards a uniform all-India PLB.
      • Thirdly, to shift away from Uniform Reference Period (URP) based estimates towards Mixed Reference Period (MRP) based estimates.
      • Fourthly, A change in the price adjustment procedure to correct spatial (across regions) and temporal (across time) issues with price adjustment.
    • It concluded that India’s poverty line was Rs. 446.68 per capita per month in rural areas and Rs. 578.80 per capita per month in urban areas in 2004-05.
    • Estimates of poverty: 37.2 % (All India)

    C. Rangarajan Committee (2014):

    • Constituted: 2012
    • Submitted report: 2014.
    • Used a method of calculating urban and rural poverty separately (similar to the Lakdawala committee).
    • Took into account both food and non-food items of expenditure.
    • Used the MMRP method instead of MRP.
    • Poverty was estimated on monthly expenditure of a family of five (and not individual as in case of the Tendulkar committee). All three, i.e., Calorie + protein + Fat intake values were taken into account to estimate poverty.
    • Estimates of poverty: 29.5%
    • Poverty lines: Rural- Rs. 32; Urban- Rs.47


    Methods to Estimate Absolute Poverty by NSSO:

    Poverty estimation in India is now carried out by NITI Aayog’s task force through the calculation of poverty line based on the data captured by the NSSO under the Ministry of Statistics and Programme Implementation (MOSPI). It uses the following 3 methods:

    • Uniform Recall (reference) Period (URP): Under URP, consumption data for all items are collected for a 30-day recall period. When URP is applied, the households are surveyed about their consumption in the last 30 days preceding the date of the survey.
      • Until 1993-94, the poverty line estimated by NSSO was based on URP.
    • Mixed Recall (reference) Period (MRP): MRP takes into account consumption expenditure for five non-food items (clothing, footwear, durable goods, education, and institutional medical expenses) for a 365-day recall period, and consumption data for the remaining items are collected for a 30-day recall period.
    • Modified mixed reference period (MMRP): The Rangarajan Committee in its 2014 report recommended MMRP as a more suitable method to measure poverty as compared to URP and MRP methods. The World Bank in 2015 also supported the idea of shifting from MRP to MMRP. Under MMRP there are 3 reference periods as follows:
      • The 365-day recall period is used for clothing, footwear, education, institutional medical care, and durable goods.
      • The 7-day recall period for edible oil, egg, fish and meat, vegetables, fruits, spices, beverages, refreshments, processed food, paan, tobacco and intoxicants and
      • The 30-day recall period for the remaining food items, fuel, and light, miscellaneous
        good and services including non-institutional medical, rents, and taxes.

    Measurement issues regarding Poverty Lines and Consumption Expenditure:

    • Shift Away from Calorie Norm-based Poverty Line: The Tendulkar Committee recognized the inadequacy of a calorie norm-based poverty line. Instead, the Tendulkar Committee indirectly utilized calorie norms by adopting the urban poverty line based on the Lakdawala Committee’s methodology, which included calorie norms.
    • Need for new Consumption Basket: The Rangarajan Group emphasized the need for a new consumption basket that addresses both adequate nourishment and essential non-food items, alongside behaviorally determined non-food expenditure.
      • Estimating this new poverty basket required a fresh approach rather than simply updating an old basket with new prices.
    • Incomplete Capture of Public Expenditure: Despite efforts to impute values for public expenditure items, the imputation process captured only a fraction of the total public expenditure on subsidized or free items.
    • Complexity in Poverty Measurement: There is no universally agreed-upon method for measuring poverty, leading to variability in estimates.

    Constitutional provisions related to eliminating inequalities:

    i. [Article 38 (2) ]: Obligation of the State ‘to endeavour to eliminate inequalities in status, facilities and opportunities’ amongst individuals and groups of people residing in different areas or engaged in different vocations.
    ii. [Article 46]: Obligation of State ‘to promote with special care’ the educational and economic interests of ‘the weaker sections of the people’ (besides Scheduled Castes and Scheduled Tribes).

    Conclusion: Given the inadequacy of calorie norm-based poverty lines, as recognized by the Tendulkar Committee, there is a need to adopt more effective and real-time approaches that will consider evolving consumption patterns.

    Mains PYQ:

    Q “The incidence and intensity of poverty are more important in determining poverty based on income alone”. In this context analyse the latest United Nations Multidimensional Poverty Index Report.(UPSC IAS/2020)

  • For government schemes, a path to dignity for the poor

    BrightCareerMaker

    Key Highlights:

    • India’s Direct Benefit Transfer (DBT) system lauded globally as a “logistical marvel.”
    • DBT utilizes digital infrastructure to directly transfer government scheme benefits, covering 310 schemes across 53 ministries.
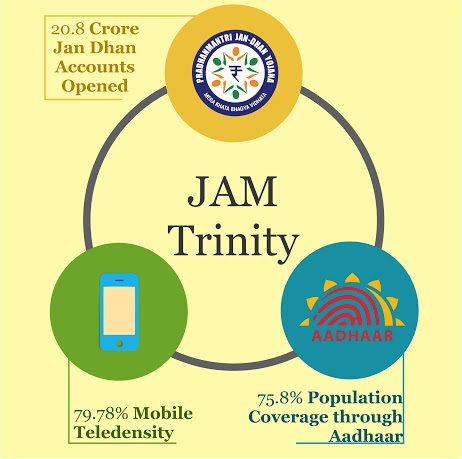
    • The JAM Trinity (Jan Dhan, Aadhaar, and Mobile) post-2017-18 maximized DBT’s impact.

    Dignity of the Poor:

    • DBT’s overlooked benefit is its preservation of the dignity of the poor.
    • Without corruption or leakages, DBT eliminates the need for the poor to parade for government benefits.
    • Shift in approach—government benefits reaching the poor directly without intermediaries.

    Poverty Perspectives and Historical Context:

    • Discussion on poverty perspectives, referencing Michael Young’s “The Rise of The Meritocracy.”
    • Challenge to the prevailing view that poverty is an individual’s fault, offering an alternative, rights-based approach.
    • Advocacy for understanding poverty from an individual rights perspective and addressing historical contexts.

    Rights-Based Approach to Poverty:

    • Recognition of basic security rights for citizens regarding food, shelter, and health.
    • Emphasis on shared societal responsibility for poverty, especially by the rich and elite.
    • Contrast with technical solutions, highlighting the need to work with the poor.

    Preserving Dignity in Design:

    • Importance of not just providing benefits but also considering how they are delivered.
    • DBT as a mechanism that ensures rightful benefits reach the poor while preserving their dignity.
    • Elimination of the poverty parade with the government reaching the poor.

    Replicating DBT Success:

    • Suggestion to replicate the DBT design in other areas, with a focus on the judiciary.
    • Reference to the judiciary’s challenges and an appeal to ensure justice reaches the poor efficiently.
    • Call for collective efforts to address complex problems.

    Challenges:

    • Unquantifiable nature of preserving dignity makes it challenging to measure its impact.
    • The need for broader societal shifts in perspectives on poverty and shared responsibilities.

    Key Phrases:

    • JAM Trinity (Jan Dhan, Aadhaar, and Mobile)
    • Poverty parade
    • Rights-based approach
    • Shared societal responsibility
    • Technical solutions vs. working with the poor
    • Veil of ignorance (Rawlsian perspective)
    • Dignity preservation in program design

    Critical Analysis:

    • Emphasis on the overlooked aspect of preserving dignity brings a unique perspective.
    • The article challenges prevailing views on poverty, advocating for a rights-based approach.
    • DBT is presented as a successful model, but challenges of replicating its success are acknowledged.
    • The article connects poverty perspectives with societal responsibilities and justice delivery.

    Key Examples and References for quality enrichment of mains answers: 

    • Michael Young’s “The Rise of The Meritocracy”
    • The Tyranny of Experts by William Easterly
    • Reference to the judiciary’s challenges and the appeal of the first woman tribal President.

    Key Data and Facts:

    • 310 government schemes across 53 ministries utilize DBT.
    • Estimated savings of 1.14% of GDP attributed to DBT.
    • 79,813 cases pending before 34 judges in the judiciary.

    Key Terms:

    • Direct Benefit Transfer (DBT)
    • JAM Trinity
    • Rights-based approach
    • Poverty parade
    • Veil of ignorance
    • Shared societal responsibility

    Way Forward:

    • Advocacy for applying DBT’s success in other sectors, particularly the judiciary.
    • Acknowledgment of complexity but a call for collective efforts to address challenges.
  • India’s Remarkable fight against Poverty

    What’s the news?

    • On the 77th Independence Day of our nation, Prime Minister Narendra Modi addressed the nation from the historic Red Fort in Delhi, heralding a remarkable achievement in the fight against poverty.

    Central idea

    • The Prime Minister’s announcement highlighted the lifting of 135 million people from poverty in five years, as confirmed by the MDPI from NITI Aayog. This aligns with UNDP’s estimate of 415 million lifted out of poverty between 2005–06 to 2019–21, a commendable milestone in India’s history.

    Remarkable Achievements in the Fight Against Poverty

    • 135 Million Uplifted: Between 2015-16 and 2019-21, 135 million people were lifted out of poverty.
    • 415 Million Escaped Poverty: From 2005–06 to 2019–21, India lifted 415 million people out of poverty (MDPI).
    • Extreme Poverty Reduced: Extreme poverty decreased from over 80% to around 15% based on the MDPI.
    • Leading Rice Exporter: Successful policies resulted in India becoming the largest exporter of rice.
    • Top Producer of Milk and Cotton: India emerged as the largest producer of milk (222 MT) and cotton (39 million bales).
    • Infant Mortality Decreased: Infant mortality decreased significantly from 57% in 2005–06 to 35% in 2019–21.

    Factors Behind This Achievement

    • Economic Policy Transition (1991): The shift to a market-oriented economy in 1991 generated substantial resources for poverty reduction.
    • Strategic Government Initiatives: Targeted policies like the PM Garib Kalyan Yojana directly impact poverty reduction by providing essential commodities.
    • Education and Skill Development: Prioritizing education and skill enhancement empowers individuals, grants access to improved livelihood opportunities, and contributes to child nutrition.
    • Agricultural Reforms (Green Revolution): Innovations like the Green Revolution augmented rural incomes, lifting communities out of poverty by enhancing agricultural productivity.
    • Women’s Empowerment: Focusing on women’s education and participation correlates with positive effects on family welfare and economic growth, as exemplified by proposals to train women in self-help groups for drone operation.
    • Technological Advancements: Technological breakthroughs have streamlined service delivery, as seen in the provision of commodities through the PM Garib Kalyan Yojana and enhanced agricultural productivity via the gene revolution in cotton.
    • Global Integration: Embracing globalization and trade expanded economic horizons, fostering growth, job creation, and effective poverty reduction.
    • Resilience and Adaptability: Society’s adaptability to changing economic conditions bolstered resilience against poverty, preventing further economic deterioration.
    • Public-Private Partnerships: Collaborations between the government and the private sector magnified poverty reduction efforts, as evident from Punjab Agricultural University’s role in the Green Revolution.
    • Civil Society Participation: Non-governmental organizations and civil society groups complemented government initiatives, actively contributing to poverty alleviation and service delivery.
    • Data-Driven Decision Making: Utilizing data to identify poverty pockets and target interventions precisely enhances the efficacy of poverty reduction strategies.
    • Foreign Exchange Reserves: India’s growth in foreign exchange reserves from $1.4 billion in July 1991 to approximately $600 billion bolstered the economy against external shocks, enhancing its ability to sustain poverty alleviation efforts.

    Challenges and Concerns

    • Child malnutrition: Despite progress, 32% of children are underweight and 35% are stunted, according to the NFHS-5.
    • Climate Change Impact: Increasing extreme weather events due to climate change pose a threat to food security and poverty alleviation.
    • Gender Gap in the Labor Force: Women’s participation rate in the labor force remains low at around 30% (2021–22).
    • Quality Education Gap: Ensuring quality education and skill formation for women beyond the 12th grade is a challenge.
    • Access to Nutritious Food: Ensuring equitable access to nutritious food, especially for vulnerable populations, is a challenge.

    Way Forward: A Blueprint for Transformation

    • Education Empowerment: Strengthen education programs beyond the 12th grade, providing quality education and skill formation for women to enhance their contribution to poverty reduction.
    • Enhanced Gender Participation: Implement measures to boost women’s participation in the labor force, aiming to bridge the gender gap and empower women economically.
    • Climate-Resilient Agriculture: Prioritize sustainable agricultural practices that address climate change challenges, ensuring food security and rural income stability.
    • Nutrition Interventions: Develop targeted interventions to address child malnutrition, focusing on reducing underweight and stunting rates among children under five.
    • Data-Driven Approach: Continuously utilize accurate and comprehensive data to inform policy decisions, ensuring effective poverty alleviation strategies.

    Conclusion

    • India’s remarkable poverty alleviation journey reflects recent unparalleled progress. Leveraging inclusive growth, women’s education, and agricultural innovation can drive lasting transformation. Safeguarding against climate change and enhancing food systems can pave the way for a prosperous and equitable future.


  • Poverty Estimates: Issues With PLFS Data

    Central Idea

    • The claim of poverty reduction in India during the pandemic year of 2020-21 is contested due to discrepancies in data and survey design. The PLFS data is used to make this claim, and there are recent papers that have come up with divergent claims on trends in poverty, showing both a rapid decline in poverty as well as a sharp increase.

    Use of Comparable Estimates

    • Poverty estimates in India have always been based on consumption estimates from the NSO, particularly based on the consumption expenditure surveys (CES).
    • The last official poverty estimates were for 2011-12, even though a comparable consumption survey was conducted in 2017-18.

    What is Periodic Labour Force Survey (PLFS)?

    • PLFS is a large-scale household survey conducted by the National Statistical Office (NSO) of India.
    • It collects data on various aspects of the labour force in India, including employment, unemployment, and labour force participation rates. In addition to these labour force indicators, the PLFS also collects data on consumption expenditure, which can be used to estimate poverty levels.

    Issue with PLFS Data

    • Estimates are not comparable: The PLFS estimates of poverty are not comparable with those from the CES, as the PLFS estimates are based on a single question.
    • Consumption estimates: The issue of sensitivity of consumption estimates to survey design, the level of aggregation and details has been extensively written about and was at the heart of the Great Indian Poverty Debate of the early 2000s.
    • Details about consumption expenditure is not just relevant: The sensitivity to the details of questions asked to collect consumption expenditure is not just relevant across different surveys but also across different rounds of the PLFS.

    Poverty Trends

    • The first set of conclusions can be drawn for the period between 2011-12 and 2017-18.
    • Using the CES based full schedule and the leaked report for 2017-18, a rise in poverty can be seen.
    • For a similar time period, the single question asked in the earlier rounds of PLFS can be compared with the 2014-15 (72nd round) NSO survey on services and durable goods expenditure which had exactly the same question in the same block with the same instructions making them comparable to estimates from the PLFS from 2017-18 to 2019-20.
    • These suggest that the poverty headcount ratio was 27 per cent in 2014-15 and rose to 36 per cent in 2017-18, declining to 32 per cent in 2018-19 and remaining at that level in 2019-20.
    • Unfortunately, for the period during the pandemic (2019-20 to 2020-21) that the PM paper tries to address, it is difficult to say what happened based on available consumption data because of the questionnaire changes mentioned above.

    Impact on Policy

    • The absence of official estimates on poverty is also a reflection of the lack of political priority of the government on such a crucial indicator.
    • Currently, a survey on consumption expenditure is being canvassed by the NSO which again follows a completely new methodology and schedule. While it may provide another set of estimates of consumption expenditure, it is unlikely to help resolve the poverty debate.

    Conclusion

    • The issue of what happened to poverty after 2011-12 is crucial for policy. However, frequent interference in the statistical system through changes in survey and questionnaire design, suppression of data, and delaying the release of crucial data are making it difficult to have a correct assessment of reality. The absence of official estimates on poverty is a reflection of the lack of political priority of the government on such a crucial indicator.
  • Taking care of Vulnerable Homeless People

    Homeless

    Context

    • In India, the northern states face extreme weather in peak winter and summer. Hundreds of homeless people die in winter due to harsh cold conditions and, in summer, due to intolerable heat.

    Click and get your FREE Copy of CURRENT AFFAIRS Micro Notes

    Why homelessness needs attention?

    • Lack of record: There is an absence of official records enumerating deaths due to homelessness. It undermines the scale of the crisis in the era of statistics and showcases states apathy.
    • Extreme poverty: Homelessness is one of the worst forms of marginalisation as most homeless individuals suffer from malnutrition and extreme poverty.
    • Poor health condition: Access to healthcare facilities and their affordability is also a hurdle. Exorbitant conditions affect mental health in many cases.
    • Vulnerability to violence: Moreover, these conditions also give rise to drug and alcohol consumption. It creates a conducive situation for substance abuse. Such circumstances increase an individual’s vulnerability to violence, especially in the case of women and children.
    • Social castigation: Stigmatisation and social marginalisation compound their precarious situation. In a nutshell, homelessness strips a person from all human rights.

    Reasons for homelessness

    • Extreme poverty,
    • Inadequate affordable housing,
    • High levels of inequality,
    • Discrimination,
    • Low wages,
    • High rents,
    • The soaring cost of living

    Homeless

    What are the estimates of homelessness in India?

    • The 2011 census estimate: Nearly 17.7 lakhs people as houseless, however, the census fails to capture the entire homeless population.
    • Commissioners of Supreme courts: since census are conducted in every 10 years, this data is decadal old. As per the Commissioners of the Supreme Court, 1 percent of the urban population is homeless, making it a population of ~37 lakhs.
    • The Ministry of Housing and Urban Affairs: Ministry conducted a third-party survey in 2019 to identify the urban homeless. It estimates that approximately 23.93 lakh people are homeless. Population increase and the COVID-19 pandemic have fueled the rise in the homeless population.

    Homeless

    What is the “Shelter for Urban Homeless (SUH)” Scheme about?

    • The scheme seeks to provide shelter to the urban poor. SUH is a sub-scheme under Deendayal Antyodaya Yojana-National Urban Livelihoods Mission (DAY-NULM). The scheme guidelines mention the following provisions:
    • All weather permanent shelters will be open for 24 hours.
    • Permanent community centre for at least 100 people for every 1 lakh population.
    • Each one should cater to 50-100 persons depending on local conditions.

    What are the problems in shelter homes?

    • Entry level barrier: Homeless people face entry-level barriers in accessing public shelters due to local issues such as shelter location, entry fees, and identification proof for verification.
    • Non-availability of IDs: Most of the homeless are in the informal economy, lacking necessary documentation like voter ids, Aadhar card, etc. It makes them ‘invisible’ in the eyes of the city administration, and their voice remains unheard.

    Homeless

    Addressing the issue of homelessness

    • Responsibility of ULBs: The responsibility of accessing the homeless population rests with the urban local bodies. Local authorities need to conduct surveys to assess the homeless population.
    • Decentralisation of funds: State governments must implement the 74th Constitutional Amendment in its true spirit. Its implementation will empower ULBs, which can then bring all the shelter homes under the ambit of SMCs and train them to manage local issues.
    • Ensuring the benefits through ULBs: It can help them to secure benefits and guarantee the convergence of various government schemes, thus also addressing deep-rooted issues like violence and exclusion.

    Conclusion

    • The aim of providing housing for all will remain a distant dream if the homeless are not covered. Sheltering the homeless is a crucial link in the overall housing continuum. The state governments need to empower municipal bodies to ensure the decentralisation of governance.

    Mains Question

    Q. Discuss the problem of Homelessness in India? What are the challenges in addressing the homelessness problems and suggest the solution for it.

    (Click) FREE1-to-1 on-call Mentorship by IAS-IPS officers | Discuss doubts, strategy, sources, and more


  • Multi-Dimensional Poverty (MPI) Estimation

    MPI

    Context

    • There is debate going on over Multi-dimensional Poverty (MPI) estimation and Covid impact on poverty. Various experts are arguing that poverty decline faster during NDA years than UPA years.

    How MPI is estimated as per oxford poverty and human development initiative (OPHD)?

    • Two set of estimates: There are two sets of poverty estimates provided by the Oxford Poverty and Human Development Initiative (OPHI) that compile these data across countries, primarily from Demographic and Health Surveys (DHS).
    • Uncensored estimate: The first are uncensored estimates for individual indicators, which correspond to a simple question regarding whether a household is deprived (poor) in a given indicator for example, nutrition.
    • Censored estimate: Alternatively, one can obtain an indicator-specific censored poverty estimate via a two-stage process. Censored data helps shift the focus onto those who have been (multidimensionally) identified as poor. A higher MPI suggests greater intensity of deprivation while a higher censored poverty rate is an important signal to policymakers to redirect policy focus.

    Poverty

    Click and get your FREE Copy of CURRENT AFFAIRS Micro Notes

    Two stage process under censored estimates?

    • Multidimensionally poor: The first stage estimates the population that is multidimensionally poor.
    • Poor on each indicator: The second stage estimates the population that is poor in each indicator for the multi-dimensionally (MP) poor. For example, in 2005-06, the MP poor were 55.1 per cent; uncensored nutritionally poor were 57.3 per cent; and 44.3 per cent were censored nutritionally poor.
    • Poor in both categories: In other words, close to 80 per cent of the nutritionally deprived are also multidimensionally poor. For the DHS India survey years, censored estimates are used.

    Advantage of using censored estimates

    • No mismatch in absolute and indicator specific poor: For some individual indicators such as assets, some households may be considered as deprived (poor) even as they are relatively better off in other areas such as nutrition, sanitation, etc.
    • Interlinkages between poverty indicators: Other advantage of a censored approach is that it allows the capture of interlinkages between several poverty indicators. For example, environmental enteropathy is known to have a key role in nutrition absorption in children. Therefore, investments made towards providing sanitation facilities and piped water connections will have an impact on nutritional absorption.

    MPI

    What latest data on MPI says?

    • Annual improvement in health and education: Annual pace of improvement in the health, education and living standards indicators during 2005-15: 7.3, 10.0 and 9.6 per cent respectively. In the NDA years: 11, 8.4 and an outsized 17.2 per cent annual gain in living standards.
    • Efficient redistribution of resources: An efficient redistribution combined with direct fiscal resources targeted specifically to reduce deprivation across individual indicators.
    • Inclusive growth: The inclusive growth belief was that period I would show a greater improvement because the dominant component of poverty decline, growth in per capita consumption, was about 0.8 percentage point higher in period I (annual 3.8 per cent increase vs. 3 per cent in period II).
    • Faster poverty decline: The pace of MPI index decline was almost twice the pace in period II relative to period I! This result is strongly indicative of considerably more inclusive (and more efficient and less corrupt) growth in period II compared to period I.
    • Poor performance on some indicators: For only four indicators is the rate of uncensored poverty decline lower in period II. Assets and school attendance are lower in period II for both uncensored and censored poverty. Incidentally, school attendance improvement is expected to be lower as one approaches 100 per cent enrolment, the pace of change from 20 to 25 per cent enrolment is 25 per cent versus a pace of only 1 per cent when enrolment increases from 95 to 96 per cent.

    MPI

    Conclusion

    • Poverty estimation debate will continue among the experts. Government should solely focus on poverty reduction policies. Present priority should be reducing the Covid induced poverty.

    Mains Question

    Q. What is the censored and uncensored poverty estimates? Analyse the recent data on multi-dimensional poverty index (MPI) in India?

    (Click) FREE1-to-1 on-call Mentorship by IAS-IPS officers | Discuss doubts, strategy, sources, and more