💥Mains Ready By December. Smash Mains & Smash PYQ Admissions Open

GS Paper: GS1-07.Role of women and women’s organization, population and associated issues, poverty and developmental issues.

  • Concerns over the Census questions

    Why in the News

    The Central government has notified the questions to be asked of every individual during the population enumeration phase of the 2027 Census. In a departure from past Censuses, the schedule seeks personal details that cannot be used to generate any useful statistics: the names of the parents of every individual, nationality as declared, the permanent residential address, the place of COVID-19 vaccination, the number of bank accounts held, and mobile, Aadhaar, voter identity and passport numbers. The same details are the ones required to prepare or update a population register. The contest is over whether a questionnaire built partly out of identifiers still serves the statistical purpose the Census exists for.

    What is a population census?

    1. The United Nations definition: A census is the total process of planning, collecting, processing, analysing, disseminating and evaluating demographic, economic and social data at the smallest geographic level, at a specified time, covering all persons in a country or in a well delimited part of it.
    2. Its output is statistics, not records: The exercise generates statistics for the use of the government in particular and society in general, so the information an individual gives is used only to compile the relevant statistics.
    3. Confidentiality is a founding principle: Principle 6 of the United Nations Fundamental Principles of Official Statistics requires individual data collected by statistical agencies to be strictly confidential and used exclusively for statistical purposes. India has adopted these principles.

    What is new in the 2027 questionnaire?

    1. Household relationships: Respondents must give the details of the parents of every individual, and of the spouses of the married persons in the household.
    2. Status and residence: Nationality as declared and the permanent residential address are to be recorded.
    3. A pandemic era question: The place of COVID-19 vaccination is to be recorded.
    4. Financial detail: The total number of bank accounts held by each person is to be recorded.
    5. Identifiers: Mobile number, Aadhaar number and voter identity card number are to be recorded if available, along with the passport number of Indian passport holders and whether the person holds a driving licence.
    6. The length of the schedule: The questionnaire runs to 40 questions, many of them requiring descriptive answers.

    Why have names never entered Census databases?

    1. A name identifies, it does not measure: An individual’s name has no relevance to the exercise beyond identifying the person during enumeration. Names have been placeholders and have not been present in Census databases.
    2. India has never computerised them: There have been no attempts in the Indian Censuses to computerise names at all.
    3. Other countries record names for a declared later use: Some countries include the name and open past Census data for genealogical study. Eg. Past data from the United States Census can be accessed 72 years after the exercise, and India has no comparable rule or policy.

    Which households cannot answer these questions?

    1. Institutional households: Wardens of hostels, old age homes and jails must supply the names of every resident along with the names of their parents.
    2. Students are counted where they are not present: Large numbers of children study away from home in hostels and as paying guests. February falls towards the end of the academic year, so they may not be at home and would not be eligible for enumeration at their normal households.
    3. Ordinary households have gaps too: A respondent may not know the details of grandparents living with them.
    4. Visitors and staff are also covered: Visitors and domestic servants living in a household for the entire duration of the enumeration period are to be enumerated there, and the respondent may be unable to obtain their details.

    What can the identifier questions actually produce?

    1. ‘If available’ is undefined: It is unclear whether availability refers to the household member concerned or to the respondent. Read as the respondent, the numbers will not reach the Census, since respondents are frequently housewives or elderly parents who do not hold these details for every member.
    2. The numbers do not tabulate: These are not data items usable for any tabulation, beyond determining whether such a number exists.
    3. The field cost is prohibitive: More than 30 lakh enumerators would have to sit with households to record these numbers correctly, and they may lack the time and patience to obtain the relevant records.
    4. The respondent carries no duty of care: The respondent is not a Census functionary, so an individual whose identifiers are disclosed by a household respondent has no protection against their misuse.

    What would the bank account question have to be to work?

    1. The tabulation it supports is narrow: The total number of bank accounts held by each person yields a distribution of persons by number of accounts, and little else.
    2. The same distribution exists elsewhere: For account holders, the number can be obtained by tabulating accounts against each Permanent Account Number (PAN), which is required to open a bank account.
    3. A simpler question meets the policy need: If the object is only to identify persons without any bank account, asking whether the person holds one is enough.
    4. The field reality: A schoolteacher appointed as an enumerator will struggle to get a correct count of accounts from upper class respondents, who may not answer even the simpler questions.

    Why was the nationality question dropped after 1961?

    1. Declaration does not establish status: Nationality as declared may serve no useful purpose, since a person residing illegally may declare Indian nationality.
    2. India tried it and abandoned it: The question was asked in the 1951 and 1961 Censuses and was discarded from 1971 onwards.
    3. A comparable decision abroad: The United States decided, after considerable debate, not to include the citizenship question in its 2020 Census.

    Is the Census being used to build the National Population Register?

    1. The proposal has a history: Proposals to update the National Population Register (NPR) during the 2021 Census exercise drew objections from several States.
    2. States control the field staff: The Census is conducted by enumerators appointed by the State government under Section 4(2) of the Census Act, 1948, so a State may refuse the use of its staff for work that is not part of the Census. The Citizenship Act says nothing about a State government’s role in preparing the NPR.
    3. The new questions fit the register, not the statistics: Details of parents, permanent address and nationality are useful for preparing or updating the NPR, which is to form the basis for preparing the National Register of Citizens. They add no statistics of their own.
    4. Extraction would breach confidentiality: Collecting the information through the Census questionnaire and later extracting it for another organisation within the government may violate the principle of confidentiality.
    5. The objection is to the route, not the register: Preparing a population register or a citizen register is unobjectionable and its uses are well recognised. The collection for it should run through a transparent process with a legal basis, without jeopardising the Census.

    What does the length of the schedule do to data quality?

    1. Respondent fatigue: The time a long descriptive schedule takes per household invites disinterest, and the respondent answers similar questions again for every individual in the household.
    2. Casual replies follow: A disinterested respondent supplies answers that are recorded as data, so fatigue enters the dataset rather than showing up as non-response.
    3. Enumerator workload: Recording names and addresses has significantly increased the enumerator’s workload.
    4. The output degrades: Loading the Census with questions that generate no statistics may seriously affect the quality of Census data.

    Challenges to the 2027 Census

    1. The decadal series carries a gap: The last completed Census was in 2011, so sampling frames, welfare targeting and constituency data have run for over a decade on an ageing base. Eg. Household surveys draw their samples from Census frames, which have not been refreshed since 2011.
      The Fix: Fix a statutory calendar for enumeration and for data release, so the exercise cannot be deferred by administrative decision.
    2. The general data protection regime does not cover this risk: Census records rely on the secrecy provisions of the Census Act. The general law carries wide exemptions for government processing. Eg. The Digital Personal Data Protection Act, 2023 permits the Union government to exempt instrumentalities of the State from its obligations.
      The Fix: Notify an express purpose limitation for Census records that bars their transfer into any non statistical database.
    3. Digital self enumeration excludes the least connected: The 2027 Census offers self enumeration through a digital application, which the households most likely to be missed are least able to use. Eg. Internet access and smartphone ownership remain lowest among the poorest rural households.
      The Fix: Keep full enumerator coverage as the default and treat self enumeration as an additional channel rather than a substitute.
    4. Caste enumeration adds a classification burden: The 2027 Census will record caste, and caste names vary across regions, languages and spellings, which makes field coding unreliable. Eg. The 1931 Census, the last to enumerate caste comprehensively, recorded several thousand caste and sub caste entries.
      The Fix: Publish a pre coded State wise caste list with a residual open field, so enumerators record rather than classify.

    Conclusion

    The questionnaire stands notified, and enumeration will run on it unless the government revises the schedule before the field work begins. The unresolved point is not whether the state may build a population register, which nobody disputes. It is whether the Census, whose cooperation from a household rests on the assurance that answers become numbers and nothing else, is the right instrument to build one with. Every question that cannot be tabulated tests that assurance, and a household that begins to doubt it answers the rest of the schedule differently.

    Back2Basics: National Population Register

    1. What it is: A register of the usual residents of the country, prepared at the local, sub district, district, State and national level.
    2. Legal basis: It is prepared under the Citizenship Act, 1955 and the Citizenship (Registration of Citizens and Issue of National Identity Cards) Rules, 2003.
    3. Who is a usual resident: A person who has resided in a local area for six months or more, or who intends to reside there for the next six months or more, irrespective of citizenship.
    4. Its status now: The register was first prepared in 2010 alongside the house listing phase of Census 2011 and was updated in 2015.

    Matching Previous Year Question

    “No direct PYQ traced in the provided files”
  • Census advanced in four poll-bound States, formally deferred in Manipur

    Why in the News

    The Union government has advanced the population enumeration phase of Census 2027 in the poll-bound States of Uttar Pradesh, Punjab, Uttarakhand and Goa, scheduling it from November 16, 2026 to January 4, 2027, ahead of the nationwide enumeration planned for February 2027. The same notification formally deferred the Census exercise in Manipur till further declaration. The reference date for the four States is fixed at 00.00 hours on January 5, 2027, against March 1 for the rest of the country and October 1, 2026 for Ladakh and the snow-bound areas of Uttarakhand, Jammu and Kashmir and Himachal Pradesh. The second phase carries 40 questions and includes an open-ended field for recording caste details. The tension is that a single count needs a single moment of reference, and the schedule now bends to the electoral calendar in four States and to a citizenship register demand in one.

    What does the revised schedule change?

    1. The legal basis: The notification was issued by the Registrar General and Census Commissioner of India under the Census Act, 1948.
    2. The order of operations in the four States: Residents have the option of self-enumeration through a dedicated portal between November 16 and November 30, ahead of the door-to-door survey, which begins on December 1.
    3. The revisional round: Population enumeration in the four States is followed by a revisional round from January 5 to January 9, 2027, immediately after the reference moment.
    4. The stated reason for the advance: The exercise is being completed in these four States before assembly elections due early next year.

    What does the second phase ask?

    1. The scale of the schedule: The second phase carries 40 questions, of which at least 13 are new compared with the 2011 Census.
    2. Caste is recorded without a fixed list: The schedule includes an open-ended field for caste details. Respondents may also decline to disclose their caste or state that they do not belong to any caste.
    3. The new identity and household questions: Spouse’s name, nationality, father’s particulars and mother’s particulars are being asked for the first time.
    4. The new asset, document and service questions: Digital literacy, permanent residential address, place of Covid-19 vaccination, number of bank accounts, passport number, availability of a driving licence and a mobile phone, and Aadhaar and voter ID numbers where available.

    Why has Manipur been left out?

    1. The deferral is open ended: The notification defers the Census exercise in the State indefinitely, with no revised date attached.
    2. The demand behind it: A large section of civil society groups from the Meitei and Naga communities has demanded that a National Register of Citizens (NRC) be compiled first, before the Census is undertaken in the ethnic violence-hit State.
    3. The communities involved: Manipur has three major communities, the Meitei, the tribal Naga and the Kuki-Zo, and the demand as reported comes from groups within two of them.
    4. What deferral costs: A State counted at a different time cannot be compared with the rest of the country on the same reference date, which is the property that makes Census data usable for allocation.

    What is the Opposition’s objection?

    1. The planning objection: The Congress has said the fresh notification shows shoddy planning, since the population enumeration due in February 2027 has been advanced in four States where elections were already known to be due.
    2. The timing objection: It has framed the sudden revision as driven by political calculation rather than statistical need, given how long the schedule had been settled.
    3. The caste question objection: It has argued that the caste question is deliberately very poorly designed and will render the whole caste census exercise meaningless.
    4. The procedural complaint: The Leaders of the Opposition in the Lok Sabha and the Rajya Sabha wrote to the Prime Minister on August 20, 2026 on the caste question, and no mid-course correction followed.

    Challenges to Census 2027

    1. An open-ended caste field cannot be aggregated: Self-reported caste names arrive in many spellings, synonyms and sub-group labels, and no total can be produced from them without a coding frame prepared in advance. Eg. The Socio Economic and Caste Census of 2011 threw up roughly 46 lakh distinct caste entries, and its caste data was never released.
      The Fix: Publish a draft State-wise caste list for public objection before enumeration, and code every response against that list at the point of collection.
    2. A delayed count ages every entitlement built on it: Welfare coverage fixed as a share of population continues to use the last enumerated population until a new one exists. Eg. Coverage under the National Food Security Act, 2013 remains anchored to the 2011 Census, so population added since then sits outside the ration entitlement.
      The Fix: Provide in the enumeration notification for automatic revision of population-linked entitlement ceilings once provisional totals are published.
    3. Self-enumeration presumes the capability being measured: A portal-first round shifts the first pass onto respondents who need a device, connectivity and the confidence to file. Eg. Digital literacy is itself one of the questions being asked in this schedule, which indicates it cannot be assumed across households.
      The Fix: Treat the portal response as one input into the door-to-door visit rather than as a substitute for it, and verify every self-filed record in the field round.
    4. The count competes with the election machinery for the same staff: Enumerators in India are largely school teachers and local officials, who are also the staff deployed on electoral roll work and poll duty. Eg. The advanced enumeration in the four States runs in the months immediately preceding their assembly elections.
      The Fix: Ring-fence the enumeration workforce from election duty for the enumeration and revisional rounds, and record the deployment so overlaps are visible.

    Conclusion

    The count is now running on two clocks, one set by the electoral calendar and one by the need for a common moment of reference. Comparability survives only if enumeration in each region closes cleanly before the next begins, and an advanced schedule in four States narrows that margin. The revisional round that follows the advanced enumeration is the last point at which its errors can be corrected. Manipur’s deferral carries no end date, so the country’s first count in over a decade will be incomplete until the demand that produced the deferral is settled.

    Back2Basics: Census Act, 1948

    1. It provides the legal basis for taking the Census in India and empowers the Centre to notify the schedule, the questions and the reference date.
    2. The exercise is conducted by the Registrar General and Census Commissioner of India, which functions under the Ministry of Home Affairs.
    3. Individual returns are confidential, are not open to inspection and are not admissible as evidence in any court; only aggregated data is published.
    4. Answering the Census questions is a legal obligation on the respondent, and giving false information or refusing to answer is a punishable offence.

    Matching Previous Year Question

    “Consider the following statements : 1. Between Census 1951 and Census 2001, the density of the population of India has increased more than three times. 2. Between Census 1951 and Census 2001, the annual growth rate (exponential) of the population of India has doubled. Which of the statements given abova is/are correct ? (a) 1 only (b) 2 only (c) Both 1 and 2 (d) Neither 1 nor 2”

  • Congress urges PM to scrap caste census questionnaire

    Congress urges PM to scrap caste census questionnaire

    Why in the News

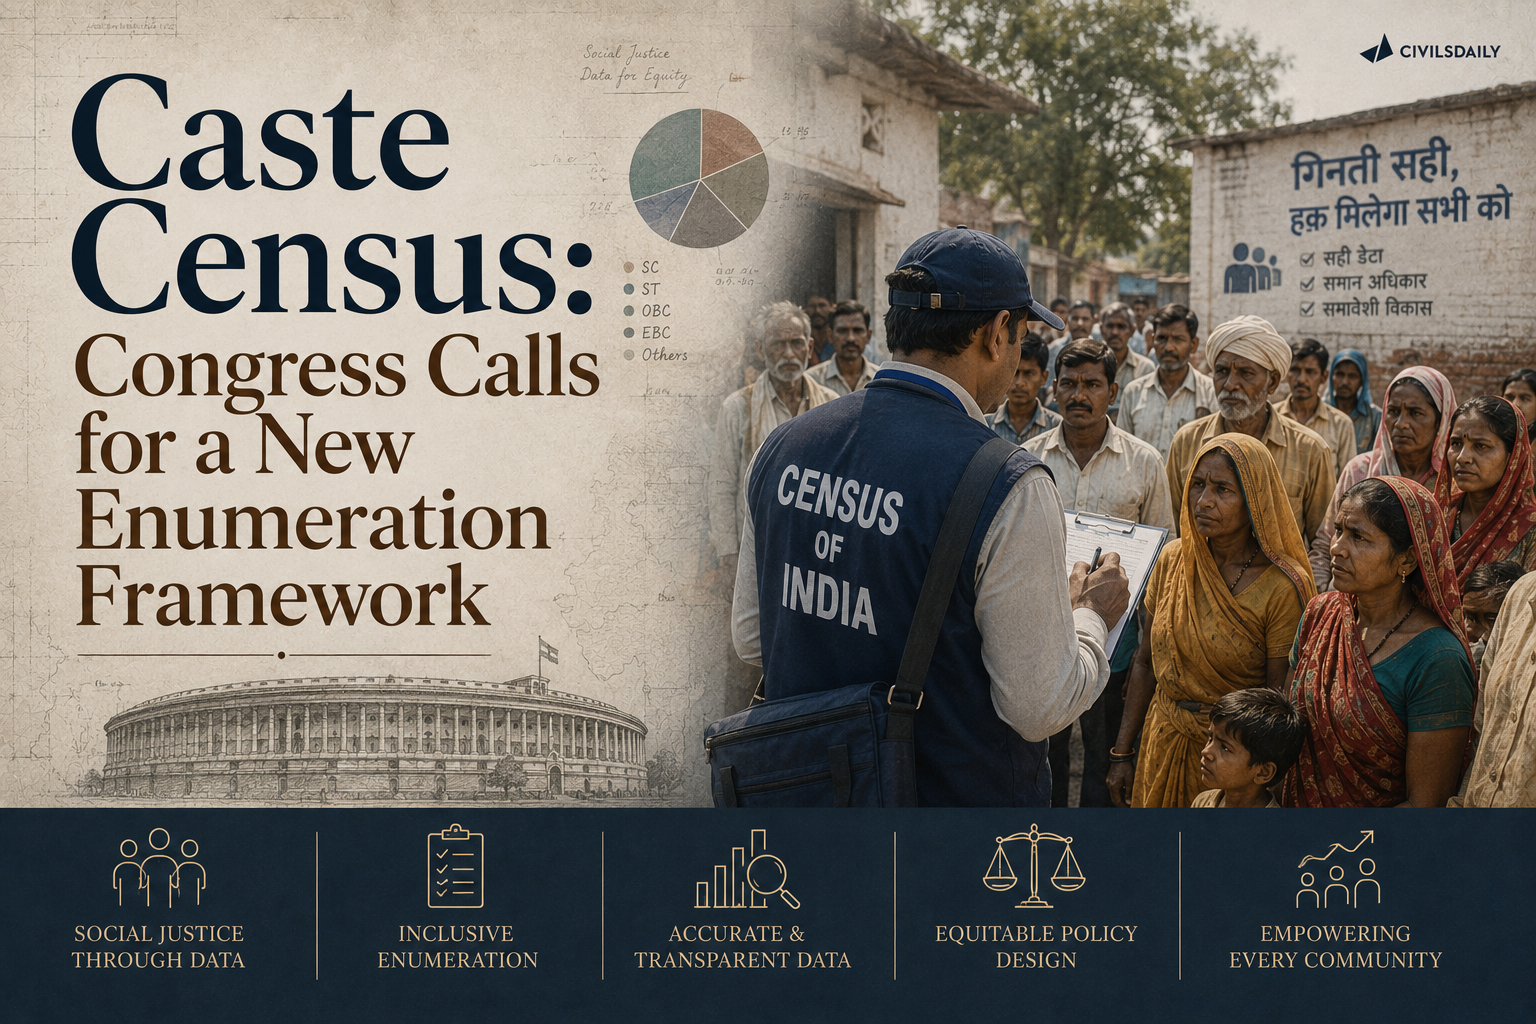
    The Leader of the Opposition in the Rajya Sabha and the Leader of the Opposition in the Lok Sabha have written to the Prime Minister demanding that the questionnaire prepared for the caste census be scrapped. They have asked that a new questionnaire be prepared to ensure accurate enumeration of castes.

    What is being contested about the questionnaire’s design?

    1. The objection targets an open-ended format: The two leaders object to an open-ended format proposed for recording caste details, arguing it could allow the same caste to be recorded under different names, sub-castes, and linguistic variants, undermining accurate counts.
    2. They demand consultation before the survey form is finalised: The letter asks the government to formulate a new survey form only after consulting political parties, experts, and the public, rather than proceeding with the existing draft.
    3. The stated purpose is enumeration accuracy, not the census itself: The objection is to the questionnaire’s design, not to the decision to conduct a caste census, and the leaders frame the current format as an obstacle to the caste enumeration’s own stated purpose of social justice.

    Constitutional & Legal Angle

    • Article 15: Prohibits discrimination on grounds including caste and enables special provisions for socially and educationally backward classes.
    • Article 16(4): Enables reservation in public employment for backward classes that are not adequately represented.
    • Article 46: Directs the State to promote the educational and economic interests of weaker sections, particularly SCs and STs.
    • Article 340: Provides for a Commission to investigate the conditions of socially and educationally backward classes.
    • Article 17: Abolishes untouchability, making caste-related discrimination a key constitutional concern.
    • Privacy dimension: Caste is sensitive personal information, so enumeration also requires safeguards against misuse and unauthorised disclosure. UPSC has repeatedly tested the Right to Privacy under Article 21.

    Why Accurate Caste Data Matters

    • Reliable data → identify deprivation → better targeting of welfare → evidence-based reservation policy → social justice
    • Poor classification can lead to:
      • Under-counting of communities
      • Over-counting due to duplicate names
      • Difficulty comparing data across regions and time
      • Distorted assessment of representation and deprivation

    “[2009] Which one among the following South Asian countries has the highest population density ?

    (a) India

    (b) Nepal

    (c) Pakistan

    (d) Sri Lanka

  • Counting out the disabled citizens

    Why in the News

    Census 2027’s questionnaire carries a single disability question, Question 13, which enumerates only nine categories of disability, against the 21 conditions formally recognised as disabilities under the Rights of Persons with Disabilities Act, 2016. A count built on nine categories cannot register a person whose recognised condition falls outside those nine, which means the Census undercounts India’s disabled population by construction, not merely by survey error, and the Unique Disability ID (UDID) database that might otherwise cross-check the Census figure carries its own coverage gaps.

    What does the Rights of Persons with Disabilities Act, 2016 recognise, and what does the Census actually ask?

    1. 21 recognised conditions under the 2016 Act: The Rights of Persons with Disabilities Act, 2016 (the law replacing the earlier 1995 Persons with Disabilities Act, expanding recognised disabilities from 7 to 21 categories, and mandating reservation, accessibility, and non-discrimination duties on the State) legally recognises 21 distinct categories of disability, including several, such as specific learning disabilities, acid attack survivors, and multiple sclerosis, that were not recognised under India’s earlier disability law.
    2. Census 2027’s Question 13 covers only nine categories: The Census questionnaire’s single disability question condenses the 21 legally recognised categories into just nine, meaning twelve legally recognised disabilities have no corresponding option a respondent can select.
    3. A structural undercount, not a response-rate problem: Because the missing twelve categories are absent from the question itself, a respondent living with one of them cannot be captured correctly regardless of how carefully the Census is conducted, making this a design gap rather than an implementation gap.

    Why can’t the UDID database fill this gap?

    1. UDID (Unique Disability ID) coverage depends on active registration: The UDID database only includes individuals who have actively applied for and been issued a disability certificate and identity card, so it excludes anyone with a recognised disability who has not gone through that certification process.
    2. Certification access itself is uneven: Access to the medical assessment boards that issue UDID certification varies sharply between urban and rural areas, meaning UDID’s own gaps are likely to be concentrated among the same populations the Census undercount would most affect.
    3. Two flawed instruments cannot cross-check each other reliably: A Census that undercounts by question design and a UDID database that undercounts by registration access cannot be used to validate one another, since neither offers an independent, complete count against which the other’s gap can be measured.

    What follows from an undercounted disabled population?

    1. Reservation and welfare planning rests on the undercount: Government reservation quotas in education and employment for persons with disabilities, and the targeting of disability-specific welfare schemes, are calibrated using population estimates that a structurally undercounting Census feeds into.
    2. Categories left out of Question 13 remain statistically invisible: Persons with conditions such as specific learning disabilities or multiple sclerosis, recognised under the 2016 Act but absent from the Census question, have no official population estimate to anchor policy design specific to their needs.

    Conclusion

    A Census disability question built on nine categories against a legal framework recognising 21 will undercount India’s disabled population in a way no amount of survey diligence can correct, and the UDID database’s own registration-dependent gaps mean there is no reliable instrument left to check the resulting figure against. Expanding Question 13 to match the Rights of Persons with Disabilities Act, 2016’s full 21 categories before Census 2027 is administered is the specific, correctable step this gap points to.

    Disability rights in India

    1. About: Disability rights in India rest on a rights-based, rather than a purely welfare-based, framework since the Rights of Persons with Disabilities Act, 2016, which places binding legal duties on the State to ensure accessibility, non-discrimination, and reservation, rather than treating disability support as discretionary welfare.
    2. Rationale: The shift to a rights-based approach followed India’s ratification of the UN Convention on the Rights of Persons with Disabilities, which required domestic law to guarantee enforceable rights rather than optional benefits.
    3. Named typology: The 2016 Act expanded recognised disability from 7 categories under the 1995 law to 21, adding categories such as acid attack survivors, Parkinson’s disease, specific learning disabilities, and multiple sclerosis that the earlier law did not recognise at all.

    Challenges in disability rights implementation

    1. Undercounting in national data systems: As Census 2027’s nine-category question shows, India’s principal demographic data instrument cannot fully register the 21 categories the law itself recognises. Eg. Specific learning disabilities and multiple sclerosis have no dedicated Census option despite legal recognition since 2016. Fix. Redesign Question 13 to map directly onto the 2016 Act’s full 21-category schedule before the Census is finalised.
    2. Accessibility mandates poorly enforced: The 2016 Act places a legal duty on government and public infrastructure to be accessible, but compliance across transport, government buildings, and digital platforms remains inconsistent. Eg. The Sugamya Bharat Abhiyan (Accessible India Campaign) set accessibility targets for government buildings that a large share of audited buildings have still not met. Fix. Tie a share of central grants to State governments to independently verified, building-by-building accessibility audit scores.
    3. Reservation implementation gaps in employment: The Act mandates a minimum reservation in government employment for persons with disabilities, but actual fill rates against the reserved quota lag the mandated share in most government departments. Fix. Mandate an annual, department-wise public disclosure of reservation fill rates for persons with disabilities, modelled on existing Scheduled Caste and Scheduled Tribe reservation reporting.
    4. UDID registration barriers in rural areas: Certification for the Unique Disability ID depends on access to a medical assessment board, which is disproportionately concentrated in urban centres. Eg. A rural resident may need to travel to a district hospital multiple times to complete the certification process. Fix. Conduct periodic camp-based UDID certification drives at the block level rather than requiring travel to a fixed district facility.
    5. Weak data on economic outcomes for persons with disabilities: Beyond the population count itself, India lacks robust, regularly updated data on employment rates, income levels, and educational attainment specifically among persons with disabilities. Fix. Add disability status as a standard disaggregation category in the Periodic Labour Force Survey, alongside the existing gender and social-category breakdowns.

    Back2Basics: Unique Disability ID (UDID)

    1. A national database and identity card system issued to persons with disabilities upon certification by a designated medical assessment board.
    2. Intended to serve as a single, portable proof of disability accepted across government schemes, replacing the need for repeated, State-specific certification.
    3. Coverage depends on individuals actively applying for and completing certification, so it does not capture persons with disabilities who have not gone through that process.
    4. Administered under the Department of Empowerment of Persons with Disabilities, Ministry of Social Justice and Empowerment.

    Matching Previous Year Question

    “[2026] Which of the following statements with regard to the persons with disabilities in India is/are
    correct?
    1. The Rights of Persons with Disabilities Act, an Act passed by the Parliament of India in
    2018, mandates reservation in education and employment, places a legal duty on
    Governments to ensure accessibility and non-discrimination.
    2. The Sugamya Bharat Abhiyan focuses on achieving universal accessibility for Persons with
    Disabilities across three key domains — built infrastructure, transport systems and
    information and communication technology.
    3. The National Divyangjan Finance and Development Corporation (NDFDC) is a public
    sector organisation set up by the Ministry of Corporate Affairs as a not-for-profit company to
    promote entrepreneurship among Persons with Disabilities (PwDs).
    Select the answer using the code given below:
    (a) 1 and 2
    (b) 2 only
    (c) 1 and 3
    (d) 1 only
    ANSWER: B”

  • What young want, and why creating good jobs is no longer optional

    Why in the News

    Almost 70 per cent of urban job seekers surveyed in Delhi said they were looking for a job that would place them on their ideal career path from the start, instead of settling for any job. The survey covered over 3,000 randomly sampled men and women, 24 years of age on average, living in middle-class residential areas of the capital, and was conducted in the summer of 2023. Their stated career goal was predominantly salaried or formal-sector employment. The Periodic Labour Force Survey (PLFS) for the same year records an urban labour market that cannot supply that goal, with less than 50 per cent of the urban workforce in salaried jobs. A follow-up experiment then exposed a random subset of the same job seekers to real-world job openings and salaries, and re-surveyed them a year later. Correcting their information lowered their expectations and left their aspirations untouched, so the contest is over who adjusts, the young or the labour market.

    What is the Periodic Labour Force Survey (PLFS)?

    • Purpose: The PLFS is the official household survey that estimates how many people are working, seeking work or outside the labour force, and in what kind of work they are engaged.
    • Nodal body: The National Sample Survey Office under the Ministry of Statistics and Programme Implementation conducts it and is the principal source of employment estimates in India.
    • Activity status measures: Usual Status classifies a person by activity over the preceding 365 days, while Current Weekly Status treats a person as unemployed if they did not work even one hour in the reference week.

    What do young urban job seekers actually want from work?

    • A career path, not a job: Almost 70 per cent said they wanted an opening that put them on their ideal career path from the start rather than any available job, and more men said this than women.
    • Formal salaried work is the goal: The stated career goal was predominantly salaried or formal-sector employment rather than casual or own-account work.
    • Women lean harder towards salaried jobs: More women job seekers aspired to salaried positions than men did.
    • Only 14 per cent of women prefer self-employment: Just 14 per cent of the women interviewed said they would rather work for themselves.
    • A third of men want to run enterprises: More than a third of the men wanted to start their own businesses.
    • Public sector preference is a myth: A comparable share of these men and women were looking for private-sector salaried jobs, which cuts against the dominant narrative of a strong preference for government jobs.

    How far does the urban labour market fall short of those preferences?

    • Salaried work is a minority outcome: Less than 50 per cent of India’s urban workforce holds a salaried job.
    • It is scarcer still for the young: Merely one in every three employed 24-year-olds holds a salaried job, a lower share than for the workforce as a whole.
    • Government jobs are a tenth of the market: No more than 10 per cent of the urban workforce is in the public sector or government jobs.
    • The formal private sector is barely larger: Only about 15 per cent of the urban workforce is in the formal private sector.
    • Self-employment is the largest single category: Of those working, 40 per cent are self-employed.
    • Most self-employment is subsistence, not enterprise: An overwhelming majority of these businesses hire no worker at all and report an annual turnover of less than Rs 10 lakh, so the aspiration to build a firm meets a market of one-person shops.

    Why do salary expectations diverge from what these jobs actually pay?

    • The occupations tested: Respondents were asked what they expected to earn as an accounts keeper, a primary school teacher, a data entry operator, a hospital attendant and an electrician, and each expectation was measured against actual PLFS earnings for the same occupation.
    • Expectations run up to 40 per cent above reality: Job seekers expect up to 40 per cent higher salary than the earnings the PLFS records for the same work.
    • Men are the more over-optimistic: Male job seekers expect almost Rs 8,000 more per month than the actual average earnings for these jobs.
    • The gap widens for salaried work: For salaried jobs specifically, male job seekers expect Rs 8,500 more per month than actual earnings.
    • The aggregate divergence exceeds 30 per cent: Taken together, salary expectations sit more than 30 per cent above reality, and the skew is sharper still among job seekers below 25 years of age, especially young men.
    • Information and inexperience explain the gap: A lack of information or outright misinformation about openings and pay, combined with inexperience of the job market, are the two obvious sources of the misalignment.

    What did correcting job seekers’ information change, and what did it leave untouched?

    • The design: A random subset of the 3,000 job seekers was informed about real-world job opportunities and salaries, and both the informed and the non-informed groups were re-surveyed twelve months later.
    • Expectations fell: Accurate information significantly dampened labour-market expectations of landing the ideal job, relative to those who were not informed.
    • Men disengaged first: Men in particular became less likely to report that they were on their ideal career path.
    • Search effort fell with belief: That disillusionment was accompanied by a decline in men’s job-search intensity.
    • The two exits from a failed search: As preferred job offers fail to materialise, job seekers adjust expectations downwards and either remain in the same jobs or leave the labour market and enrol at educational institutions.
    • Aspirations did not move: The answer on whether aspirations changed is a clear no, since these men and women continued to aim for formal-sector jobs or dynamic entrepreneurship a year later, because aspirations are long-term goals and not easily malleable.
    • High education costs make the expectation rational: Good-quality education is increasingly bought from private institutions at rising cost, so a high expected salary is not only aspirational but necessary to recover that outlay.

    Challenges to the Periodic Labour Force Survey

    • Informal work is under-captured: Household surveys do not fully record home-based, gig and platform work in a workforce that is about 90 per cent informal. Eg. Delivery and ride-hailing riders working across two aggregators are frequently recorded as ordinary self-employed workers. Fix. Align the activity definitions with International Labour Organization and System of National Accounts practice so multi-job holders, freelancers and platform workers are counted separately.
    • No skill mapping against job requirements: The survey does not match worker skills to the requirements of available jobs, so structural unemployment cannot be measured from it. Eg. The India Skills Report finding that only about half of graduates are employable has no counterpart in official survey data. Fix. Add a skills and job-requirement module so mismatch is measured rather than inferred.
    • Rural data has been low frequency: Rural estimates were historically produced only once a year, so rural distress is visible with a long lag. Eg. A monsoon failure that pushes workers back into farm labour shows up only in the following annual round. Fix. Extend high-frequency quarterly or monthly rounds to rural areas rather than confining them to towns.
    • Urban bias in the high-frequency rounds: The quarterly bulletins have been confined to urban areas, which under-measures the larger rural workforce. Eg. Quarterly urban unemployment rates are debated publicly while comparable rural numbers are unavailable. Fix. Publish a single integrated quarterly series covering both sectors on the same reference period.
    • New job categories are missing: Gig, digital, start-up and green jobs are not adequately represented in the occupational classification the survey uses. Eg. Solar installation and battery recycling roles have no distinct occupational code. Fix. Integrate Employees’ Provident Fund Organisation, National Career Service and PLFS records so emerging job creation is tracked from administrative data as well.

    Conclusion

    Young urban job seekers want formal salaried careers and dynamic enterprise, and correcting their information about the market lowers what they expect to earn without changing what they want. That asymmetry places the burden of adjustment on the economy rather than on the young, and realising these aspirations requires a structural transformation that creates jobs with regular pay and benefits. The four Labour Codes are a step in that direction, and creating good jobs and genuine career paths, rather than jobs alone, is no longer optional. Failure carries a specific cost, which is the squandered potential of an entire generation.

  • The rural-urban divide in female labour force participation

    Why in the News

    The Periodic Labour Force Survey (PLFS) 2025 records a significant increase in the Female Labour Force Participation Rate (FLFPR) since 2020, following the COVID-19 pandemic. The overall rate for women aged 15 years and above rose from 30 per cent in 2019-20 to 40 per cent in 2025. The increase was far more pronounced in rural areas, where the rate rose from 33 per cent to 45.9 per cent, against a rise from 23.3 per cent to 27.7 per cent in urban areas. The tension the data raises is that the pace of improvement, measured as the Average Annual Percentage Point (AAPP) change, cannot be read on its own, since a State with a low pace may already sit at a high level of participation.

    What is the Female Labour Force Participation Rate?

    1. Definition: The Female Labour Force Participation Rate is the ratio of women in the labour force to women of working age, taken as 15 years and above.
    2. What counts as participation: The labour force includes women who are employed and women who are unemployed but seeking or available for work, so the rate moves when women enter or leave the search for work, not only when they find it.
    3. What it leaves out: Unpaid domestic work and unpaid caregiving inside a woman’s own household are not counted as labour force participation, so a large volume of work sits outside the measure by construction.

    How large is the rural-urban gap in the headline numbers?

    1. The national rate rose by ten percentage points: Female labour force participation for those aged 15 and above moved from 30 per cent in 2019-20 to 40 per cent in 2025.
    2. Rural India accounts for most of the gain: The rural rate rose from 33 per cent to 45.9 per cent, a gain of about 12.9 percentage points across the period.
    3. Urban India moved far less: The urban rate rose from 23.3 per cent to 27.7 per cent, a gain of about 4.4 percentage points, under half the pace of the rural gain in percentage point terms.
    4. The gap widened rather than closed: Rural participation began roughly 9.7 percentage points above urban participation and ended about 18.2 percentage points above it.
    5. The divergence is what needs explaining: This substantial rural-urban difference is what warrants a more granular, State level analysis rather than a single national figure.

    Which States improved fastest in rural areas?

    1. Seven States beat the national rural pace: West Bengal (3.68), Uttar Pradesh (3.64), Gujarat (3.38), Odisha (3.28), Bihar (3.23), Rajasthan (3.06) and Haryana (2.62) recorded Average Annual Percentage Point change above the all-India rural average, in percentage points per year between 2019-20 and 2025.
    2. The middle band sat below the average: Madhya Pradesh (2.42), Tamil Nadu (2.06), Keralam (1.96), Punjab (1.80), Jharkhand (1.71), Chhattisgarh (1.48) and Andhra Pradesh (1.36) recorded change below the national rural average.
    3. The slowest group still improved: Karnataka (1.20), Uttarakhand (1.18), Maharashtra (0.58), Telangana (0.48) and Goa (0.30) registered the smallest positive annual changes.
    4. All five southern States sat below the rural average: Tamil Nadu, Keralam, Andhra Pradesh, Karnataka and Telangana all recorded change below the all-India rural figure, alongside Madhya Pradesh, Punjab, Jharkhand, Chhattisgarh, Uttarakhand, Maharashtra, Goa and Himachal Pradesh.
    5. One State went backwards: Himachal Pradesh recorded a marginally negative change of -0.02 percentage points a year, which is notable because nearly 90 per cent of its population resides in rural areas.

    Which States improved fastest in urban areas?

    1. Two States cleared two percentage points a year: Rajasthan (2.30) and Gujarat (2.26) recorded particularly sturdy improvements in urban female participation.
    2. Seven more beat the urban average: Uttarakhand (1.88), Keralam (1.76), Chhattisgarh (1.22), Karnataka (1.20), Odisha (1.12), Bihar (1.10) and Andhra Pradesh (0.94) recorded change above the all-India urban average.
    3. The remainder fell below it: Tamil Nadu (0.76), Telangana (0.66), Jharkhand (0.64), Punjab (0.60), Uttar Pradesh (0.54), West Bengal (0.48) and Maharashtra (0.36) recorded change below the national urban average.
    4. Strong urban gains occurred despite a slower overall pace: Several States recorded relatively strong gains even though the overall pace of improvement in urban areas was considerably lower than in rural areas.
    5. The urban leaders are not the rural leaders: West Bengal and Uttar Pradesh led the rural table and sat near the bottom of the urban one, so a State’s rural performance does not predict its urban performance.

    Why is pace alone an incomplete measure?

    1. It measures speed, not level: The Average Annual Percentage Point change captures only the pace of change and does not consider the level of female labour force participation from which a State started.
    2. A low pace can sit on a high level: A State with a lower annual change may already have a relatively high participation rate, so a low figure is not automatically a poor outcome.
    3. The baseline has to be combined with the pace: Reading the 2019-20 rate for each State together with its annual change is what allows a State to be assessed properly.
    4. It is not a ranking device: The measure is used to indicate the pace of improvement and is not intended to rank States against one another.
    5. Himachal Pradesh shows why the pairing matters: Its marginally negative change is read against a rural population share of nearly 90 per cent, which places the figure in context rather than treating it as a simple last place.

    What does the rural baseline-pace map show?

    1. Low baseline with faster improvement: Bihar, Uttar Pradesh, West Bengal and Haryana started with relatively low female participation but recorded change above the all-India average, indicating a relatively faster pace of improvement.
    2. Low baseline with slower improvement: Goa and Punjab started from relatively low baseline levels and recorded change below the national average, indicating slower improvement despite having considerable scope to grow.
    3. High baseline with faster improvement: Odisha, Gujarat and Rajasthan started with relatively higher baseline rural participation and still recorded above average change, showing that faster improvement is not confined to States starting from a low base.
    4. High baseline with slower improvement: Madhya Pradesh, Jharkhand, Uttarakhand, Chhattisgarh, Maharashtra, Himachal Pradesh and the five southern States had relatively higher baseline levels but recorded change below the national average.

    What does the urban baseline-pace map show?

    1. Low baseline with faster improvement: Rajasthan, Gujarat, Uttarakhand and Bihar started from relatively low baseline levels and recorded change above the all-India average.
    2. Low baseline with slower improvement: Uttar Pradesh, Jharkhand, Haryana and Punjab also started from relatively low levels but recorded below average change, indicating slower improvement.
    3. High baseline with faster improvement: Keralam, Karnataka, Chhattisgarh, Odisha and Andhra Pradesh already had relatively higher urban participation and continued to make relatively rapid gains.
    4. High baseline with slower improvement: Tamil Nadu, Telangana, West Bengal, Maharashtra, Madhya Pradesh, Himachal Pradesh and Goa recorded slower improvement despite their relatively higher starting levels.

    Challenges to raising the Female Labour Force Participation Rate

    1. The rise is concentrated in low productivity work: Most of the increase sits in self-employment, home based work and unpaid family labour, which raises participation without raising earnings. Eg. Over 64 per cent of working women are self-employed and nearly 64 per cent of working women are in agriculture. Fix. Link Self Help Group producers to the Open Network for Digital Commerce so household enterprise output reaches priced markets rather than local thrift.
    2. Unpaid care work caps available hours: Domestic and caregiving responsibility absorbs the working day before paid work is considered, which pushes women toward part time and proximate options. Eg. Women spend 363 minutes daily on unpaid work against 123 minutes for men. Fix. Raise care economy investment toward 2 per cent of Gross Domestic Product, which is estimated to create around 11 million jobs held largely by women.
    3. Mobility constraints narrow the job set: Unsafe transport and inadequate childcare restrict how far a woman can travel for work, so employers outside walking distance are effectively unavailable. Eg. Preference for nearby work pushes rural women into home based employment even where factory jobs exist in the district. Fix. Fund working women’s hostels and last mile transport on the Tamil Nadu Thozhi hostel model in industrial districts.
    4. Formal sector entry stays narrow: Manufacturing and much of services remain male dominated, so women who enter the labour force do not enter the formal payroll. Eg. Women are 43 per cent of Science, Technology, Engineering and Mathematics graduates but only 14 per cent of the corresponding workforce. Fix. Attach a minimum female workforce ratio as a qualifying condition for Production Linked Incentive disbursal.
    5. Hiring costs are loaded onto the employer: Statutory maternity cost sits entirely with the firm, which discourages some employers from hiring women of working age. Eg. The 26 week paid maternity leave entitlement, though progressive, can discourage some firms from hiring women. Fix. Move maternity benefit funding to a shared employer and social insurance pool rather than a single employer liability.
    6. Pay gaps blunt the incentive to stay: Women earn less than men for comparable work, which lowers the return on staying in the labour force after a break. Eg. India ranked 131st of 148 countries in the Global Gender Gap Report 2025. Fix. Enforce the equal remuneration provisions of the Code on Wages, 2019 through mandatory gender disaggregated pay reporting above a firm size threshold.

    Conclusion

    Female labour force participation has risen substantially since 2019-20, but the gain is rural rather than national, and the rural-urban gap has widened rather than narrowed. The State picture cannot be read off the pace of change alone: Bihar, Uttar Pradesh, West Bengal and Haryana are improving fast from a low rural base, while the five southern States are improving slowly from a high one, and both readings are correct. The unresolved question is composition, since a rise driven by self-employment and unpaid family work raises the participation rate without raising women’s earnings. Whether the trend converts into better outcomes depends on the movement of women into paid, formal and urban employment, which is exactly where the data shows the least progress.

    Back2Basics: Periodic Labour Force Survey

    1. Conducting body: The Periodic Labour Force Survey is conducted by the National Statistical Office under the Ministry of Statistics and Programme Implementation.
    2. When it began: It was launched in 2017, replacing the earlier quinquennial employment and unemployment surveys of the National Sample Survey Office.
    3. What it reports: It gives quarterly estimates for urban areas and annual estimates covering both rural and urban areas, and has moved to monthly release of key indicators.
    4. How it measures: It reports labour force indicators on both the usual status, based on activity over the preceding year, and the current weekly status, based on activity in the preceding seven days.

    “[2025, GS2, 10 marks] Women’s social capital complements in advancing empowerment and gender equity. Explain.”

  • Kerala having fewer kids – that’s bad news for teachers

    Why in the News

    Kerala's Public Service Commission recruited 6,114 people as teachers in government lower primary schools, and only 239 have been appointed so far. The shortfall traces to falling enrolment at the lower primary level, which is tied to the state's declining birth rate, so a completed demographic transition is now closing public teaching posts.

    What is staff fixation?

    1. About: Staff fixation is the exercise the Kerala Education Department conducts at the start of each academic year in June, in all government and aided schools, to fix the number of sanctioned teaching posts.
    2. Basis of the calculation: Posts are fixed on the number of students actually enrolled, and in the lower primary segment the teacher-student ratio applied is 1:30.
    3. Effect on vacancies: When a teacher retires, that vacancy can be filled only if that particular school continues to have the required number of students.
    4. Effect on serving teachers: Where a school falls below the required strength, the junior-most teacher can be removed from the post.

    What is the crude birth rate?

    1. About: The crude birth rate is the number of live births occurring in a year for every 1,000 people in the population, so it measures how fast a population is adding members without adjusting for its age structure.
    2. Why it is crude: It counts all persons in the denominator rather than only women of reproductive age, so a population with fewer young adults records a lower rate even at unchanged fertility per woman.

    What is a Public Service Commission rank list?

    1. About: A rank list is the ordered list of candidates who clear a Public Service Commission recruitment process, from which appointments are made in rank order as vacancies are reported by departments.
    2. Validity: A Kerala rank list is valid for a maximum period of three years, after which it lapses and candidates must compete afresh.

    Why are the recruited teachers not getting appointed?

    1. The recruitment figure: The Public Service Commission recruited 6,114 people as teachers in government lower primary schools for a period of three years starting June 2025.
    2. The appointment figure: Only 239 candidates have been appointed so far out of that list.
    3. The clock: The existing rank list expires in May 2028, and each such list runs for a maximum of three years.
    4. The protest: Rank holders have been on an indefinite agitation in front of the state secretariat, which has run for 41 days.
    5. The age barrier: Forty years is the upper age limit to apply for a government job in Kerala, so a candidate who ages out of the list has no second attempt.
    6. The stated cause: Stakeholders identify one key reason posts are not being filled, which is the fall in student enrolment at the lower primary level linked to declining birth rates.

    Who is waiting on the list?

    1. A candidate aged 40: One rank holder passed the teachers' training course 16 years ago in 2010, worked in government schools on daily wages for a few years, and is a single parent of two children.
    2. A candidate aged 27: Another completed the teachers' training course in 2017 at the age of 18, worked in various schools on a daily-wage basis, and figured in the 2019 supplementary rank list without securing a job because no appointments were made at the time.
    3. The aided school route: Aided school managements are demanding sums ranging from Rs 30 lakh to Rs 40 lakh for a post, which candidates from low-income households cannot pay.
    4. A returning migrant: A third candidate aged 36 worked as a salesman in the United Arab Emirates for 14 years before returning to Kerala and clearing the recruitment process.
    5. The protection cut-off: Teachers who joined schools up to 2022 are protected and can be redeployed if needed, and those appointed after 2022 are at risk of job loss and must wait for a new vacancy that rarely emerges.

    What does Kerala's enrolment data show?

    1. Four-year loss: Kerala's government and aided schools lost 3.33 lakh students between 2021-22 and 2025-26.
    2. The absolute numbers: Enrolment dipped from 38.68 lakh to 35.35 lakh over that period.
    3. First standard this year: Data presented in the Assembly shows 2,06,706 students enrolled in the first standard in government and aided schools following the state board syllabus this year.
    4. First standard last year: The corresponding figure in the last academic year was 2,34,476, a drop of 27,770 in a single year.
    5. The second cause: Apart from the declining birth rate, many parents are opting to send their children to private schools following the Central Board of Secondary Education syllabus.
    6. Consequence for posts: Scores of teaching jobs in the government sector have disappeared over the years for want of students.

    What does Kerala's birth rate trajectory show?

    1. The 1992 baseline: Kerala's crude birth rate was 17.67 in 1992 and stayed around that level for several years.
    2. The 2006 and 2010 readings: It slipped to 16.63 by 2006 and to 15.75 by 2010.
    3. Crossing below 15: The rate fell below 15 for the first time in 2016, at 14.48.
    4. The 2019 reading: It dropped again to 13.79 in 2019.
    5. The pandemic-period fall: It then declined by 1.02 between 2019 and 2020, and by a further 0.83 between 2020 and 2021, the sharpest consecutive falls in the series.

    Why is a demographic success now producing an employment problem?

    1. The achievement: A falling birth rate in Kerala is the outcome of high female literacy, near-universal schooling and low infant mortality, and it is treated as a development success.
    2. The mechanism that converts it into a loss: Staff fixation ties every teaching post to enrolment, so a smaller cohort of children mechanically reduces sanctioned posts.
    3. The lag between the two: Teacher training capacity and recruitment lists were built for an earlier cohort size, so supply of trained teachers continues even as demand contracts.
    4. The compounding factor: Migration of students to private schools following the Central Board of Secondary Education syllabus removes children from the government and aided system without reducing the total child population.
    5. The trap for candidates: A rank holder cannot be appointed against a post that no longer exists. The rank list lapses and the upper age limit closes the route to reapplying.

    Challenges to Teacher Recruitment in a Shrinking Cohort

    1. Posts tied to enrolment: Sanctioned posts fall automatically with enrolment, so recruitment cannot be planned independently of demographic trend. Eg. Kerala's government and aided schools lost 3.33 lakh students between 2021-22 and 2025-26.
    2. Rank lists that lapse unused: A three-year validity period runs out before the vacancies needed for appointment arise. Eg. The 2025 lower primary rank list carrying 6,114 names expires in May 2028 with 239 appointments made so far.
    3. Age limits that close the second attempt: Candidates who age out during the wait cannot reapply, which converts a delay into permanent exclusion. Eg. Forty years is the upper age limit for a government job in Kerala, and a rank holder aged 40 has no further attempt.
    4. Capitation in the aided sector: Aided school posts are effectively sold, which prices out candidates from low-income households. Eg. The Kerala Education Act, 1958 leaves appointment in an aided school with the private manager while the State pays the appointee's salary.
    5. Oversupply of trained teachers: Teacher training institutions continue to produce graduates against contracted demand. Eg. Candidates who completed the teachers' training course in 2010 and 2017 have spent years on daily-wage work without a regular post.
    6. Uneven protection across cohorts: Protection rules split serving teachers into secure and insecure groups by date of joining. Eg. Teachers who joined up to 2022 can be redeployed, and those appointed after 2022 face job loss when a school falls below strength.
    7. School viability at small sizes: Falling enrolment turns single-teacher and low-strength schools into candidates for closure or merger, which removes local access rather than only posts. Eg. Kerala has repeatedly had to designate uneconomic schools and protect them through special provisions.

    Conclusion

    Kerala's crude birth rate has fallen from 17.67 in 1992 to below 14 by 2019, with the steepest consecutive falls recorded in 2020 and 2021. Enrolment-linked staff fixation has translated that decline directly into sanctioned posts, so 6,114 recruited teachers have yielded 239 appointments and the rank list expires in May 2028. The state faces a planning problem rather than a recruitment problem, since teacher supply, school size norms and the pupil-teacher ratio were all set for a larger cohort. Resolving it requires revising the ratio, consolidating or repurposing low-strength schools, and aligning teacher training capacity with the demographic trend.

    What is Demographic Transition?

    1. About: Demographic transition is the shift a population makes from high birth and death rates to low birth and death rates as it develops economically and socially.
    2. Rationale: The model explains why population growth accelerates and then slows without any change in policy, since mortality falls before fertility does and the gap between the two produces the growth phase.
    3. Stage 1, high stationary: Both birth and death rates are high and fluctuate, so population size stays broadly stable with low growth.
    4. Stage 2, early expanding: Death rates fall sharply with better nutrition, sanitation and disease control, and birth rates stay high, which produces rapid population growth.
    5. Stage 3, late expanding: Birth rates begin to fall as education, urbanisation, female workforce participation and contraception spread, so growth slows.
    6. Stage 4, low stationary: Both rates are low, population growth approaches zero and the age structure ages, which is where Kerala now sits.
    7. Stage 5, declining: Birth rates fall below death rates and the population contracts absolutely, with a rising dependency burden of elderly persons.

    Key Concerns Regarding Demographic Transition

    1. Irreversibility: Once fertility falls well below replacement level, pronatalist policy has rarely restored it, so the smaller cohort persists for decades. Eg. South Korea's total fertility rate fell to about 0.7 despite years of cash incentives and parental leave expansion.
    2. A time-bound dividend: The working-age bulge that follows the fertility decline lasts only until that cohort ages, so the window for converting it into growth is finite. Eg. India's working-age share is projected to peak around the early 2040s, after which the dependency ratio begins to rise.
    3. Divergence within a federation: States complete the transition at different times, which creates simultaneous ageing in some States and youth pressure in others under one fiscal and political system. Eg. Bihar recorded a total fertility rate close to 3.0 in the fifth National Family Health Survey, the highest among the States.
    4. Ageing before affluence: Where the transition completes before per capita income rises, the state must fund pensions and elderly health care from a narrower base. Eg. China's population began ageing rapidly at a per capita income far below the level Japan had reached at the same age structure.
    5. Political representation: Population-based allocation of seats and fiscal transfers penalises the States that reduced fertility fastest, which links a public health achievement to a loss of political weight. Eg. Southern States objected to the Fifteenth Finance Commission's use of 2011 Census population, which reduced the weight given to their earlier fertility decline.

    Laws and Rules Governing School Education

    1. Right of Children to Free and Compulsory Education Act, 2009: Guarantees free and compulsory elementary education for children aged 6 to 14 and prescribes norms for schools.
    2. It prescribes a pupil-teacher ratio of 30:1 at the primary stage and 35:1 at the upper primary stage, and bars deployment of teachers for non-educational work other than census, disaster relief and election duty.
    3. Kerala Education Act, 1958 and the Kerala Education Rules, 1959: Govern government and aided schools in the State, including staff fixation, protection of teachers, and management obligations in aided schools.
    4. National Council for Teacher Education Act, 1993: Establishes the statutory body that regulates teacher education institutions and prescribes minimum qualifications for teachers.
    5. Right of Children to Free and Compulsory Education (Amendment) Act, 2019: Extended the deadline for serving teachers to acquire the prescribed minimum qualifications.
    6. National Education Policy, 2020: Sets the policy framework for school complexes, rationalisation of small schools, foundational literacy and numeracy, and a shift in the school structure to the 5+3+3+4 design.
    7. Kerala Public Service Commission rules: Govern rank list preparation, validity of three years, advice for appointment in rank order and the upper age limit for entry into government service.

    Government Initiatives

    1. Samagra Shiksha: The integrated centrally sponsored scheme for school education from pre-school to Class 12, covering teacher salaries, infrastructure, inclusive education and quality interventions.
    2. NIPUN Bharat Mission: Targets universal foundational literacy and numeracy by the end of Grade 3, with State-level implementation through Samagra Shiksha.
    3. PM SHRI Schools: Upgrades selected existing schools into model schools demonstrating the National Education Policy, 2020 in practice.
    4. PM POSHAN: Provides a hot cooked meal to children in government and government-aided schools from pre-primary to Class 8, which also supports attendance.
    5. Vidyanjali: A school volunteer initiative connecting alumni, professionals and community members to schools for teaching support and asset contribution.
    6. ULLAS Nav Bharat Saaksharta Karyakram: The adult education programme covering foundational literacy, critical life skills and vocational skills for non-literate adults aged 15 and above.
    7. National Programme for Elderly Care: The National Programme for the Health Care of the Elderly and the Atal Vayo Abhyuday Yojana provide geriatric health services and old age support, which are the counterpart of a completed demographic transition.

    Key Facts about Kerala's Demographic Profile

    1. Fertility position: Kerala's total fertility rate is around 1.5, well below the replacement level of 2.1, and among the lowest in the country.
    2. Literacy: Kerala recorded a literacy rate of about 94 per cent in the 2011 Census, the highest among the major States, and was declared India's first fully literate State in 1991.
    3. Sex ratio: Kerala has the highest sex ratio among the major States at 1,084 females per 1,000 males in the 2011 Census.
    4. Ageing: Kerala has the highest share of elderly persons among the major States, with those aged 60 and above forming a substantially larger share than the national average.
    5. Life expectancy: Kerala records the highest life expectancy at birth among Indian States, above 75 years.
    6. Infant mortality: Kerala reports the lowest infant mortality rate in the country, in the mid-single digits per 1,000 live births.
    7. World Population Day: Observed on 11 July each year.
    8. Multidimensional poverty: Kerala records the lowest multidimensional poverty headcount ratio in the country, at around 0.55 per cent.

    Back2Basics: Total Fertility Rate and Replacement Level Fertility

    1. Total fertility rate: The total fertility rate is the average number of children a woman would bear over her lifetime if she experienced the age-specific fertility rates observed in a given year.
    2. Why it differs from the birth rate: Unlike the crude birth rate, the total fertility rate is independent of the population's age structure, so it compares fertility behaviour across populations directly.
    3. Replacement level: Replacement level fertility is the level at which each generation exactly replaces itself, which is why the threshold sits at 2.1 rather than at 2.0.
    4. Why the threshold exceeds two: The additional 0.1 accounts for girls who do not survive to the end of their reproductive years and for the slight excess of male births over female births.
    5. India's position: The National Family Health Survey placed India's total fertility rate at 2.0, below replacement level for the first time.
    6. Data sources: The Sample Registration System of the Registrar General of India and the National Family Health Survey are the two principal sources of fertility estimates for India.
    7. State variation: Southern States and several smaller States record fertility well below replacement level, and a few large northern States remain above it. That gap is the source of interstate demographic divergence.
    8. Momentum: Population continues to grow for decades after fertility falls below replacement, because a large cohort of women is still passing through reproductive age.

    Challenges in Managing a Completed Demographic Transition

    1. Elderly care infrastructure: A rising share of elderly persons needs geriatric health, palliative care and long-term support that the health system was not built for. Eg. Kerala has the highest share of elderly persons among major States and runs one of the country's largest palliative care networks to cope.
    2. Pension and social security coverage: Most workers are outside contributory pension systems, so old age income support falls on State budgets. Eg. State social security pensions are among the largest recurring items in Kerala's revenue expenditure.
    3. Shrinking working-age base: A smaller entering cohort narrows the tax base, and commitments to the elderly rise at the same time. Eg. Kerala's first standard enrolment fell from 2,34,476 to 2,06,706 in a single year.
    4. Labour shortage and in-migration: Sectors dependent on manual labour recruit from other States, which brings its own housing, health and language integration questions. Eg. Kerala hosts a very large interstate migrant workforce in construction, hospitality and fisheries.
    5. Public asset underuse: Schools, anganwadis and child health facilities built for a larger cohort operate below capacity and become fiscally inefficient. Eg. Scores of government teaching posts in Kerala have lapsed for want of students.
    6. Delimitation and representation: Seat allocation based on population penalises States that completed the transition earliest. Eg. Lok Sabha seats have been frozen at 543 on 1971 Census figures, and southern States stand to lose seats in a population-based redistribution.
    7. Out-migration of the young: Educated young people migrate for work, which accelerates ageing at home and makes local recruitment queues longer for those who stay. Eg. Candidates on the Kerala teachers' rank list include one who worked in the United Arab Emirates for 14 years before returning.

    Way Forward

    1. Revise the pupil-teacher ratio: Lower the lower primary ratio from 1:30 so smaller classes are funded rather than left to shed posts, in line with the quality objectives of the National Education Policy, 2020.
    2. Consolidate through school complexes: Group low-strength schools into school complexes sharing teachers and specialist subjects, so access is retained without maintaining unviable standalone posts.
    3. Extend rank list validity where the state causes the delay: Provide statutory extension of a rank list, and relaxation of the upper age limit, where non-appointment results from a failure to report vacancies.
    4. Align teacher training capacity: Regulate intake into teacher training courses against projected cohort size, so training output does not exceed sanctioned posts by an order of magnitude.
    5. Enforce prohibition of capitation in aided schools: Prosecute the sale of aided school teaching posts, since Rs 30 lakh to Rs 40 lakh demands convert a public post into a purchased one.
    6. Redeploy surplus teachers to new roles: Absorb protected and surplus teachers into pre-primary education, special education, remedial instruction and adult literacy under ULLAS, rather than treating them as excess.
    7. Plan for ageing alongside schooling: Convert underused school and anganwadi infrastructure into day care and geriatric service centres, matching the asset base to the new age structure.

    Matching Previous Year Question

    “[2024, GS1, 10] What is the concept of a 'demographic winter'? Is the world moving towards such a situation? Elaborate.”

  • India’s Gendered Clock: 7.5 Hours for Women, Just 65 Minutes for Men

    Why in the News

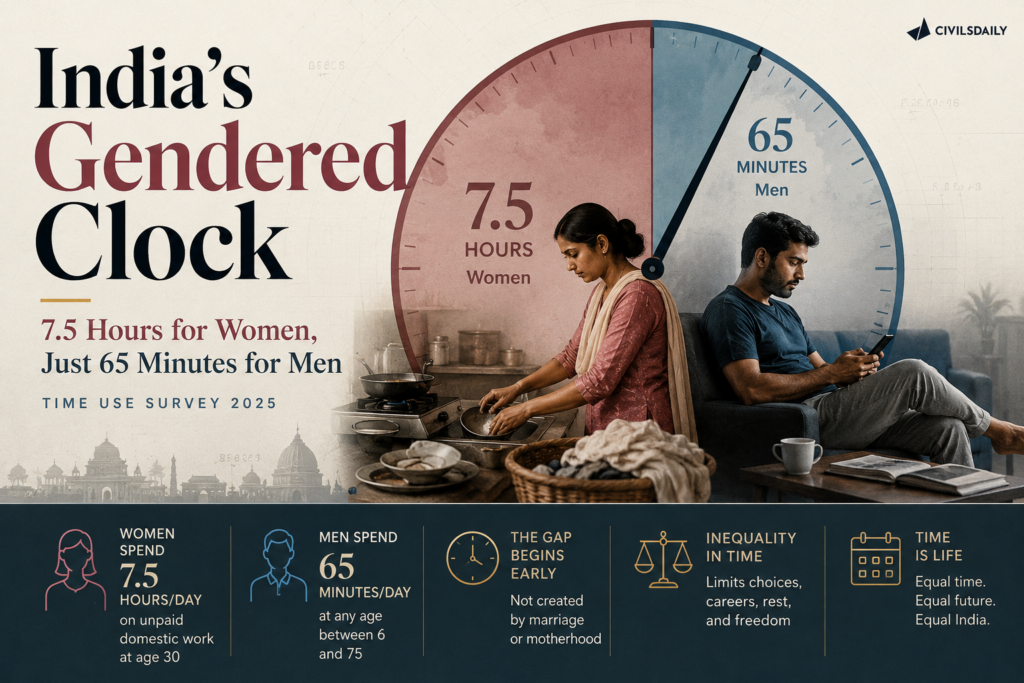
    India’s Time Use Survey (2025) shows the time women spend on housework rising from about age 10 to a peak of nearly 460 minutes a day, over 7.5 hours, around age 30, while the male curve never crosses 65 minutes at any age between six and 75. The gap is not created by marriage or motherhood, it is assembled in childhood, which places it outside the reach of policies aimed at adult women.

    What is the Time Use Survey?

    1. About: The Time Use Survey is a national household survey conducted by the National Statistics Office under the Ministry of Statistics and Programme Implementation, which records how members of a household allocate their 24 hours across activities on a reference day.
    2. What it captures: It measures activities that no other survey counts, including unpaid domestic services, unpaid caregiving, learning, leisure, self care and volunteer work, alongside paid employment.
    3. Why it exists: Employment surveys count only work inside the production boundary, so time spent cooking or caring for a child disappears from official statistics unless a time use survey records it.

    What is unpaid domestic and caregiving work?

    1. About: Unpaid domestic and caregiving work covers cooking, cleaning, laundry, shopping, collection of water and fuel, minor repairs, and the care of children, the sick and the elderly performed for one’s own household without payment.
    2. Its statistical treatment: These services are produced by households for their own consumption and fall outside the production boundary of the System of National Accounts, so they contribute nothing to measured Gross Domestic Product despite being economically essential.

    What is the Periodic Labour Force Survey?

    1. About: The Periodic Labour Force Survey (PLFS) is the National Statistics Office’s regular survey of employment and unemployment, which estimates the labour force participation rate, worker population ratio and unemployment rate.
    2. Its relevance here: It records the reason given for staying outside the labour force, which is where unpaid domestic responsibility appears as a measured cause of women’s non participation.

    What does the lifetime housework curve show?

    1. The female curve: Time spent on housework begins to rise around age 10, continues through the late teens and twenties, and peaks at nearly 460 minutes a day, over 7.5 hours, around age 30.
    2. The male curve: It never crosses 65 minutes at any age between six and 75, so there is no stage of the male life cycle at which domestic work becomes a substantial claim on time.
    3. Timing of the peak: The peak falls in the prime working years, which is precisely when paid work, promotion and enterprise building compete for the same hours.
    4. The continuity point: Adolescence is not separate from adulthood in this data, it is the stage at which the adult pattern begins to take shape.

    How early does the gender gap in domestic work open?

    1. Parity at age six: Indian boys and girls both spend about five minutes a day on domestic and care work at age six, and their trajectories remain close through early childhood.
    2. The girls’ curve: Girls spend about 15 minutes a day at age 10, 75 minutes at 15, and around 130 minutes by 17.
    3. The boys’ curve: Boys move from roughly five minutes at age six to only about 17 minutes by the end of childhood.
    4. The widening ratio: The girl to boy ratio in unpaid work rises from 1.6 among children aged 6 to 9, to 4.5 among those aged 10 to 14, and to 7.5 among adolescents aged 15 to 17.
    5. The divergence point: The curves separate sharply from around age 10, which is the same age at which the adult female housework curve begins its climb.

    Why is leisure, not schooling, the real cost?

    1. The trade off is usually framed wrongly: The cost of girls’ domestic work is normally argued as a trade off with schooling and education, and the data does not support that framing.
    2. Girls are not losing study time: Girls spend slightly more time on learning than boys at most ages, so they remain in school while carrying the additional work.
    3. Leisure absorbs the burden: Between ages six and 17, girls’ housework rises by roughly 124 minutes a day while their leisure time falls by around 115 minutes a day.
    4. The boys’ pattern: For boys the decline in leisure is much smaller and the time spent on housework changes relatively little.
    5. Why leisure is not residual: Sport, friendships, rest and exploration are how children build confidence, social networks, physical capability and a sense of agency, all of which shape later career trajectories.
    6. The measurement blind spot: School enrolment and learning outcome data register no problem at all, because the loss is entirely in discretionary time.

    Why does cooking sit at the centre of the divergence?

    1. Participation gap in cooking: Among adolescents aged 15 to 17, 42.4 percent of girls report cooking, against only 2.9 percent of boys.
    2. Time gap in cooking: Girls in this age group spend close to an hour cooking, while boys spend just two minutes.
    3. Other gendered tasks: Cleaning and laundry also become increasingly gendered through adolescence, with wide gaps in both participation and time spent.
    4. Where boys match or exceed girls: The only tasks are farm work and shopping, which are outward facing towards the field and the market rather than inward facing into the kitchen.
    5. The full task set measured: Participation is recorded across childcare, cleaning, cooking, farm work, laundry, repairs, shopping and collection of water and fuel, and the inward facing tasks are the ones that carry the gap.
    6. What the allocation trains: Girls are being trained for the household and boys for the world outside, which is how the pattern later appears as an efficient gendered allocation of household work.

    How does childhood conditioning surface in the labour market?

    1. The stated reason for non participation: In the 2025 PLFS, childcare and domestic responsibilities were the single most cited reason women gave for staying out of the labour force.
    2. The urban and rural split: The reason was reported by 52.5 percent of urban women and 40 percent of rural women.
    3. The male comparison: Less than 1 percent of men gave the same reason, so the constraint is not a household constraint but a gendered one.
    4. The field observation behind the data: Among rural women in Haryana aspiring to become entrepreneurs, the biggest practical constraint on doing more paid work was time tied up in cooking and household chores, and their daughters rather than their sons were already sharing that burden.

    Why do current policy interventions arrive too late?

    1. Where policy currently intervenes: Most interventions address women’s unpaid work in adulthood, through childcare services, community kitchens, safe mobility infrastructure, flexible work and social protection.
    2. What that misses: The unequal assignment of domestic work between boys and girls has already been completed before any of these instruments touch a woman’s life.
    3. The correct objective: The aim is not to remove domestic work from children’s lives, but to remove its gender assignment.
    4. The school as the instrument: Schools can give every child, boy or girl, equal opportunity to learn practical life skills, from cooking and home management to stitching, carpentry and financial management.
    5. The gap in India’s own success: India has invested heavily in keeping girls in school and improving their educational outcomes, and paid no comparable attention to what happens to their time outside school.

    Challenges to removing the gender assignment of domestic work

    1. Norms are transmitted inside the household, where policy has no instrument: No scheme reaches the daily decision about which child is called into the kitchen. e.g. mothers in rural Haryana who identified their own time poverty still passed the chores to daughters rather than sons.
    2. The burden is invisible in every headline indicator: Enrolment, learning outcomes and even attendance stay unaffected while leisure collapses. e.g. girls in the survey spend slightly more time learning than boys even while doing seven times the domestic work at 15 to 17.
    3. Infrastructure deficits convert directly into girls’ time: Where water, fuel and sanitation are distant, the collection task falls on girls. e.g. households without piped water where fetching water is a daily pre school chore.
    4. School curricula reinforce the split rather than break it: Vocational and life skill options remain gender typed in practice. e.g. home science and tailoring offered to girls while carpentry, electrical work and workshop practice fill with boys.
    5. Measurement is infrequent: Time use data arrives too rarely to evaluate whether an intervention shifted the allocation. e.g. India ran a pilot time use survey in 1998 to 1999 and its first full national round only two decades later.
    6. Care substitutes are absent for adolescent siblings: Where creche and elder care services are missing, the eldest daughter becomes the default carer. e.g. adolescent girls withdrawn from leisure and play to mind younger siblings while parents do wage work.
    7. Employment law does not reach unpaid household work: No labour statute assigns rights, hours or rest to domestic work performed inside one’s own home. e.g. maternity and creche entitlements under labour law apply to formal employment, covering a small minority of working women.

    Conclusion

    The gender gap in unpaid work is not a marriage effect or a motherhood effect, it is set in place between the ages of 10 and 17 and simply expands afterwards to 7.5 hours a day by age 30. The price girls pay is measured in leisure rather than schooling, which is why India’s success in keeping girls in school has concealed it. Policy instruments built for adult women arrive after the allocation is fixed. The intervention point is the childhood assignment of domestic tasks, and schools that teach cooking, home management, carpentry and financial management to every child are the instrument available now.

    [2024, GS1, 10 marks] Distinguish between gender equality, gender equity and women’s empowerment. Why is it important to take gender concerns into account in programme design and implementation?

  • Registrar General notifies 40 questions for Phase 2 population enumeration of Census 2027 with 13 new questions and web based self enumeration

    Why in the News

    The Registrar General and Census Commissioner of India notified 40 questions on 14 August for Population Enumeration, the second phase of Census 2027. The expansion from the 29 questions of Census 2011 to 40, including identity document numbers and the place of COVID-19 vaccination, has shifted the debate from how India counts its people to how much personal information a census may record.

    What is the Population Enumeration phase of the Census?

    1. About: It is the second and principal phase of the census, in which every individual present in a household is recorded with their demographic, social and economic particulars.
    2. What precedes it: The first phase, House Listing Operations, records buildings, households and household amenities rather than persons.
    3. Reference date: Every entry relates to a fixed reference moment, so that a person is counted once and only once across the country.
    4. Method of collection: Enumerators canvass each household with a schedule of notified questions, supplemented in this round by a web portal.
    5. Who notifies the questions: The Registrar General and Census Commissioner of India notifies the questionnaire after several rounds of consultation with all ministries.

    What is House Listing Operations?

    1. About: It is the first phase of the census, which lists every building and every household and records the amenities and assets each household holds.
    2. When it was held: For Census 2027 it was conducted from April 2026, and self enumeration was offered before it in June.

    What is the extended de facto method of enumeration?

    1. About: Under this method every person present at a location during the enumeration period is counted at that location, whether or not it is their permanent home.
    2. Why it is used: It prevents both the omission of the homeless and mobile and the double counting of persons who have moved between the two phases.

    What is self enumeration?

    1. About: It allows a household to fill in its own census schedule on an official web portal instead of waiting for an enumerator.
    2. How it is secured: The option is georeferenced, so access is restricted to devices located within the notified area for which it has been opened.

    What changes in the Census 2027 questionnaire?

    1. Total questions: The Population Enumeration schedule carries 40 questions, against 29 questions in the Census 2011 schedule.
    2. New additions: 13 new questions appear that were not part of the 2011 questionnaire.
    3. Family and identity fields: The new set records the spouse’s name, nationality, the particulars of the father and mother, and the permanent address.
    4. Document fields: It records the passport, driving licence, mobile number, Aadhaar number and voter identity number, in each case only if available.
    5. Access and asset fields: It records digital literacy and the number of bank accounts an individual holds.
    6. Health field: It records the place of COVID-19 vaccination.
    7. Caste enumeration: The Population Census will separately enumerate caste, alongside these new data fields.

    What rationale and what safeguards accompany the new data fields?

    1. How the questions were settled: The questions were decided after several rounds of discussion with all ministries, each seeking data for its own planning use.
    2. Only government issued documents: The identity documents sought, meaning Aadhaar, voter identity card, driving licence and passport, are all issued by the government itself.
    3. No account details: Enumerators will record only the number of bank accounts an individual holds, not the account details.
    4. Availability condition: Respondents provide these particulars subject to availability, so absence of a document does not obstruct enumeration.
    5. Statutory confidentiality: All data collected is confidential under the Census Act, 1948.
    6. Practical advice to households: Respondents should write their details down on paper before an enumerator arrives, since 40 questions take longer to answer.
    7. Fraud warning: Fraudsters may seek information in the name of the census, and enumerators carry QR code enabled identity cards whose credentials can be verified.

    How will self enumeration operate in Jammu and Kashmir and Ladakh?

    1. Coverage: The option opens for the entire Union Territory of Ladakh and for the snow bound areas of 16 districts of Jammu and Kashmir.
    2. Sequence of operations: The web portal opens on 17 August, and door to door enumeration begins on 1 September.
    3. Geographic restriction: The option is georeferenced and available only within the snow bound areas themselves.
    4. Effect of that restriction: A resident of a snow bound area such as Gurez who is currently in the plains cannot access the portal.
    5. Uptake in the first phase: More than 6.67 lakh households in Jammu and Kashmir and 7,009 households in Ladakh voluntarily completed self enumeration before House Listing Operations in June.
    6. Counting rule applied: Under the extended de facto pattern, everyone present at a location will be counted there.

    Why does Census 2027 carry particular significance for the two Union Territories?

    1. First count after the constitutional change: It will provide the first comprehensive demographic picture of Jammu and Kashmir after the abrogation of Article 370.
    2. First count of a new Union Territory: It will be the first Census of Ladakh as a Union Territory.
    3. Length of the gap: It updates population figures after a gap of more than a decade.
    4. Range of data generated: It will generate data on population distribution, migration, age structure, housing, education, employment, fertility, disability and social composition.
    5. Administrative use: That data feeds planning and resource allocation for two administrations without a recent baseline.
    6. Why geography is the focus: Demographic realities vary sharply across urban centres, border districts, remote mountain villages and tribal areas, so the census aims to capture where people live, how they live and how those patterns are changing.

    What makes enumeration in these two Union Territories difficult?

    1. Dispersed settlement in Jammu and Kashmir: The population is spread across cities, villages, mountainous regions, border areas and tribal habitations.
    2. Seasonal migration: Movement between summer and winter settlements complicates the fixing of a household’s location.
    3. Altitude and terrain in Ladakh: The population lives across a vast high altitude region marked by dispersed settlements.
    4. Connectivity and access: Difficult connectivity, seasonal accessibility and remote locations restrict when and how enumerators can reach households.
    5. The accuracy requirement: The exercise must capture not only headcount but the way population distribution varies across these terrains.

    How will nomadic and displaced populations be counted?

    1. Inter departmental coordination: Special coordination with the departments dealing with forests, tribal affairs and local administration will identify migratory routes and seasonal settlements.
    2. Nomadic communities: The routes and seasonal settlements of the Gujjar-Bakarwals and other nomadic groups will be mapped before enumeration.
    3. The stated objective: Mobility must not translate into undercounting.
    4. Displaced communities: Kashmiri Pandits will be recorded according to established Census concepts and reference dates.
    5. What is captured for them: Their migration history and household characteristics will be recorded alongside the standard schedule.

    Challenges to Census 2027

    1. Undercounting of mobile populations: Pastoral and migrant groups move between the reference date and the enumeration window. e.g. Gujjar-Bakarwal families move to high altitude summer pastures in the Pir Panjal and Ladakh ranges precisely during the enumeration months.
    2. Privacy exposure from identity fields: Recording Aadhaar, voter identity, passport and mobile numbers against a household creates a re identification risk if any downstream database is compromised. e.g. successive breaches of health and telecom databases in India have shown how linked identifiers enable profiling.
    3. Impersonation and cyber fraud: The census provides cover for fraudsters seeking financial credentials. e.g. callers posing as enumerators have previously sought Aadhaar and bank details during welfare verification drives.
    4. Enumerator capacity and quality: Enumeration is done by government employees deployed on top of their regular duties. e.g. schoolteachers form the bulk of enumerators, which interrupts academic schedules and limits training time.
    5. Digital divide in self enumeration: The portal presumes a smartphone, connectivity and literacy in the interface language. e.g. snow bound districts of Jammu and Kashmir carry among the lowest mobile internet reliability in the country.
    6. Delay in the decennial cycle distorts planning: Entitlements calculated on outdated population figures under count beneficiaries. e.g. National Food Security Act, 2013 coverage has continued to use Census 2011 population figures despite population growth since.
    7. Caste enumeration classification: Recording caste requires a settled list of categories and spellings across states. e.g. the 1931 Census recorded over 4,000 caste entries, and Bihar’s 2023 state survey used a far shorter list of 214 categories.

    Conclusion

    Population Enumeration begins on 17 August in Ladakh and the snow bound areas of Jammu and Kashmir, Himachal Pradesh and Uttarakhand and runs till 30 September, ahead of the rest of the country, which will be enumerated in February 2027. Self enumeration on the web portal opens the same day, and door to door enumeration in these areas begins on 1 September. The exercise will produce the first full demographic account of Jammu and Kashmir since the constitutional change of 2019 and the first Census of Ladakh as a Union Territory.

    The Census in India

    1. About: The census is the complete enumeration of every person in the country at a fixed reference moment, together with their demographic, social and economic characteristics.
    2. Administering body: The Office of the Registrar General and Census Commissioner of India, set up in 1961, functions under the Ministry of Home Affairs and conducts the census, the Civil Registration System and the Sample Registration System.
    3. Two phase structure: Every census is conducted in two phases, House Listing Operations followed by Population Enumeration.
    4. Scale: It is the largest peacetime administrative exercise in the world, deploying around 34 lakh enumerators and supervisors to cover more than 1.4 billion people.
    5. Historical continuity: India has conducted a census every ten years since 1881 without interruption until the 2021 round was postponed.
    6. What is new in 2027: Census 2027 will be the first digital census, using a mobile application and a self enumeration portal, and the first to enumerate caste since 1931.
    7. Why the numbers matter: Census figures determine delimitation of constituencies, the population criterion in the Finance Commission’s devolution formula, reservation of seats, and the coverage of welfare entitlements.

    Constitutional Provisions Related to the Census

    1. Entry 69, Union List, Seventh Schedule: Places census exclusively within the legislative competence of Parliament.
    2. Article 246: Distributes legislative power between the Union and the States across the three Lists, which is what makes Entry 69 a Union subject.
    3. Article 81: Fixes the composition of the Lok Sabha and requires seats to be allotted to States in proportion to population.
    4. Article 82: Requires readjustment of the allocation of Lok Sabha seats and the division of States into constituencies after every census.
    5. Article 170: Requires the same readjustment for State Legislative Assemblies after every census.
    6. Article 55: Uses population figures in computing the value of votes in the presidential electoral college, with the 84th Amendment fixing the 1971 figures for this purpose.
    7. Articles 330 and 332: Base the reservation of seats for Scheduled Castes and Scheduled Tribes in the Lok Sabha and State Assemblies on their population share.
    8. Articles 243D and 243T: Base reservation of seats in panchayats and municipalities on population proportions drawn from census data.

    Laws and Rules Governing the Census

    1. Census Act, 1948: Provides the legal authority to conduct a census, appoint census officers and require the public to answer questions.
    2. Section 8: Places a legal obligation on every occupier and every person to answer census questions truthfully.
    3. Section 15: Makes census records confidential, not open to inspection and inadmissible as evidence in any legal proceeding, so an individual’s return cannot be used against them.
    4. Census Rules, 1990: Lay down the procedural framework for appointment of census staff, canvassing and record keeping.
    5. Registration of Births and Deaths Act, 1969: Establishes the Civil Registration System administered by the same Registrar General, which supplies continuous vital statistics between censuses.
    6. Citizenship Act, 1955 and the Citizenship (Registration of Citizens and Issue of National Identity Cards) Rules, 2003: Provide for the National Population Register, a separate register of usual residents, distinct in law from the census.
    7. Collection of Statistics Act, 2008: Governs other official statistical collections and their confidentiality obligations.

    Back2Basics: Census Act, 1948

    1. Enactment: Passed in 1948 and extending to the whole of India, it is the permanent statutory basis for every decennial census.
    2. Trigger: The Central Government notifies its intention to take a census, and the dates, through a gazette notification.
    3. Machinery: It provides for the appointment of a Census Commissioner, Directors of Census Operations, and census officers down to the enumerator level, with defined powers to ask questions.
    4. Public obligation: Every person is legally bound to answer the questions put to them truthfully, and refusal or a false answer is punishable.
    5. Confidentiality guarantee: Individual records are not open to public inspection and are inadmissible as evidence, so census data cannot be used for enforcement against any individual.
    6. Penalties: The Act penalises both a census officer who discloses information and a respondent who gives a false answer.
    7. Nature of the data: Only aggregated statistical tables are published, never individual returns.

    Government Initiatives Related to Population Data

    1. Census 2027 digital application and monitoring portal: Enumeration, supervision and data validation move to a mobile application backed by a central management and monitoring system, replacing paper schedules.
    2. Self Enumeration portal: Allows households to complete their own census schedule online, with georeferencing to restrict access to the notified area.
    3. National Population Register: A register of usual residents maintained under the Citizenship Act, 1955, first prepared alongside the 2011 House Listing phase and updated in 2015.
    4. Civil Registration System: Continuous compulsory registration of births and deaths under the 1969 Act, providing vital statistics between census years.
    5. Sample Registration System: A large scale sample survey run by the Registrar General that generates annual birth rate, death rate and infant mortality estimates.
    6. National Family Health Survey: Conducted under the Ministry of Health and Family Welfare, it supplies fertility, nutrition and health indicators that complement census counts.
    7. Census data portals: Census tables are published for public use through the official census portal and the National Data and Analytics Platform.

    Key Facts about the Census

    1. The first census in India was conducted in 1872 under Lord Mayo, and was non synchronous across provinces.
    2. The first synchronous and complete census was held in 1881 under Lord Ripon, and the decennial series has run from that year.
    3. Census 2011 was the 15th census since 1872 and the 7th after Independence, recording a population of 121.09 crore, a density of 382 persons per square kilometre, a sex ratio of 943 and a literacy rate of 74.04 percent.
    4. Census 2027 will be the 16th census, the first digital census, and the first to enumerate caste since 1931.
    5. The reference date for Census 2027 is 1 March 2027 for most of the country, and 1 October 2026 for snow bound and non synchronous areas.
    6. The Office of the Registrar General and Census Commissioner of India was set up in 1961 and works under the Ministry of Home Affairs.
    7. Census figures govern delimitation, which stands frozen under the 84th and 87th Constitutional Amendments until the first census taken after 2026.

    Challenges in Census Taking in India

    1. Disruption of the decennial cycle: A postponed census leaves every population dependent policy working on stale figures. e.g. the 2021 round was deferred and India will have gone sixteen years between full counts.
    2. Undercount of the homeless and of migrants: Persons without a fixed dwelling are systematically missed. e.g. Census 2011 recorded about 17.7 lakh homeless persons, a figure civil society organisations widely regard as an undercount.
    3. Classification difficulties in caste enumeration: Caste names vary by spelling, region and sub group, which makes tabulation contested. e.g. the 1931 Census produced over 4,000 caste entries that could not be aggregated cleanly.
    4. Urban definition problems: Statistical and administrative definitions of urban areas diverge. e.g. census towns satisfy the census definition of urban but continue to be governed by rural panchayats without urban service standards.
    5. Enumerator burden and data quality: Enumerators are serving government staff performing census duty in addition to their jobs. e.g. schoolteachers form the bulk of the enumerator pool, which limits training depth and interrupts teaching.
    6. Data security in a digital census: Digitised individual level records create risks that paper schedules did not. e.g. a mobile application that stores identity numbers requires encryption and access control standards that do not exist in the Census Act, 1948.
    7. Political sensitivity of population figures: Census numbers directly determine seats and money, which makes them contested. e.g. southern States have objected to the use of current population for delimitation on the ground that it penalises successful fertility decline.

    Way Forward

    1. Legislate a data protection layer over census data: Extend explicit statutory protection to digitally stored individual records, since the Census Act, 1948 predates digital collection.
    2. Publish a clear separation between the Census and the National Population Register: State in the notification itself that census returns cannot be transferred to any citizenship or enforcement register.
    3. Expand assisted self enumeration: Provide common service centre and panchayat level assistance so that self enumeration does not exclude those without smartphones.
    4. Build a special enumeration protocol for mobile groups: Fix pastoral and nomadic enumeration to the migration calendar rather than the general schedule.
    5. Restore and legally fix the decennial cycle: Commit to a statutory timetable so that welfare, devolution and delimitation are never based on a sixteen year old count again.
    6. Standardise the caste enumeration schema in advance: Publish a national list of caste categories and their state variants before enumeration begins to make tabulation usable.
    7. Release disaggregated data quickly: Publish primary census abstracts and district level tables within a fixed period after enumeration so that planning use is not delayed further.

    Matching Previous Year Question

    “[2009] Consider the following statements:
    1. Between Census 1951 and Census 2001, the density of the population of India has increased more than three times.
    2. Between Census 1951 and Census 2001, the annual growth rate (exponential) of the population of India has doubled.
    Which of the statements given above is/are correct?
    (a) 1 only
    (b) 2 only
    (c) Both 1 and 2
    (d) Neither 1 nor 2
    Answer: (d)”

  • Tribal Council says Shompen concerns overlooked in the Great Nicobar Island project

    Why in the News?

    The Tribal Council of Great and Little Nicobar has raised concerns that the Great Nicobar Island (GNI) Project could lead to assimilation and disturbance of the Shompen, a Particularly Vulnerable Tribal Group (PVTG).

    What is the GNI Project?

    • Large infrastructure and township project in Great Nicobar.
    • Estimated cost: around ₹91,000 crore.
    • Includes a proposed power plant at Galathea, near Shompen settlements.

    Who are the Shompen?

    • Hunter-gatherer indigenous community.
    • Fewer than 300 members.
    • Recognised as a PVTG.
    • Their isolation makes contact, displacement and forced assimilation particularly sensitive.

    What are PVTGs?

    • PVTG = Particularly Vulnerable Tribal Group: Identified based on characteristics such as:
    • Pre-agricultural technology
    • Low literacy
    • Stagnant or declining population
    • Economic backwardness
    • India recognises 75 PVTGs.

    Key Concerns

    • Assimilation: Proposal to shift the Shompen towards a modern lifestyle.
    • Displacement: Concern over possible settlement and relocation.
    • Consent: Questions regarding consultation over wildlife reserves and project decisions.
    • Health risks: Contact with isolated communities can expose them to diseases and other risks.
    • Assurance gap: Earlier assurance stated that the project would not disturb or displace the Shompen.

    Laws Protecting Tribal Rights

    • Forest Rights Act, 2006: Recognises individual and community forest rights.
    • PESA, 1996: Provides self-governance and consent provisions in Scheduled Areas.
    • Andaman and Nicobar Islands (Protection of Aboriginal Tribes) Regulation, 1956: Restricts entry into tribal reserves.

    Government Initiatives

    • PM-JANMAN: Development of PVTG households and habitations.
    • Development of PVTGs Scheme: Habitat-specific support for 75 PVTGs.

    “[2009] In which one of the following places is the Shompen tribe found?

    (a) Nilgiri Hills

    (b) Nicobar Islands

    (c) Spiti Valley

    (d) Lakshwadeep Islands