💥Join UPSC 2027,2028 Mentorship (July Batch) + XFactor Notes & Microthemes PDF

Search results for: “”

  • China Achieves First Controlled Recovery of Reusable Rocket Booster

    Why in News?

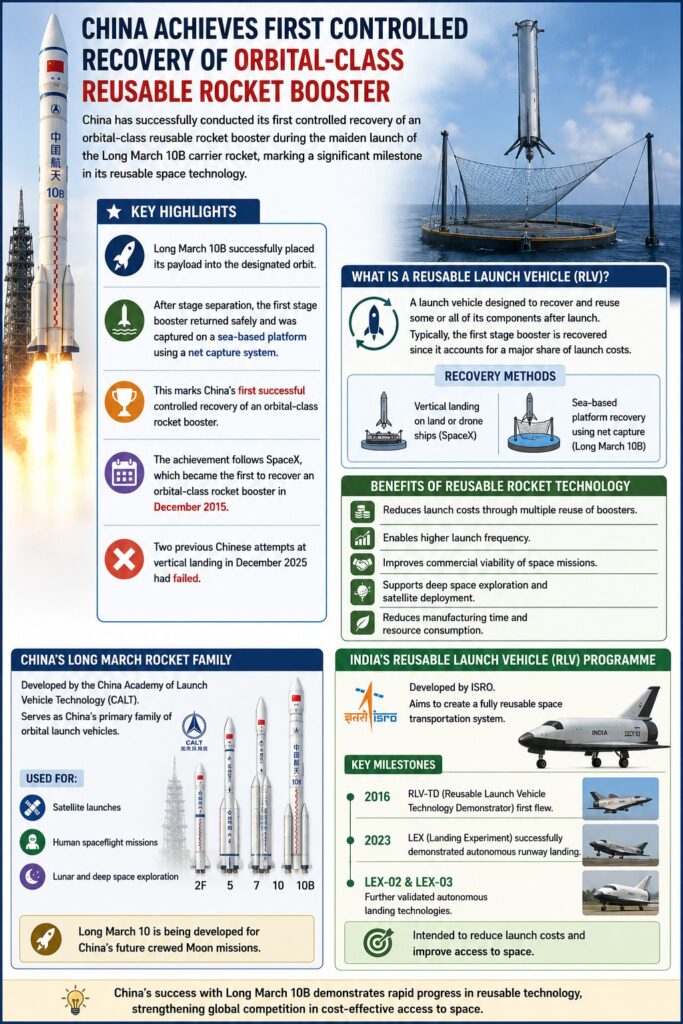
    China has successfully conducted its first controlled recovery of an orbital class reusable rocket booster during the maiden launch of the Long March 10B carrier rocket, marking a significant milestone in its reusable space technology.

    Key Highlights

    • Long March 10B successfully placed its payload into the designated orbit.
    • After stage separation, the first stage booster returned safely and was captured on a sea based platform using a net capture system.
    • This marks China’s first successful controlled recovery of an orbital class rocket booster.
    • The achievement follows SpaceX, which became the first to recover an orbital class rocket booster in December 2015.
    • Two previous Chinese attempts at vertical landing in December 2025 had failed.

    What is a Reusable Launch Vehicle (RLV)?

    • A launch vehicle designed to recover and reuse some or all of its components after launch.
    • Typically, the first stage booster is recovered since it accounts for a major share of launch costs.
    • Recovery methods include:
      • Vertical landing on land or drone ships (SpaceX).
      • Sea based platform recovery using net capture (Long March 10B).
    • Reusability significantly lowers the cost of access to space.

    Benefits of Reusable Rocket Technology

    • Reduces launch costs through multiple reuse of boosters.
    • Enables higher launch frequency.
    • Improves commercial viability of space missions.
    • Supports deep space exploration and satellite deployment.
    • Reduces manufacturing time and resource consumption.

    China’s Long March Rocket Family

    • Developed by the China Academy of Launch Vehicle Technology (CALT).
    • Serves as China’s primary family of orbital launch vehicles.
    • Used for: Satellite launches. Human spaceflight missions. Lunar and deep space exploration.
    • Long March 10 is being developed for China’s future crewed Moon missions.

    India’s Reusable Launch Vehicle (RLV) Programme

    • Developed by ISRO.
    • Aims to create a fully reusable space transportation system.
    • Key milestones:
      • RLV-TD (Reusable Launch Vehicle Technology Demonstrator) first flew in 2016.
      • LEX (Landing Experiment) successfully demonstrated autonomous runway landing in 2023.
      • LEX-02 and LEX-03 further validated autonomous landing technologies.
    • Intended to reduce launch costs and improve access to space.

    [2018] With reference to India’s satellite launch vehicles, consider the following statements :
    1.PSLVs launch satellites useful for Earth resources monitoring whereas GSLVs are designed mainly to launch communication satellites.
    2.Satellites launched by PSLV appear to remain permanently fixed in the same position in the sky, as viewed from a particular location on Earth.
    3.GSLV Mk III is a four-stage launch vehicle with the first and third stages using solid rocket motors, and the second and fourth stages using liquid rocket engines.
    Which of the statements given above is/are correct?

    [A] 1 only

    [B] 2 and 3

    [C] 1 and 2

    [D] 3 only
  • Government Tightens Regulation of High Alcohol Containing Drug Formulations

    Why in News?

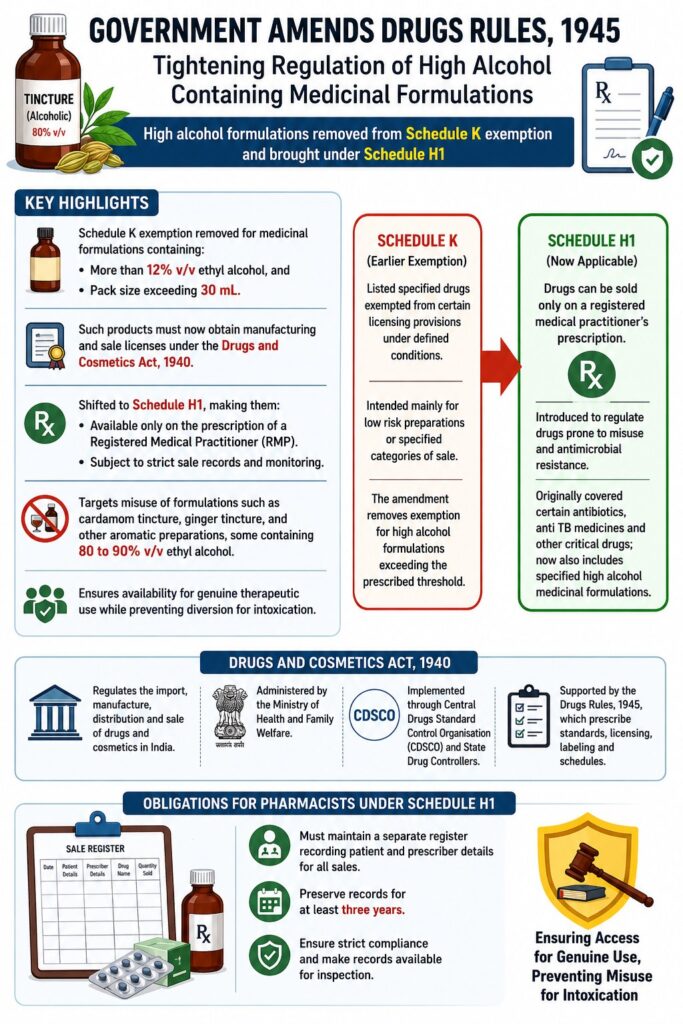
    The Central Government has amended the Drugs Rules, 1945 to tighten regulation of high alcohol containing medicinal formulations, removing their exemption under Schedule K and bringing them under Schedule H1.

    Key Highlights

    • Schedule K exemption removed for medicinal formulations containing:
      • More than 12% v/v ethyl alcohol, and
      • Pack size exceeding 30 mL.
    • Such products must now obtain manufacturing and sale licenses under the Drugs and Cosmetics Act, 1940.
    • Shifted to Schedule H1, making them:
      • Available only on the prescription of a Registered Medical Practitioner (RMP).
      • Subject to strict sale records and monitoring.
    • Targets misuse of formulations such as cardamom tincture, ginger tincture, and other aromatic preparations, some containing 80 to 90% v/v ethyl alcohol.
    • Ensures availability for genuine therapeutic use while preventing diversion for intoxication.

    Drugs and Cosmetics Act, 1940

    • Regulates the import, manufacture, distribution and sale of drugs and cosmetics in India.
    • Administered by the Ministry of Health and Family Welfare.
    • Implemented through the Central Drugs Standard Control Organisation (CDSCO) and State Drug Controllers.
    • Supported by the Drugs Rules, 1945, which prescribe standards, licensing, labeling and schedules.

    Schedule K

    • Lists specified drugs exempted from certain licensing provisions under defined conditions.
    • Intended mainly for low risk preparations or specified categories of sale.
    • The amendment removes exemption for high alcohol formulations exceeding the prescribed threshold.

    Schedule H1

    • Introduced to regulate drugs prone to misuse and antimicrobial resistance.
    • Drugs can be sold only on a registered medical practitioner’s prescription.
    • Pharmacists must:
      • Maintain a separate register recording patient and prescriber details.
      • Preserve records for at least three years.
    • Originally covered certain antibiotics, anti TB medicines and other critical drugs; now also includes specified high alcohol medicinal formulations.

    [2018] Consider the following statements:

    1. The Food Safety and Standards Act, 2006 replaced the Prevention of Food Adulteration Act, 1954.
    2. The Food Safety and Standard Authority of India (FSSAI) is under the charge of Director General of Health Services in the Union Ministry of Health and Family Welfare.
    Which of the statements given above is/are correct?

    (a) 1 only

    (b) 2 only

    (c) Both 1 and 2

    (d) Neither 1 nor 2

  • [10th July 2026] The Hindu OpED: Building a durable India-Australia partnership

    PYQ Relevance[UPSC 2024] The West is fostering India as an alternative to reduce dependence on China’s supply chain and as a strategic ally to counter China’s political and economic dominance. Explain this statement with examples
    Linkage: The article shows India and Australia strengthening cooperation in critical technologies, resilient supply chains and maritime security to reduce dependence on China and manage its strategic influence in the Indo-Pacific.

    Mentor’s Comment

    Prime Minister Narendra Modi’s visit to Australia produced a cluster of institutional deliverables, a defence MoU, a maritime security roadmap, an operationalised uranium supply deal, and a new critical-technology partnership. The visit has sharpened the question of whether India and Australia have moved from independently arriving at similar strategic conclusions (convergence) to building genuinely interlocked capabilities and institutions (alignment).

    Why Is Strategic Convergence Between India and Australia Deepening?

    1. Shared hedging instinct: Both countries face structural risk from single-point dependence, Australia economically on China and militarily on the United States, India across its energy suppliers, defence platforms and critical minerals sourcing.
    2. Eroding trust in Washington: This year’s Lowy Institute Poll recorded Australian trust in the United States at a record low of 31%, with a narrow majority of Australians favouring distance from Washington under President Trump.
    3. Conflict-driven lesson on dependency: The Iran and Ukraine conflicts demonstrated that long-standing single-point dependencies, however historically stable, have become strategic liabilities.
    4. India’s parallel diversification: New Delhi is diversifying energy suppliers, defence platforms and critical minerals processing for the same underlying reason as Australia.
    5. Limits of unilateral hedging: No single country can balance China or hedge against American unpredictability alone, which makes partners such as India, Australia and Japan mutually reinforcing.

    What Institutional Steps Toward Alignment Did This Visit Deliver?

    1. Defence and security MoU: A Joint Declaration on Defence and Security Cooperation created a memorandum of understanding between Australia’s Maritime Border Command and the Indian Coast Guard.
    2. Maritime Security Collaboration Roadmap: Both countries adopted a roadmap to address shared threat perceptions across maritime domains.
    3. Uranium deal operationalised: The SHANTI Act, enacted last December, reformed the nuclear liability regime that had deterred foreign suppliers since the 2014 bilateral civil nuclear agreement. 
    4. Technology partnership launched: The summit launched the Australia-India Partnership on Cyber, Critical Technologies and Supply Chains (PACTS), positioned to build resilient technology partnerships through flexible minilateral arrangements. 
    5. Complementary minilateral framing: PACTS was framed as complementary to the Australia-Canada-India Technology and Innovation Partnership, both structured as flexible minilateral arrangements rather than formal alliances.

    Why Does Convergence Still Fall Short of Durable Alignment? 

    1. Indian Ocean overlap is real: India’s Information Fusion Centre-Indian Ocean Region and Australia’s closer attention to its western seaboard show converging maritime domain awareness.
      1. Information Fusion Centre-Indian Ocean Region: India’s hub for monitoring regional shipping movements and maritime threats.
    2. Shared threat assessments: Both navies have converged on assessments of shadow fleets, threats to undersea cables, and coercive activity below the threshold of conflict.
    3. Australia’s force posture points elsewhere: Australia’s most consequential defence decisions, including AUKUS, remain oriented toward the Western Pacific rather than the Indian Ocean.
    4. India’s strategic attention remains divided: India’s planners continue to split focus between continental threats and maritime challenges, limiting dedicated Indian Ocean bandwidth.
    5. Operational overlap is narrower than political rhetoric: The shared strategic ground between the two countries is real but narrower than the convergence visible at the political level.

    Why Has Economic Convergence Not Translated into Broad-Based Alignment?

    1. Trade growth is concentrated: Trade has grown sharply since the Economic Cooperation and Trade Agreement came into force, but gains sit disproportionately with large firms.
    2. SME awareness gap: Smaller exporters on both sides remain unaware of how to use the trade agreement’s provisions.
    3. Operationalisation gap flagged by experts: Track 1.5 dialogues have identified this awareness gap as a structural obstacle to broad-based trade alignment.
      1. Track 1.5 dialogue: a hybrid diplomatic format combining government officials and non-official experts.

    Why Does Australian Public Perception Lag Behind Elite Convergence?

    1. Wide perception gap with China: This year’s Lowy Poll found only 5% of Australians expect India to be the world’s most important power a decade from now, against 54% for China.
    2. High trust, low strategic recognition: Trust in India remains comparatively high among Australians, but this has not translated into recognition of India’s strategic weight.
    3. Elite-public disconnect: Convergence at the political and institutional level has not yet trickled down into wider Australian public awareness of India’s strategic heft.

    Can the Diaspora Bridge the Convergence-Alignment Gap?

    1. Diaspora scale: Indian-origin Australians are now the country’s largest immigrant-born community, surpassing the U.K.-born population for the first time.
    2. Existing recognition is narrow: A Centre for Australia-India Relations study finds Australians broadly recognise the diaspora as skilled migrants, students and workers, but only in that limited sense.
    3. Cultural asset is not alignment: Recognising the diaspora as a cultural or electoral asset differs from using it to build a public economic case for India.
    4. Institutionalisation is missing: Alignment requires institutionalising the diaspora’s role in helping Australian SMEs navigate Indian regulatory and business culture, and vice versa, rather than relying on individual champions.
    5. Migration politics complicate mobility: The mobility of Indian professionals remains entangled with Australia’s increasingly contested migration politics.
    6. Visit as fresh ballast: PM Modi’s remarks on Australian pension funds investing in India, framed as a marker of strategic trust rather than pure capital, provided renewed momentum for these conversations.

    Conclusion

    The India-Australia relationship rests on strong convergence: both countries are independently hedging against overdependence on China and an unpredictable Washington. Alignment, however, remains narrower than the political rhetoric suggests. Defence cooperation stays bounded by Australia’s Western Pacific-oriented force posture, trade gains remain concentrated among large firms, and Australian public perception of India continues to lag behind elite consensus. The partnership will deepen only if institutional steps, the Coast Guard MoU, the uranium deal, and diaspora-linked economic outreach, are sustained incrementally, since convergence alone does not guarantee durable alignment.

  • Why is the centre revising the NFSA 

    Why in the News?

    The Union Food and Public Distribution Department has published a draft amendment to the National Food Security Act (NFSA), 2013 converting the Antyodaya Anna Yojana (AAY) entitlement from a household-based to a per-capita formula. Tamil Nadu and Kerala have objected, arguing the change will cut monthly foodgrain allocations for smaller households even though it is framed as an equity correction. The dispute revives a food-politics fault line between the Centre and these two States that traces back to the NFSA’s 2013 enactment.

    What has the Centre proposed, and what does it claim to fix?

    1. Current rule: Every Antyodaya Anna Yojana (AAY) household receives 35 kg of foodgrains per month, regardless of household size.
    2. Proposed rule: Each person in an AAY household is entitled to 7 kg per month, subject to a ceiling of 35 kg per household.
    3. Legal provision amended: The first provision to Section 3(1) of the NFSA, which governs the right to subsidised foodgrains for eligible households.
    4. Stated rationale: The F&PD Department says the household-based system causes intra-category inequity. Smaller households get a higher per-capita share. Larger households get a lower per-capita share that can fall below what priority households receive.
    5. Stated objective: The amendment aims to make allocation more rational and align entitlements with nutritional norms.
    6. Consultation window: Public comments were invited till July 13, 2026.
    7. Gap in the amendment: The draft does not address inclusion of ineligible persons as beneficiaries. This problem remains a State-level issue.

    Why have Tamil Nadu and Kerala historically treated food policy as high-stakes politics?

    1. Kerala’s PDS legacy: Kerala traces informal food distribution mechanisms to the erstwhile princely State of Travancore and launched a formal Public Distribution System (PDS) in 1962, three years before the Food Corporation of India (FCI) was established.
    2. Tamil Nadu’s political precedent: Incumbent governments lost power in 1952 and 1967 over failure to manage rice shortages, making rice policy a lasting political sensitivity.
    3. Kerala’s resistance to the 2013 NFSA: The Congress-led UDF government, despite the Congress-led UPA pushing the law at the Centre, resisted implementation. It argued the law would drop a large number of poor families and impose a heavy financial burden on the State.
    4. Delayed Kerala rollout: Chief Minister Oommen Chandy committed to enforcing the NFSA, but the formal decision was taken only under his successor, Pinarayi Vijayan.
    5. Tamil Nadu’s universal rice policy: Chief Minister Jayalalithaa opposed the NFSA after her government began distributing free rice to all ration cardholders in 2011, regardless of economic status.
    6. Concession extracted in 2013: Tamil Nadu secured a Central guarantee that its then-existing allocation levels would be legally protected under the NFSA.
    7. Delayed adoption: Both southern States joined the rest of the country in implementing the NFSA only in November 2016.

    Why does a per-capita formula built on a household ceiling disadvantage southern States?

    1. Mechanical effect of the formula: A household with fewer than five members receives less than 35 kg under the per-capita rule, since 7 kg multiplied by fewer than five persons falls short of the existing ceiling.
    2. Kerala’s structural exposure: Kerala’s Food Minister has argued that States characterised by nuclear families will lose out, since Kerala took the position in 2013 that AAY cardholders deserved “special consideration,” a stance it maintains.
    3. Tamil Nadu’s quantified loss: The State’s monthly allocation is projected to fall from 65,261 tonnes to 42,040 tonnes under the new formula.
    4. Scale of exposure in Tamil Nadu: Of 18.64 lakh AAY households, 15.75 lakh have fewer than five members, covering 58.51 lakh of the State’s 69.27 lakh AAY beneficiaries.
    5. Non-substitutability argument: Rice is a staple across all three daily meals for AAY cardholders and cannot be replaced with market purchases without significant out-of-pocket cost.
    6. North-South divide argument: Right to Food Campaign functionary Anuradha Talwar has argued that northern States, with larger average family sizes, will receive higher allocations under the new formula while southern States lose out.
    7. South’s collective stake: The five southern States and Puducherry together hold 52.51 lakh of India’s 250 lakh AAY household ceiling, about one-fifth of the national total, making the region’s exposure to the formula change substantial in absolute terms.

    What is the way forward, and does it resolve the underlying tension?

    1. Process concern: A change of this scale should have been subjected to wider public scrutiny before a consensus was sought, according to food policy commentary cited in the report.
    2. Middle-path proposal: Tamil Nadu Progressive Consumer Centre president T. Sadagopan has suggested a flat allocation of 30 kg per household, irrespective of family size, as a compromise.
    3. Fiscal rationale for the middle path: A flat 30 kg allocation would still let the Union government reduce its overall subsidy bill compared to the current 35 kg ceiling.
    4. Implementation context: Current off-take and distribution data for the financial year up to May 2026 show uneven utilisation across southern States relative to their allocations, indicating that formula design alone will not resolve execution gaps in the PDS chain.
    5. Unresolved gap: Neither the Centre’s draft nor the proposed middle path addresses the separate, State-level problem of ineligible persons remaining on beneficiary lists.

    Conclusion

    The NFSA amendment corrects a genuine per-capita inequity within the AAY category, but the household ceiling built into the new formula shifts the burden onto smaller-household southern States, reviving a federal food-politics conflict rooted in each State’s distinct PDS history. The amendment leaves the parallel problem of ineligible beneficiaries at the State level untouched, meaning one inequity is corrected while another persists. A flat per-household allocation remains a proposed middle path, but the Centre has not formally responded to it.

    PYQ Relevance

    [UPSC 2013] What are the salient features of the National Food Security Act, 2013? How has the Food Security Bill helped in eliminating hunger and malnutrition in India?

    Linkage: The PYQ examines the provisions and effectiveness of the NFSA as a rights-based framework for ensuring food and nutritional security. The proposed shift from a fixed 35 kg entitlement per AAY household to 7 kg per person, capped at 35 kg, enables a critical assessment of whether rationalising foodgrain allocation may weaken existing NFSA entitlements and affect vulnerable households unevenly.

  • Lessons for India from Brazil’s ethanol pathway

    Why in the News?

    India achieved its E20 ethanol-blending target in 2025, five years ahead of the original 2030 deadline, compressing the E5-to-E20 journey into just six years. Brazil took five decades to move from E10 to E30 blending, sequencing its mandate behind vehicle readiness and consumer price incentives at every stage.

    How does the pace of India’s ethanol-blending mandate compare with Brazil’s phased trajectory?

    1. Brazil’s blending law dates to 1931: Brazil mandated a 5% anhydrous ethanol blend in petrol in 1931. This law preceded the National Alcohol Program by over four decades.
    2. 1973 oil crisis triggered Proálcool: The 1973 global oil crisis prompted Brazil to launch the National Alcohol Program in 1975. The program aimed to cut petroleum dependence through ethanol promotion.
    3. Brazil took 50 years for E10 to E30: Brazil moved from E10 to E30 blending over five decades. The 2025 blend increase to 30% followed dedicated government studies.
    4. India compressed E5 to E20 into six years: India’s blending share rose from E5 to E20 in six years. The 10% blending milestone was reached only in 2022.
    5. India’s 20% target was front-loaded: The original 20% ethanol target was set for 2030. The government advanced this to a nationwide standard years ahead of schedule.
    6. E20 target met five years early: India reached its E20 target in 2025. Blending stood at 19.2% at that point, up from 12.1% in 2023.

    What specific Brazilian policy and institutional milestones enabled its ethanol transition?

    1. 1931 blending law set the baseline: Brazil’s first ethanol law fixed a 5% anhydrous ethanol blend in petrol. This gave the fuel market an early, low-disruption entry point for ethanol.
    2. Proálcool (1975) built institutional demand: The National Alcohol Program created sustained government-backed demand for ethanol after the 1973 oil crisis. This program anchored ethanol’s role in Brazil’s energy strategy for decades.
    3. Fiat’s 147 (1979) proved single-fuel ethanol vehicles: Italian automaker Fiat launched the 147, the world’s first vehicle powered entirely by ethanol. Volkswagen, GM and Ford followed with their own ethanol models.
    4. Flex-fuel production scaled from 2003: Volkswagen introduced Brazil’s first flex-fuel vehicle on March 23, 2003. Toyota’s flex-fuel Corolla sales rose from 48,178 units in 2003 to 1.63 million units, nearly 90% of the Brazilian car fleet, within two decades.
    5. National Biofuels Policy (2017) consolidated the regulatory framework: Brazil passed this policy to formalise its biofuel targets. It followed over four decades of incremental legislative steps.
    6. ‘Fuel of the Future’ and Mover Program (2024) targeted low-carbon vehicle technology: These laws pushed low-carbon vehicle technology and further biofuel adoption. They set the stage for the 2025 E30 mandate.

    Why has India’s flex-fuel vehicle ecosystem lagged behind its blending mandate?

    1. India has only a handful of flex-fuel models: The WagonR flex-fuel model, Toyota Hycross hybrid flex-fuel prototype, Tata Punch and Hyundai Creta flex-fuel versions form India’s flex-fuel car range. Hero and TVS have introduced flex-fuel two-wheelers.
    2. Most Indian vehicles remain unequipped for high ethanol blends: Indian roads are not geared up for handling higher ethanol blends in the fuel mix. Most cars and two-wheelers use fixed-ratio fuel systems rather than flex-fuel sensors.
    3. Flex-fuel vehicles depend on a fuel composition sensor: This sensor adjusts fuel injection and ignition timing based on the ethanol-petrol blend in the tank. It allows seamless switching between petrol, ethanol, or blends of the two.
    4. India’s E85 dispensing stations are ahead of its vehicle base: E85 fuel dispensing stations are being established nationwide. Only a few flex-fuel vehicle prototypes exist to use them.
    5. Flex-fuel certification remains an incomplete category in India: Flex-fuel vehicles require an entirely separate vehicle category and a distinct set of readiness certifications. India has completed only a fraction of this process compared with Brazil’s near-complete fleet conversion.

    Why did consumer price incentives drive Brazil’s ethanol adoption while their absence undermines India’s blending push?

    1. Brazilian pumps offer motorists a fuel choice: Nearly every Brazilian petrol pump offers a choice between blended petrol, typically E27, and E100, pure hydrous ethanol. Consumers choose whichever fuel is cheaper on a given day.
    2. Price gap made ethanol the rational choice in Brazil: E100 is typically 25-35% cheaper than lower-blended petrol in Brazil. This price gap, not the blending mandate alone, drove flex-fuel vehicle adoption.
    3. Government price support cemented flex-fuel demand: Brazilian government price support made blended fuel cheaper than petrol. Nine out of every 10 new cars sold in Brazil by the late 1980s could run on ethanol alone.
    4. Ethanol carries technical performance advantages: Ethanol improves acceleration and reduces engine knocking. This is cited as a further consumer benefit in Brazil.
    5. India offered a blending mandate without a matching price incentive or choice: Indian motorists were not offered a fuel choice at the pump. They were told performance would not be affected, without addressing fuel efficiency.
    6. Mileage was excluded from India’s performance assurance: The government’s performance assurance to motorists did not include mileage. Vehicle owners have since reported a sharp dip in fuel efficiency.

    What questions does India’s rushed ethanol rollout leave unanswered?

    1. Efficiency losses are set to increase with higher blending: Vehicle owners have noticed a fuel-efficiency dip since blending began. This efficiency loss is expected to worsen as blending increases further.
    2. Vehicle damage concerns are contested but not absent: Concerns over vehicle damage appear overstated on the whole. Plastic and rubber components in older vehicles still show degradation.
    3. India’s E20-to-E25 transition is positioned as a strategic necessity: The push to raise blending from E20 to E25, ahead of a full shift to flex-fuel vehicles and E85-E100 fuels, is described as integral to reducing fossil fuel import dependence.
    4. Import dependence frames the urgency: India imports nearly 88.5% of its crude oil requirement. This dependence exposes the country’s energy security to geopolitical disruptions.
    5. The mobility strategy remains a declared combination without a sequencing plan: An official has stated that India’s future mobility ecosystem will combine EVs, biofuels, hydrogen and renewables suited to Indian conditions. No phased sequencing comparable to Brazil’s decades-long approach has been specified.
    6. The rollout proceeded without adequate disclaimers or preparation: The blending push moved forward without adequately preparing consumers or vehicle systems. This gap, more than the blending percentage itself, is the substance of the unresolved question for India.

    Conclusion

    Brazil’s ethanol success rested on sequencing blending mandates behind vehicle readiness and consumer price incentives, sustained across five decades. India has reversed this sequence, reaching its blending target years ahead of schedule without a matching flex-fuel vehicle base or price-based consumer choice. The unresolved question is not the blending percentage itself but whether India’s vehicle certifications, fuel infrastructure and consumer disclosures can catch up to a mandate already in force.

  • Australia Repatriates Three Antiquities to India

    Why in News?

    Australia announced the repatriation of three Chola-era antiquities stolen from temples in Tamil Nadu during Prime Minister Narendra Modi’s visit.

    Key Highlights

    • Australia will return:
      • Bronze Trident (Trishul) of Goddess Bhadrakali
      • Granite Nandi idol
      • Basalt sculpture of six-headed Karthikeya (Shanmukha)
    • The artefacts date to the 11th-12th century (Chola period).
    • They were housed in the National Gallery of Australia.

    Legal Basis

    • Repatriation is being carried out under the India-Australia Mutual Legal Assistance Treaty (MLAT).
    • Investigation by the Tamil Nadu Idol Wing CID established that the artefacts were illegally removed from temples and trafficked overseas.

    Original Temples

    • Bhadrakali Trident: Sri Kasi Viswanatha Swamy Temple, Kollumangudi, Tiruvarur.
    • Karthikeya Idol: Naganathaswamy Temple, Manambadi, Thanjavur.
    • Nandi Idol: Identified as originating from a temple in Tamil Nadu.

    [2025] Who among the following led a successful military campaign against the kingdom of Srivijaya, the powerful maritime State, which ruled the Malay Peninsula, Sumatra, Java and the neighbouring islands?

    [A] Amoghavarsha (Rashtrakuta)

    [B] Prataparudra (Kakatiya)

    [C] Rajendra 1 (Chola)

    [D] Vishnuvardhana (Hoysala)

  • India-Australia Civil Nuclear & Strategic Partnership

    Why in News?

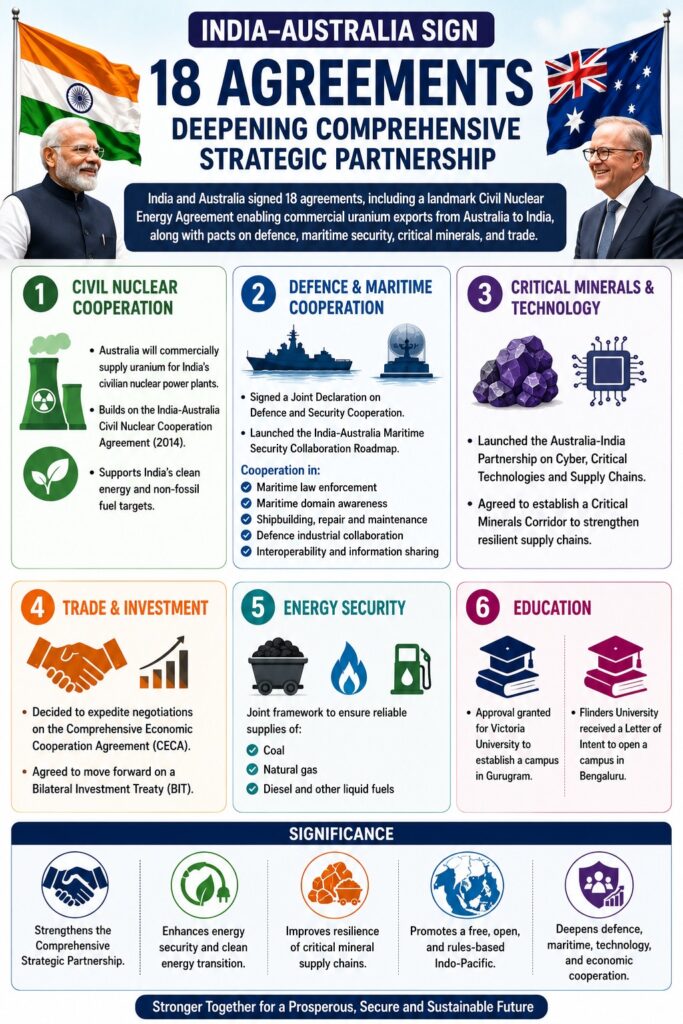
    India and Australia signed 18 agreements, including a landmark Civil Nuclear Energy Agreement enabling commercial uranium exports from Australia to India, along with pacts on defence, maritime security, critical minerals, and trade.

    Civil Nuclear Cooperation

    • Australia will commercially supply uranium for India’s civilian nuclear power plants.
    • Builds on the India-Australia Civil Nuclear Cooperation Agreement (2014).
    • Supports India’s clean energy and non-fossil fuel targets.

    Defence & Maritime Cooperation

    • Signed a Joint Declaration on Defence and Security Cooperation.
    • Launched the India-Australia Maritime Security Collaboration Roadmap.
    • Cooperation in Maritime law enforcement, Maritime domain awareness, Shipbuilding, repair and maintenance, Defence industrial collaboration, Interoperability and information sharing

    Critical Minerals & Technology

    • Launched the Australia-India Partnership on Cyber, Critical Technologies and Supply Chains.
    • Agreed to establish a Critical Minerals Corridor to strengthen resilient supply chains.

    Trade & Investment

    • Decided to expedite negotiations on the Comprehensive Economic Cooperation Agreement (CECA).
    • Agreed to move forward on a Bilateral Investment Treaty (BIT).

    Energy Security

    • Joint framework to ensure reliable supplies of Coal, Natural gas, Diesel and other liquid fuels

    Education

    • Approval granted for Victoria University to establish a campus in Gurugram.
    • Flinders University received a Letter of Intent to open a campus in Bengaluru.

    [2020] In India, why are some nuclear reactors kept under “IAEA safeguards” while others are not ?

    a) Some use uranium and others use thorium
    b) Some use imported uranium and others use domestic supplies
    c) Some are operated by foreign enterprises and others are operated by domestic enterprises
    d) Some are State-owned and others are privately-owned

  • Footwear Quality Control Orders (QCOs)

    Why in News?

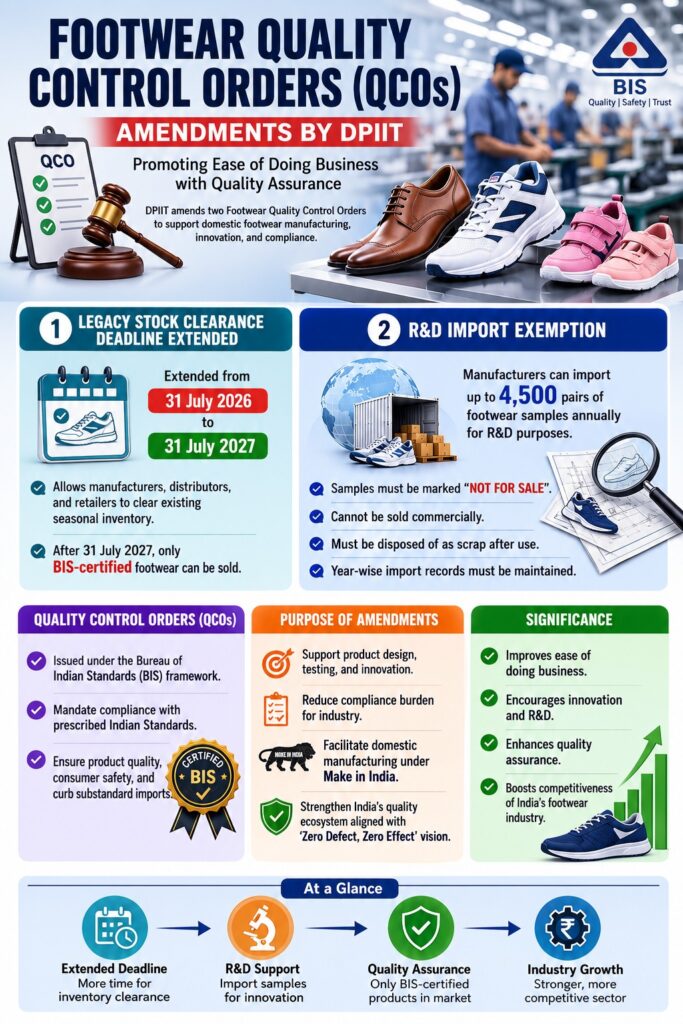
    The Department for Promotion of Industry and Internal Trade (DPIIT) amended two Footwear Quality Control Orders (QCOs) to promote ease of doing business while strengthening domestic footwear manufacturing.

    Key Amendments

    • Legacy stock clearance deadline extended from 31 July 2026 to 31 July 2027.
    • Allows manufacturers, distributors, and retailers to clear existing seasonal inventory.
    • After the deadline, only BIS-certified footwear can be sold.

    R&D Import Exemption

    • Manufacturers can import up to 4,500 pairs of footwear samples annually for Research & Development (R&D).
    • Samples:
      • Must be marked “NOT FOR SALE”.
      • Cannot be sold commercially.
      • Must be disposed of as scrap after use.
      • Year-wise import records must be maintained.

    Purpose

    • Support product design, testing, and innovation.
    • Reduce compliance burden.
    • Facilitate domestic manufacturing under Make in India.
    • Strengthen India’s quality ecosystem in line with the “Zero Defect, Zero Effect” vision.

    Quality Control Orders (QCOs)

    • Issued under the Bureau of Indian Standards (BIS) framework.
    • Mandate compliance with prescribed Indian Standards.
    • Aim to ensure product quality, consumer safety, and curb substandard imports.

    About DPIIT

    • The Department for Promotion of Industry and Internal Trade (DPIIT) is a central government department under the Indian Ministry of Commerce and Industry.
    • Established in 1995, it acts as the nodal agency for formulating overall industrial policies, driving the Startup India initiative, and managing inward Foreign Direct Investment (FDI) frameworks.

    Significance

    • Improves ease of doing business.
    • Encourages innovation and R&D.
    • Enhances quality assurance.
    • Boosts competitiveness of India’s footwear industry.

    [2017] Consider the following statements:

    1. The Standard Mark of Bureau of Indian Standards (BIS) is mandatory for automotive tyres and tubes.
    2. AGMARK is a quality Certification Mark issued by the Food and Agriculture Organisation (FAO).

    Which of the statements given above is/are correct?

    [A] 1 only

    [B] 2 only

    [C] Both 1 and 2

    [D] Neither 1 nor 2

  • Sub-Mission on Agricultural Mechanization (SMAM)

    Why in News?

    The government highlighted the achievements of SMAM, including wider access to farm machinery, Custom Hiring Centres (CHCs), and drone-based precision farming.

    Key Facts

    • Launched in 2014-15 as a Centrally Sponsored Scheme under RKVY.
    • Promotes mechanization among small & marginal farmers, women, SC/STs, FPOs, SHGs, and rural entrepreneurs.
    • Supports:
      • Subsidies for farm machinery
      • Custom Hiring Centres (CHCs)
      • Farm Machinery Banks (FMBs)
      • Hi-Tech Hubs
      • Training, testing, and demonstrations
      • Drone-based agriculture

    Financial Assistance

    • 40% subsidy for general farmers.
    • 50% subsidy for SC/STs, small & marginal farmers, and North Eastern States.
    • Funding pattern: 60:40 (Centre:State) for most states, 90:10 for NE & Himalayan states, and 100% Central funding for UTs

    Achievements (2014-15 to 2025-26)

    • ₹9,404.47 crore central assistance.
    • 21.61 lakh farm machines distributed.
    • 27,554 CHCs established.
    • 25,608 Farm Machinery Banks created.
    • 646 Hi-Tech Hubs established.

    Drone Promotion

    • ₹52.5 crore allocated.
    • 40,928 drone demonstrations over 40,918 hectares (2023-24 to 2025-26).
    • ICAR institutes, KVKs, and SAUs receive 100% support (up to ₹10 lakh per drone).
    • FPOs receive 75% grant.

    Special Features

    • 30% of total funds earmarked for women farmers.
    • Special incentives for North Eastern States, including up to 100% subsidy for small machinery.

    Significance

    • Enhances farm productivity and efficiency.
    • Reduces labour dependence and cost of cultivation.
    • Promotes precision farming and post-harvest mechanization.
    • Improves access to modern machinery for small farmers.

    [2023] Which one of the following best describes the concept of ‘Small Farmer Large Field’?

    [A] Resettlement of a large number of people, uprooted from their countries due to war, by giving them a large cultivable land which they cultivate collectively and share the produce

    [B] Many marginal farmers in an area organize themselves into groups and synchronize and harmonize selected agricultural operations

    [C] Many marginal farmers in an area together make a contract with a corporate body and surrender their land to the corporate body for a fixed term for which the corporate body makes a payment of agreed amount to the farmers

    [D] A company extends loans, technical knowledge and material inputs to a number of small farmers in an area so that they produce the agricultural commodity required by the company for its manufacturing process and commercial production

  • [9th July 2026] The Hindu OpED: How India withstood the crisis in West Asia

    PYQ Relevance[UPSC 2017] The question of India’s Energy Security constitutes the most important part of India’s economic progress. Analyse India’s energy policy cooperation with West Asian countries
    Linkage: The PYQ directly examines the linkage between India’s energy security, economic growth and energy cooperation with West Asian countries. The article shows how sustained diplomatic engagement with West Asian partners, diversification of energy suppliers and strategic preparedness enabled India to maintain energy supplies and limit the economic impact of the West Asia crisis.

    Mentor’s Comment

    India’s fuel and LPG prices rose only marginally during the recent West Asia crisis even though the country imports nearly 90% of its crude oil through routes exposed to the Strait of Hormuz. This price resilience concealed a ₹74,781 crore loss absorbed by state-run Oil Marketing Companies, exposing the fiscal cost hidden behind India’s energy security architecture.

    Why did India appear structurally vulnerable to the West Asia energy shock?

    1. Import dependence: India imports almost 90% of its crude oil and is heavily dependent on the Gulf for oil, gas, and fertilizers.
    2. Third-largest oil importer: India ranks as the world’s third-largest oil importer, making it directly exposed to any disruption at the Strait of Hormuz.
    3. Historical precedent of instability: Sharp oil price increases have historically been a major source of macroeconomic instability for India, as seen in the 1973 oil shock and the 1991 balance-of-payments crisis.
    4. Sharp initial price signals: The Indian crude basket crossed $120 per barrel within weeks of the crisis. The import-linked cost of a domestic LPG cylinder rose above ₹1,600. War-risk premiums on shipping escalated sharply.
    5. Compounding risk factors: Rising freight costs and maritime risk combined with crude dependence to create the conditions for a severe external shock.

    How resilient was India’s fuel pricing compared to global peers?

    1. Petrol price comparison: Petrol prices in India rose by only 7.5% during the crisis. Germany saw a rise of nearly 14%, the U.K. 19%, the U.S. 45%, Pakistan and the Philippines over 50%, and Myanmar almost 90%.
    2. Diesel price comparison: India limited diesel price increases to just 8%. The UAE, a crude-producing country, saw diesel prices surge by about 85%.
    3. LPG affordability: A domestic LPG cylinder in India cost ₹942, and ₹642 for Ujjwala beneficiaries, despite India importing nearly 60% of its LPG requirement.
    4. Regional LPG comparison: India’s LPG price remained cheaper than in Pakistan, Nepal, and Sri Lanka, and dramatically lower than in the U.S., Australia, and Canada.

    Did India’s price stability represent genuine resilience or a deferred fiscal cost?

    1. Scale of losses: State-run Oil Marketing Companies incurred ₹74,781 crore in losses on petrol, diesel, and LPG sales up to June 30 as global crude prices surged.
    2. Absorption over pass-through: The government and public-sector OMCs chose to absorb the price shock rather than pass it fully to consumers.
    3. Trade-off exposed: Consumer price stability was protected at the direct cost of OMC balance sheets, converting a market shock into a fiscal one.
    4. Limits of the model: This absorption capacity depends on OMC financial health and government fiscal space. A prolonged or repeated shock would test the sustainability of this approach.

    What structural preparations enabled India to absorb the shock?

    1. Diplomatic relationships as energy security: Decades of engagement with Iran and Gulf partners kept communication channels open during peak tensions. Iran facilitated the movement of Indian ships and Gulf producers continued energy supplies.
    2. Supplier diversification: Energy partnerships with Russia, the U.S., Africa, and Latin America gave India flexibility to withstand disruption that was unavailable in earlier crises.
    3. A decade of energy planning: Higher ethanol blending, an expanding renewable energy base, larger strategic reserves, and stronger refining capacity built layered resilience over time.
    4. Whole-of-government coordination: The Ministries of External Affairs, Petroleum and Natural Gas, and Ports, Shipping and Waterways, along with the Indian Navy and the National Security Council Secretariat, coordinated to monitor risk, manage logistics, and protect supply.

    What does this episode signal for India’s future energy security strategy?

    1. Preparation precedes crisis: Resilience was the product of choices made years before the crisis, not of measures adopted during it.
    2. Foreign policy as an energy security tool: Diplomatic outreach functioned as a substitute for physical reserves during the acute phase of the crisis.
    3. Unresolved fiscal question: The crisis did not resolve the tension between consumer price protection and OMC financial sustainability. It only deferred that cost.
    4. Framing for national strategy: The episode is positioned as a template for future energy resilience under the government’s ‘Viksit Bharat’ framing.

    Conclusion

    India’s resilience during the West Asia crisis was not accidental. It was the outcome of a decade of supplier diversification, sustained diplomatic engagement with Iran and Gulf producers, strategic reserve-building, and whole-of-government coordination. This resilience, however, was purchased through a ₹74,781 crore fiscal absorption by public-sector Oil Marketing Companies rather than a costless outcome. The crisis therefore validates India’s energy security architecture while leaving open the question of how long consumer price insulation can be sustained through OMC losses if shocks recur or persist.