💥Mains Ready By December. Smash Mains & Smash PYQ Admissions Open

Subject: National Income Accounting(GDP)

  • Reasons why GDP growth overshot expectations, and what lies ahead

    Why in the News

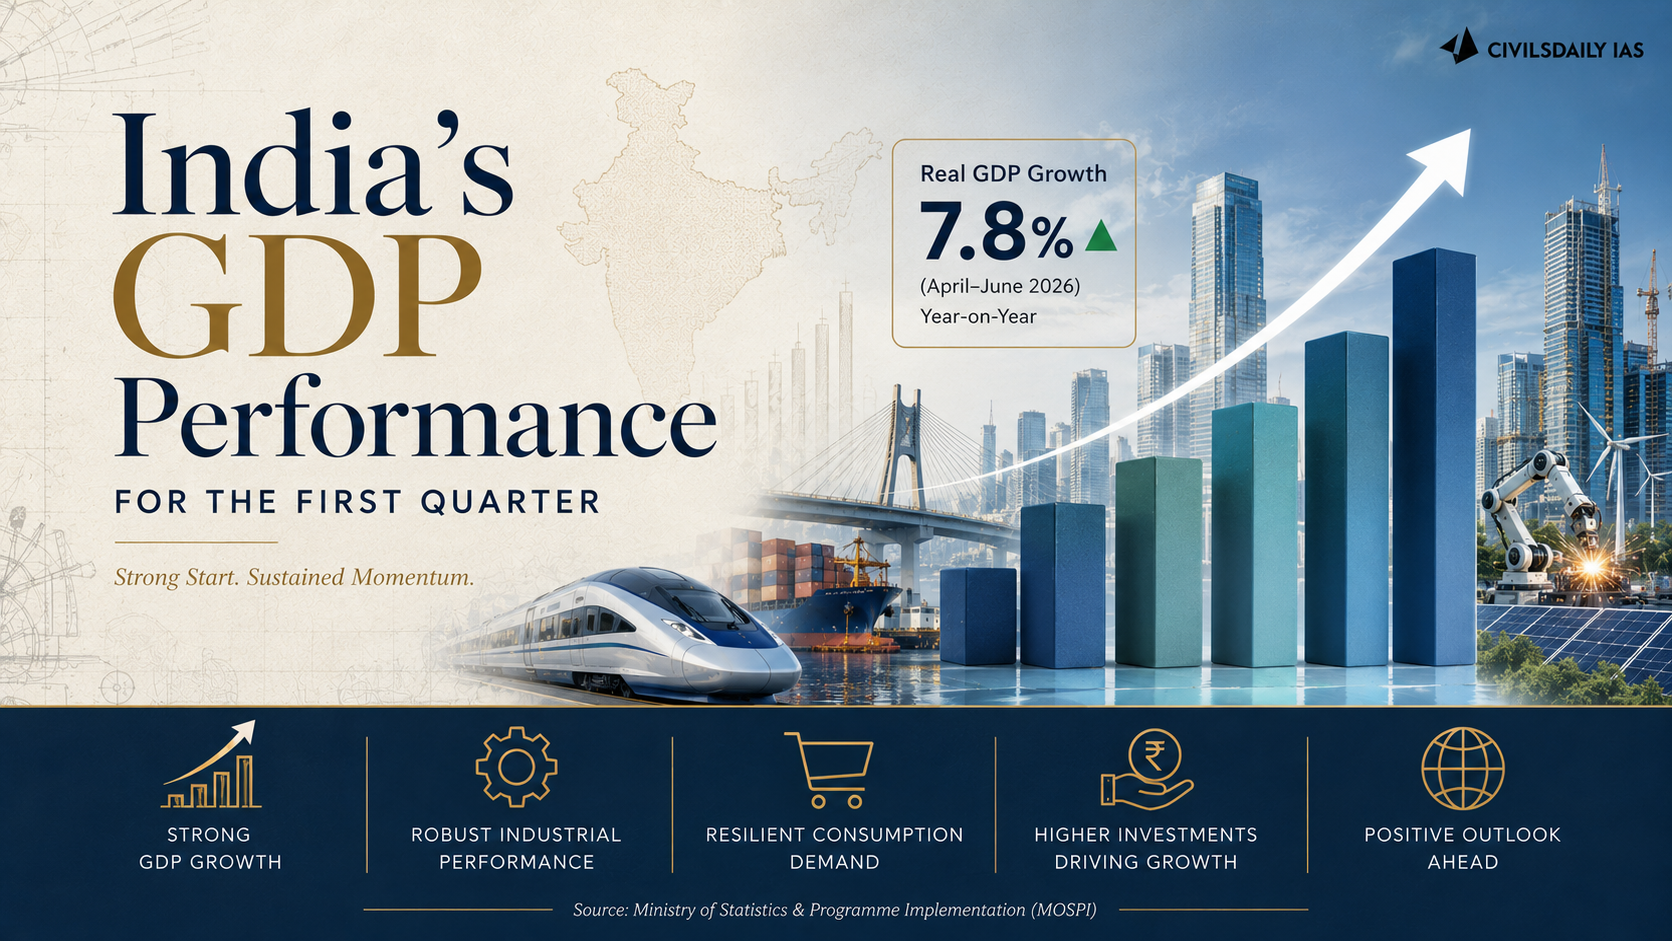
    India’s real Gross Domestic Product (GDP) grew 7.8 per cent in April to June, above the 7 per cent estimated by the Reserve Bank of India (RBI).

    Which sectors produced the 7.8 per cent print?

    1. Manufacturing accelerated to 9.2 per cent: The sector grew from 8.3 per cent a year earlier.
    2. Services grew at 10 per cent: The sector expanded from 8 per cent in the same quarter last year.
    3. Agriculture slowed to 3.6 per cent: Growth fell from 4.4 per cent a year earlier.
    4. The farm number still beat its own forecast: The Chief Economic Adviser assessed that agriculture fared better than expected in June, when the monsoon shortfall was high.

    What is holding up demand?

    1. Household spending grew 7.1 per cent: Private Final Consumption Expenditure rose from a growth rate of 6.8 per cent last year.
    2. Urban and rural proxies both performed: Indicators tracking demand in both segments held up over the last three months.
    3. Three rural income measures supported the number: Income transfers under PM Kisan, higher minimum support prices and steps to keep fertiliser affordable aided rural demand.

    Why does the investment number matter more than the headline?

    1. Gross Fixed Capital Formation jumped 11.9 per cent in real terms: This measure of additions to the economy’s fixed assets grew at double last year’s 5.8 per cent.
    2. The nominal increase was 20.4 per cent: Without adjusting for inflation, investment rose by that much.
    3. Investment’s share of GDP reached 34.3 per cent: The share climbed from 31.4 per cent a year earlier.
    4. That share is the threshold for sustaining high growth: The Chairman of the Economic Advisory Council to the Prime Minister has held that investment must rise to 34 to 35 per cent of GDP to sustain growth above 7 per cent.

    What could reverse the outcome?

    1. Crude oil prices carry a supply risk: Disruption to crude supply from the war between the United States and Iran will likely prevent prices falling materially and sustainably below 80 dollars a barrel.
    2. Export demand is the second order effect: Indian households have been partially shielded from higher energy prices, and other countries facing a demand hit would dim the prospects for India’s exports.
    3. El Nino is expected to peak in late 2026: Its implications for rainfall, crop outcomes and food inflation warrant close monitoring, per the Ministry of Finance’s monthly economic review.
    4. All three sectors contributed this quarter: The message from the data is resilience, since agriculture, manufacturing and services each added to growth despite the West Asia war.

    Challenges to sustaining the growth rate

    1. Crude import dependence transmits every price shock: India imports the large majority of the crude oil it consumes, so a price rise lands on the trade balance and on fuel inflation at the same time. Eg. The price surge after the Ukraine war in 2022 pushed Indian retail inflation above the 6 per cent upper tolerance band for three consecutive quarters.
      The Fix: Expand strategic petroleum reserve capacity and spread long term supply contracts across more than one producing region.
    2. The investment cycle is still publicly led: Central government capital spending has carried the recovery, and private corporate capital expenditure has followed later and unevenly. Eg. Central capital expenditure was raised sharply in successive post-pandemic budgets while private project announcements lagged.
      The Fix: Clear land acquisition, contract enforcement and approval delays that raise the fixed cost of starting a private project.
    3. Farm output remains rain dependent: Under half of India’s net sown area is irrigated, so a rainfall shortfall passes directly into crop output and food prices. Eg. The 2015 El Nino year cut kharif sowing and pushed pulse prices to record levels.
      The Fix: Expand micro irrigation coverage and hold larger buffer stocks in the pulses and oilseeds where price spikes originate.
    4. Services exports face demand and technology risk together: Growth in services exports depends on client spending abroad and on how much of the work automation absorbs. Eg. Global capability centres employ a large share of India’s services export workforce, and their scope of work is the part most exposed to automation.
      The Fix: Shift the export base towards higher value engineering and design work rather than volume based delivery.

    Conclusion

    Growth beat the projection because investment and services carried the quarter and agriculture did not. That composition has to repeat for the rest of the year, and two of its supports sit outside the domestic economy. The marker to watch is the next monetary policy review, where the central bank must either revise its full year projection upward or hold it against the energy and monsoon risks the government’s own economists have flagged.

    Back2Basics: Economic Advisory Council to the Prime Minister

    1. Status: An independent advisory body that is neither constitutional nor statutory, reconstituted in its current form in 2017.
    2. Mandate: Advises the Prime Minister on economic and related issues, particularly from a neutral and non-departmental viewpoint.
    3. Composition: Headed by a Chairman, with full time and part time members drawn from academia and policy practice.
    4. Support: It is serviced administratively by NITI Aayog.

    [2020, GS3, 10 marks] Define potential GDP and explain its determinants. What are the factors that have been inhibiting India from realizing its potential GDP?”

  • Worries behind India’s robust GDP, inflation data

    Why in the News

    Six months into the West Asia war, India’s headline macroeconomic numbers have held up against the deterioration forecast for them. Gross Domestic Product (GDP) growth for the first quarter is put at 7 to 7.5 percent, retail inflation sits near the Reserve Bank of India (RBI) target of 4 percent, and the current account deficit is 0.3 percent of GDP. The forecasts had assumed the opposite, since the war was expected to raise crude oil prices and cut foreign investment, and El Nino conditions (a periodic warming of the eastern Pacific that shifts monsoon rainfall over India) threatened food production. The tension is that each of the three headline numbers rests on a support that can reverse within a quarter, so the resilience is a matter of composition rather than of structure.

    Why were the macro numbers expected to deteriorate?

    1. The war was expected to work through crude and capital: Higher crude oil prices and a reduction in foreign investment were the two channels analysts identified after the United States and Israel went to war with Iran.
    2. Inflation was projected to triple: The rate was expected to rise from 2 percent in 2025-26 to near 6 percent, moving from the lower end of the RBI’s comfort zone to its upper limit.
    3. The rupee carried the visible damage: The war exposed persistent weaknesses in the economy, expressed most sharply in the fall of the rupee’s exchange rate.
    4. Household consumption was asked to adjust: The Prime Minister appealed to citizens to stop gold purchases and reduce fuel consumption, among other measures.

    What is actually holding up the growth number?

    1. Monetary easing has begun to transmit: The repo rate, the rate at which the RBI lends to commercial banks, was cut by 125 basis points between December 2024 and December 2025, and transmission into faster growth typically takes a couple of quarters.
    2. Indirect tax cuts raised purchasing power: Cuts in the Goods and Services Tax in 2025 lowered prices and lifted economic activity.
    3. Exports to the United States recovered: India’s exports rose as the tariffs imposed by the United States were removed.
    4. Manufacturers produced ahead of demand: Firms front loaded production because they were anxious about future energy availability.
    5. The estimates cluster above 7 percent: A research database of 100 growth indicators points to 7 to 7.5 percent for April, May and June, and one domestic bank’s research team projects 8 percent.

    Why is headline inflation low, and what does the average conceal?

    1. The headline rate is contained but rising: Monthly retail inflation has moved up since October and remains near the RBI’s 4 percent target level.
    2. The restraint is not the usual kind: Inflation ordinarily stays muted because growth is muted, and here it has stayed muted despite supply pressures and with demand holding up.
    3. Goods inflation is already at 5.4 percent: Food inflation and non food goods inflation together averaged 5.4 percent year on year in July.
    4. Services inflation is doing the masking: Services inflation is at 2.5 percent, and a rise from that level, reflecting growth better, would push the headline number up quickly.

    How is the current account deficit being held at 0.3 percent of GDP?

    1. The current account measures net flows on trade: It is the net amount of money moving in or out of India as it trades goods and services with the world, and a country importing more than it exports runs a deficit on it.
    2. The goods side is deteriorating: The goods trade deficit is growing, which is the normal consequence of fast growth and costlier imports.
    3. Services and remittances are funding the gap: Rising services exports and remittances from Indians working abroad are offsetting the increase in the goods deficit.
    4. The funding source is itself uncertain: Services exports have grown at a softer pace this year, and the effect of artificial intelligence on services export growth is unsettled.

    What do the credit numbers signal beneath the growth rate?

    1. Credit growth is partly guaranteed rather than commercial: A new government credit guarantee scheme for small firms accounts for part of the rise in loans.
    2. Working capital demand reflects costlier inputs: Borrowing has risen because higher commodity prices have raised working capital needs.
    3. Gold loan growth is a stress marker: The proliferation of gold loans functions as an indicator of household financial distress rather than of expansion.
    4. Front loading borrows from the next quarter: Manufacturing brought forward can be followed by a lull, and agricultural growth can weaken if El Nino strengthens.

    Challenges to sustaining India’s growth and inflation mix

    1. Import dependence on crude oil transmits every external shock: India imports the large majority of the crude oil it consumes, so a price shock lands directly on the trade balance and on the fuel component of retail inflation. Eg. The 2022 crude price surge after the Ukraine war pushed retail inflation above the RBI’s 6 percent upper tolerance band for three consecutive quarters. Fix. Expand the strategic petroleum reserve and diversify long term crude contracts away from a single supplier region.
    2. Exchange rate depreciation feeds imported inflation: A weaker rupee raises the domestic price of imported fuel, edible oil, fertiliser and electronics regardless of domestic demand conditions. Eg. Edible oil prices in India track palm oil import costs from Indonesia and Malaysia, where India buys the bulk of its supply. Fix. Deepen the domestic oilseed and fertiliser production base so that the depreciation pass through covers a smaller import basket.
    3. Services led growth generates limited employment: The sector’s share of output far exceeds its share of jobs, so a growth rate driven by services does not translate into proportionate hiring. Eg. Information technology services contribute a large share of exports. They employ a small fraction of the non farm workforce. Fix. Tie production and export incentives to verified employment creation rather than to output or investment alone.
    4. Private capital expenditure has not led the cycle: Growth supported by rate cuts, tax cuts and front loaded production rests on policy stimulus rather than on a durable investment upturn. Eg. Central government capital expenditure has carried the investment cycle since the pandemic, with private corporate investment recovering later and unevenly. Fix. Resolve land, contract enforcement and clearance delays that raise the fixed cost of a new private project.

    Conclusion

    The headline numbers are steady because one sector is covering for the others. That is a composition rather than a structure, and a composition can change inside a quarter. The marker to watch is whether services inflation rises at the same time as services exports weaken, since that pairing would force the central bank to raise rates and take the growth number with it.

    Matching Previous Year Question

    “[2021, GS3, 10 marks] Explain the difference between computing methodology of India’s Gross Domestic Product(GDP) before the year 2015 and after the year 2015.”

  • Economy is resilient, but risks remain

    Economy is resilient, but risks remain

    Why in the News

    The State of the Economy report, compiled by economists at the Reserve Bank of India (RBI), together with the finance ministry’s monthly economic review, has found that India’s underlying growth momentum held up through the first quarter of the financial year. Both readings point to firm household consumption, industrial output and credit growth even as global conditions stay unsettled. The outlook nonetheless remains clouded by continuing geopolitical and trade related uncertainty, volatile energy prices and a strengthening El Niño (a periodic warming of central and eastern Pacific Ocean waters that disrupts monsoon rainfall patterns), risks that could weigh on growth just as the National Statistics Office (NSO) prepares to release its first quarter Gross Domestic Product (GDP) estimate.

    What signals point to resilient domestic growth?

    1. Steady consumption indicators: E way bill generation has stayed firm, Goods and Services Tax (GST) revenues have remained healthy, and passenger vehicle, tractor and two wheeler sales have all been strong.
    2. Firm industrial output: The Index of Industrial Production (IIP), a measure of output across mining, manufacturing and electricity, rose 5.8 percent in the quarter, aided by the manufacturing sector, while electricity demand held steady.
    3. Corporate profitability and credit growth: Firms in both manufacturing and services reported improved operating profits, and bank credit has grown at a brisk pace across both industrial and retail lending.
    4. Monsoon recovery and exports: A recovery in the monsoon has supported kharif sowing, and exports excluding oil grew 12.8 percent in the first four months of the year, aided by the currency’s depreciation.
    5. Public capital spending: The Centre’s own expenditure grew by roughly 24 percent in the quarter, keeping public capital spending on track.

    What risks could weigh on this resilience?

    1. External uncertainty: Continuing geopolitical and trade related tensions, along with supply chain pressures, threaten to unsettle the momentum built up domestically.
    2. Volatile energy prices: Fluctuating global energy prices raise input costs across manufacturing and transport and feed inflation risk.
    3. A strengthening El Niño: A stronger El Niño could unsettle the rainfall gains that supported this quarter’s kharif sowing and rural demand.
    4. A cautious institutional tone: The finance ministry’s economic review itself notes that “recent years have been a time for hunkering down and battening down the hatches,” and expects coming years to be no exception.

    What does the growth trajectory imply for the GDP estimate?

    1. RBI’s own projection: At its August Monetary Policy Committee (MPC) meeting, the central bank projected 7 percent growth for the first quarter, a figure broadly matched by assessments from agencies such as Crisil and ICRA.
    2. The GDP release ahead: The National Statistics Office is set to release its first quarter GDP estimate shortly, with growth seen as likely to surprise on the upside even as the external environment continues to weigh on the outlook.

    Conclusion

    Domestic demand, industrial output and credit growth show the economy’s underlying momentum has held up, but persistent external risks, from trade tensions to volatile energy prices and a strengthening El Niño, mean policymakers cannot afford complacency. The National Statistics Office’s forthcoming GDP estimate will offer the first concrete test of whether this resilience is translating into headline growth, even as the external environment continues to demand a calibrated policy response.

    Back2Basics: What is the State of the Economy report?

    1. Publisher: It is a monthly assessment published in the Reserve Bank of India’s Bulletin, written by economists in the RBI’s Monetary Policy Department.
    2. Status: It carries a standard disclaimer that the views expressed are those of the authors and not necessarily those of the RBI.
    3. Purpose: It reviews high frequency indicators of growth, inflation and the external sector to assess the economy’s current momentum.

    [2021] “Explain the difference between computing methodology of India’s Gross Domestic Product(GDP) before the year 2015 and after the year 2015.”

  • Measuring manufacturing growth afresh: Three questions

    Why in the News

    The new Gross Domestic Product (GDP) series of the Ministry of Statistics and Programme Implementation (MoSPI) shows the manufacturing Gross Value Added (GVA) deflator recording negative growth for nine consecutive quarters between 2023 and 2025. The same series places the level of real manufacturing GVA in 2025-26 at no less than 15 percentage points above the Index of Industrial Production (IIP) for manufacturing. When the new series was announced, the Chief Economic Advisor and the Secretary, MoSPI stated that the estimates rested on a new methodology. That methodology was said to have solved the measurement problems that had bedevilled the old series, including in manufacturing. MoSPI has not yet released the detailed standard document explaining the new calculations. Three specific anomalies in the manufacturing numbers therefore cannot be tested against the stated method, and the plausibility of the series has to be assessed from the numbers themselves.

    What is the manufacturing Gross Value Added deflator?

    1. Gross Value Added, defined: GVA for a sector is the value of its output minus the value of its intermediate inputs. It measures what producers in that sector actually added, before taxes on products are added and subsidies subtracted.
    2. What the deflator does: The sector deflator is the price index that converts nominal GVA at current prices into real GVA at base year prices. Real GVA equals nominal GVA divided by that deflator.
    3. What its movement signals: A deflator growing negatively means the sector’s own price level is falling. Real growth then runs ahead of nominal growth by the size of that fall.

    Why does confidence in manufacturing data matter now?

    1. The China Squeeze: The Chinese manufacturing export machine has again moved across world markets and threatens lower-skill manufacturing in poorer countries. The pressure this creates on Indian producers is what the data is being asked to measure.
    2. Two decades of stated ambition: The Union government set major ambitions for the sector, beginning with the flagship Make in India programme in 2014. The production-linked incentive (PLI) scheme followed several years later.
    3. The PLI’s dual purpose: The scheme was in part a response to the opportunities opened by the China-plus-one shift in global sourcing. It was also a response to the challenge of aggressive Chinese competition.
    4. Conflicting signals elsewhere: The wider economy is sending contradictory signals at present. Understanding manufacturing performance is the route to lifting some of that confusion.
    5. A recognised prior problem: Problems in manufacturing sector data under the previous series were widely recognised. MoSPI made strenuous efforts to address them in the new series.

    Why has the manufacturing deflator shown falling prices for nine straight quarters?

    1. The anomaly itself: The manufacturing GVA deflator records negative growth, meaning falling price levels, for nine consecutive quarters between 2023 and 2025. No comparable stretch of deflation appears anywhere else in the price data for that period.
    2. The core inflation test: The core Consumer Price Index (CPI), which excludes food and energy-related products, shows no sign of deflation across those quarters. Core CPI through December 2025 rests on the 2011-12 series and the March 2026 reading on the 2024 series.
    3. The wholesale price defence, and its limit: The wholesale price index (WPI) was negative for some of this period. It was not negative for nine consecutive quarters.
    4. Why WPI is the wrong benchmark anyway: The GVA deflator should not move in line with the WPI. The WPI is overly driven by input prices, and a value added deflator must reflect output prices net of inputs.

    Why is real GVA growth almost twice IIP growth?

    1. The size of the gap: In 2025-26 the level of real manufacturing GVA exceeded the IIP by no less than 15 percentage points. Both series are measured on the 2022-23 base.
    2. The growth gap it implies: Annual average real growth of manufacturing between 2022-23 and 2025-26 measured by GVA is about twice that measured by the IIP. The two figures are about 11 per cent against about 6 per cent.
    3. The informal sector explanation, and why it fails: Real GVA includes the informal sector and the IIP excludes it, so faster informal growth could in principle open a gap. For the most recent two years informal sector performance has been proxied by formal sector data, which makes the explanation mechanically impossible.
    4. The volumes versus value added explanation: The IIP measures output volumes rather than value added. A widely held perception holds that real GVA can grow faster than real output when input prices fall.
    5. Why that perception is wrong: Real GVA is calculated at constant prices, not at changing prices, so falling input prices cannot lift it. Real value added can grow faster than output volumes only where productivity improves, that is where firms become more efficient in using intermediate inputs.

    Why has the link between the two series broken down?

    1. The pre-2011 benchmark: Before the 2011-12 methodology changes, GVA and IIP moved closely together. The correlation between their growth rates over June 2005 to that break was 0.8.
    2. The post-2011 divergence: The two series diverged after the 2011-12 methodology changes. That divergence has been exacerbated in the new series rather than corrected by it.
    3. The recent segment: Since September 2022 the two series move very differently. The comparison excludes the Covid quarters from June 2020 to March 2022.
    4. The character of the difference: The real GVA series bounces around a great deal across quarters. The IIP series over the same stretch is fairly stable.

    What do the three questions together say about the new series?

    1. None is individually decisive: No one of the three issues is dispositive about the quality of the new series. Each is an unexplained pattern rather than a demonstrated error.
    2. The missing document is the binding constraint: The detailed standard document explaining the new calculations has not been released. Independent researchers therefore cannot check the anomalies against the method that produced them.
    3. The methodology claim raises the bar, it does not lower it: The new series was presented as the fix for exactly the manufacturing measurement problems of the old series. Anomalies concentrated in manufacturing are the hardest place for that claim to sit unexplained.
    4. What plausible explanations would buy: Explanations would engender confidence in the new GDP figures. They would also allow an assessment of the state of Indian manufacturing and of the impact of recent government actions to revive it.

    Challenges to the new GDP series’ manufacturing estimates

    1. Deflator choice drives the real number: Real GDP requires choosing a deflator, and the production side deflator is heavily influenced by the WPI. Eg. In FY23 a global commodity price surge pushed the WPI into double digits, and the high deflator suppressed measured real growth. Fix. Complete the WPI base revision so the deflator basket reflects the current price structure.
    2. No producer price index exists: India deflates goods sectors with a wholesale index built for trade flows rather than for producer output. Eg. Services sectors are deflated using CPI components because no dedicated producer price series covers them. Fix. Introduce a Producer Price Index on the model used across advanced statistical systems and retire WPI-based deflation.
    3. Transparency lags the release: The estimates reach the public well before the sources and methods behind them. Eg. The new series arrived with a stated methodology claim and without the standard explanatory document. Fix. Publish the sources and methods volume alongside the series so verification is concurrent with release.
    4. Informal output is still partly extrapolated: Informal sector performance for recent years is proxied from formal sector data, which cannot capture divergence between the two. Eg. The old series extrapolated large-company filings to the whole informal economy and stayed blind to the sharper hit small firms took after demonetisation. Fix. Shorten the lag on the Annual Survey of Unincorporated Sector Enterprises so proxying is not required for two full years.
    5. Statistical independence has been questioned: Resignations from the National Statistical Commission and withheld survey results have raised concerns about the autonomy of official statistics. Eg. Two members of the Commission resigned in 2019 over the handling of employment data. Fix. Constitute an independent statistical commission with a statutory mandate, as recommended by the Rangarajan Commission in 2001.

    Conclusion

    The new GDP series was presented as the answer to the manufacturing measurement problems of the old one, and its manufacturing numbers now carry three patterns that the stated methodology does not obviously produce. A deflator falling for nine quarters, a 15 percentage point level gap against the IIP and a correlation that has weakened since 2005-2012 are each testable claims that cannot be tested without the sources and methods document. Releasing that document is the precondition for confidence in the figures. Whether and how Indian manufacturing has stood up to Chinese competition is a question only reliable data can answer.

    “[2021, GS3, 10 marks] Explain the difference between computing methodology of India’s Gross Domestic Product(GDP) before the year 2015 and after the year 2015.”

  • Core industrial sector growth slows to 5.4% in July as fertilizer, steel, iron ore, oil output falls

    Why in the News

    Growth in India’s nine core industrial sectors slowed to 5.4% in July 2026 from 6% in June, according to official data released on 20 August 2026. The headline number is being held up by cement, electricity and a low-base rebound in iron ore and coal, at a time when the input industries feeding manufacturing and the domestic energy producers are contracting.

    What is the Index of Core Industries?

    1. About: The Index of Core Industries (ICI) measures the combined production performance of nine industries that supply inputs and energy to the rest of the economy, and is released monthly by the Ministry of Commerce and Industry.
    2. The nine sectors: Coal, crude oil, natural gas, refinery products, fertilizers, steel, iron ore, cement and electricity.
    3. New series: A new series of the index was released in July 2026 with 2022-23 as the base year, replacing the 2011-12 base year, and July’s reading is the second print of the revamped index.
    4. Break in comparability: Because of the base year change, a historical comparison on the new series is possible only up to June 2025.

    How did each of the nine sectors perform in July 2026?

    1. Cement: Growth hit 13.1% in July, a seven-month high, up from 11.1% growth in July of last year.
    2. Iron ore: Growth slowed to 29.5% in July from 44.5% in June, the biggest shift among the nine sectors.
    3. Electricity: The sector grew 9% in July, slower than the 11.4% recorded in June.
    4. Coal: Growth reached 7.6% in July 2026, an eleven-month high, against a contraction of 12.3% in July last year.
    5. Steel: Growth slowed to 2.9% in July, the lowest in the 14 months for which data exists on the new series, down from 5.6% in June.
    6. Refinery products: The sector grew 2.7% in July, snapping a three-month streak of contractions and delivering its best performance in nine months.
    7. Natural gas: The sector contracted 3.7% in July 2026, part of an unbroken run of contractions across all 14 months for which data exists.
    8. Crude oil: The sector contracted 5.3% in July 2026, also contracting continuously across the same 14 months.
    9. Fertilizers: The sector contracted 8% in July against a contraction of 3.3% in June, having grown 1.9% in July of last year.

    Why does the headline growth rate overstate the underlying recovery?

    1. The fastest growing sector is rebounding off a collapse: Iron ore’s 29.5% growth sits on a base in which the sector contracted 16.4% in June and 7.1% in July of last year.
    2. Coal’s eleven-month high has the same explanation: The 7.6% reading follows a 12.3% contraction in July last year, so the level of output has not necessarily exceeded its earlier peak.
    3. A truncated series hides the longer trend: With comparison possible only back to June 2025, a fourteen-month record is the longest statement the data supports about any sector.
    4. Composite growth masks divergence: July’s 5.4% was still the second-fastest reading in seven months, even as three of the nine sectors were in contraction.

    What explains the contraction in fertilizers and in domestic energy output?

    1. Monsoon transmission into fertilizer demand: The 8% fertilizer contraction is attributed to a deficient and patchy monsoon and the resultant lower levels of sowing, which cut the demand fertilizer plants produce for.
    2. A structural decline in domestic hydrocarbons: Natural gas and crude oil have contracted in every one of the 14 months for which data exists, which is a production trend rather than a monthly disturbance.
    3. Refining recovered while extraction did not: Refinery products returned to growth in July even as the crude oil that feeds refineries kept contracting, which widens the gap filled by imports.
    4. Steel weakness alongside cement strength: Steel growth fell to a fourteen-month low in the same month that cement growth hit a seven-month high, so construction activity is not translating into metal demand.

    “[2015] In the ‘Index of Eight Core Industries’, which one of the following is given the highest weight?

    (a) Coal Production

    (b) Electricity generation

    (c) Fertilizer production

    (d) Steel production

  • Temporary respite: On the June 2026 data for the Index of Industrial Production

    Why in the News

    India’s Index of Industrial Production (IIP) grew 7.3% in June 2026, its highest rate in 23 months, defying headwinds from the West Asia crisis and a deficient monsoon. The strength rests on a low statistical base and seasonal drivers rather than a broad based revival in demand, leaving government led capital expenditure as the only consistent engine still carrying growth.

    What is the Index of Industrial Production (IIP)?

    1. Publisher and purpose: The National Statistical Office (NSO), under the Ministry of Statistics and Programme Implementation (MoSPI), compiles and releases the IIP every month to track short term changes in the volume of industrial output.
    2. Sectoral composition: The index covers three sectors, mining, manufacturing and electricity, with manufacturing carrying the dominant weight.
    3. Use based classification: IIP output is also classified by end use into primary goods, capital goods, intermediate goods, infrastructure and construction goods, consumer durables and consumer non durable goods.
    4. Base year: The current series is based on 2011 12 prices, and the government has been working toward a revised base year series to better reflect the economy’s present industrial structure.

    What drove June’s industrial growth?

    1. Manufacturing push: Manufacturing accelerated on a dual boost from domestic and external demand, with consumer durables growth staying above 7% for a second straight month and non durable goods growth quickening to a six month high.
    2. Export demand: Commerce Ministry data showed merchandise exports growing 15.5% in June, pointing to external demand.
    3. Capital goods: The capital goods sector posted double digit growth, its eighth such month in the last ten.
    4. Electricity and mining: Electricity generation grew at its highest rate in 25 months due to a heat wave, and mining snapped a four month contraction streak.

    Why is June’s growth read as a temporary respite rather than a turnaround?

    1. Low base effect: Part of the headline growth reflects a low base, since industrial performance in June last year was the worst in nearly a year.
    2. Seasonal drivers: Electricity growth was tied to a heat wave and mining’s rebound is expected to reverse once the monsoon disrupts mining activity, meaning both gains are seasonal rather than structural.
    3. Single engine dependency: Capital creation led mainly by the government has been the only consistent growth engine in the post pandemic years, while exports and domestic consumption remain too uncertain to reliably carry growth on their own.

    What are the challenges to sustaining India’s industrial growth momentum?

    1. Deficient monsoon: Economists have warned that the monsoon shortfall will hit rural demand in the coming months, weakening consumer facing sectors again.
    2. Oil price volatility: Fading hopes of a ceasefire in West Asia are driving volatility in oil prices, sending uncertainty through import costs and the current account.
    3. Fiscal balancing act: Government capital expenditure must keep firing even as other fiscal pressures mount, straining the budget math that supports this single growth engine.
    4. Subdued private investment: Private sector capital formation has lagged behind government led investment, so a broad based private capex cycle has not yet taken hold despite improved capacity utilisation.
    5. Export vulnerability: Merchandise export gains remain exposed to tariff action by major trading partners, a risk that could reverse external demand support quickly.
    6. Consumption deferral: If uncertainty persists, planned investments would remain pending, purchases would be deferred, and savings would increasingly overshadow consumption, weakening demand further.

    Conclusion

    June’s industrial growth numbers do not indicate a durable turnaround. Government capital expenditure remains the only consistent engine, and it must keep firing while a deficient monsoon and volatile oil prices weigh on rural demand and input costs. If external conditions stay unfavourable, the government will need additional levers beyond capital expenditure to sustain the recovery.

    Back2Basics

    The Index of Industrial Production (IIP)

    1. It is a key macroeconomic indicator that measures short-term changes in the volume of industrial output across sectors like manufacturing, mining, and electricity.
    2. It is compiled and published monthly by the National Statistical Office (NSO) with a six-week time lag.

    Key Features and Updates

    1. Base Year: Updated to 2022-23 = 100, replacing the older 2011-12 series.
    2. Expanded Coverage: Now tracks 1,042 products across 463 item groups, incorporating broadened segments like gas supply, water supply, sewerage, and waste management.
    3. Core Industries: Eight core infrastructure industries (refinery products, electricity, steel, coal, crude oil, natural gas, cement, and fertilizers) make up over 40% of the total IIP weight.

    PYQ Relevance

    [UPSC 2012] In India the overall Index of Industrial Production, the Indices of Eight Core Industries have combined weight of 37.90%.

    Which of the following are among those Eight Core Industries? 1. Cement 2. Fertilizers 3. Natural Gas 4. Refinery products 5. Textiles

    Select the correct answer using the code given below: (a) 1 and 5 only (b) 2, 3 and 4 only (c) 1, 2, 3 and 4 only (d) 1, 2, 3, 4 and 5

    Answer: (c)

  • Do you agree with the view that steady GDP growth and low inflation have left the Indian economy in good shape? Give reasons in support of your arguments.

    India is projected to sustain GDP growth of 6.5% between FY28-30, positioning it as the world’s third-largest consumer market by 2026 and the third-largest economy by 2028. (UBS)

    Arguments Supporting the View (Indian economy in good shape)

    High GDP Growth – India remains the fastest-growing major economy. 7% in FY 2025.

    Moderating Inflation – Eg- Retail inflation fell to a historic low of 0.25% in October 2025, due to GST rate cuts

    Forex reserves at over $689 billion provide external stability.

    Fiscal Consolidation Path- Fiscal deficit targeted to reduce to 4.8% of GDP in 2025-26.

    Robust Financial Sector- Gross NPAs have declined from 9.11% (2021) to 2.8% (2025).

    Production-linked incentives (PLI) has raised India’s manufacturing attractiveness. Eg: Electronics exports at a record $38 billion in 2024-25. (32% increase)

    Arguments Against the View (Macro vulnerabilities persist)

    Jobless Growth –Service sector contributes 55% of GDP but employs less than 30% workforce

    High food inflation due to climate shocks, hurting the poor.

    Rural Distress due to weak agriculture real wages and uneven monsoons.

    Global slowdown, protectionism, and China’s dominance limit India’s merchandise exports.

    High Public Debt- General government debt remains around 82% of GDP (IMF, 2024), limiting fiscal room.

    The share of Gross Fixed Capital Formation (GFCF) was about 34.6% of GDP in 2023-24 and slipped to 29.61% of GDP in 2024, indicating weak investment.

    Way Forward

    Enhance R&D (2.5% of GDP), reduce logistics costs (PM Gati Shakti), and expand PLI schemes to boost manufacturing.

    Promote labour-intensive manufacturing (textiles, toys, food processing) and expand services exports (IT, GBS, health tourism).

    Improve ease of doing business, accelerate contract enforcement, and reduce regulatory uncertainty to crowd-in private capital.

    Strengthen FOREX buffers and expand rupee trade settlement

    Encourage domestic production of critical inputs (electronics, APIs, green tech) to reduce vulnerability to global shocks.

    As highlighted by the Economic Survey, India must prioritise blue-sky thinking and foster a virtuous cycle of investment to achieve Viksit Bharat@2047.

  • Define potential GDP and explain its determinants. What are the factors that have been inhibiting India from realizing its potential GDP?

    Potential GDP refers to the maximum sustainable output an economy can produce without generating inflationary pressure, when all resources are fully and efficiently employed.

    Determinants of Potential GDP

    Labour Force & Human Capital – Size, skill, and productivity of the workforce.

    Capital Formation – Investment in infrastructure, machinery, and technology.

    Technology & Innovation – R&D and digital transformation driving productivity.

    Institutional Quality – Governance, regulatory efficiency, and property rights.

    Total Factor Productivity (TFP) – Efficiency in using labour and capital together.

    Prevailing Inflation Rate – Persistent inflation distorts real GDP from its potential level.

    Global Conditions – Protectionism, trade restrictions, and geopolitical tensions. Eg- Tariff Wars

    Factors Inhibiting India from Realizing Potential GDP

    Low Female Labour Force Participation – FLFPR only 41.7% (PLFS) against global average of 48%

    Slow Capital Formation – GFCF at ~29.6% of GDP (2024) vs 34% in 2023.

    Skill Mismatch & Education Gaps – Only 4.7% of workforce formally skilled (NSDC).

    Infrastructure Bottlenecks – Logistics cost ~13% of GDP vs 8% in USA

    Weak Productivity Growth – Low TFP and informal sector dominance. (83% informal sector)

    Regulatory Cholesterol – Delays, compliance burden, weak contract enforcement.

    Way Forward

    Enhance Human Capital – Invest in education, healthcare, and skill development

    Accelerate Investment & Infrastructure Growth through faster project execution under PPP.

    Create safe workplaces, flexible jobs, and childcare support to tap women’s economic potential.

    Increase R&D spending to 2.5% of GDP (currently <1% of GDP) for productivity gains.

    To realize its potential GDP and Viksit Bharat 2047, India must shift from factor accumulation to productivity-driven growth

  • Explain the difference between computing methodology of India’s Gross Domestic Product(GDP) before the year 2015 and after the year 2015.

    Gross Domestic Product (GDP) is the total monetary value of all final goods and services produced within a country’s borders in a given period. GDP in India is calculated by the National Statistical Office (NSO).

    The post-2015 GDP methodology aims to provide a more accurate, data-rich, and globally comparable picture of India’s economy. To improve reliability, there is a need for greater transparency.

  • Consider the following statements

    Consider the following statements:

    1.Purchasing Power Parity (PPP) exchange rates are calculated by comparing the prices of the same basket of goods and services in different countries.
    2.In terms of PPP dollars, India is the sixth largest economy in the world.
    Which of the statements given above is/are correct?

    (a) 1 only
    (b) 2 only
    (c) Both 1 and 2
    (d) Neither 1 nor 2