The Tamil Nadu government has officially declared heatwaves a State-specific disaster.
It announced an ex-gratia payment of ₹4 lakh for families of individuals who die from heat-related causes, including those involved in relief operations.
Key Details of the Declaration
Purpose: This declaration allows the government to provide immediate relief to those affected by extreme heat, especially during the severe temperatures of April and May 2024.
OtherState-specific disasters in TN: Sea erosion, lightning, thunder, whirlwinds, and gale winds as State-specific disasters to ensure relief assistance for those impacted by these events.
Note:
Kerala in March this year, declared man-animal conflict as a state-specific disaster, becoming the first state in the country to do so.
Once an issue is declared a state-specific disaster, the onus to deal with it shifts to the state disaster management authority, which, powered by the Disaster Management Act, can take quicker and more decisive action.
Also, district collectors can directly intervene in their capacity as the chairman of the district disaster body.
About Heatwaves:
Details
Definition
A heatwave is a prolonged period of excessively hot weather, relative to the usual climate of a region.
Occurrence
Typically occurs in India between March and June.
Declaration by IMD
Plains: The maximum temperature is at least 45°C
Hills: The maximum temperature is at least 30°C
Coastal regions: The maximum temperature is at least 37°C and the departure from normal is at least 4.5°C
Formation
• High-Pressure Systems: Develop when high pressure settles over a region for days or weeks.
• Air Sinking: Forces air to sink, warming and drying it.
• Increased Radiation: Fewer clouds lead to higher surface temperatures.
• Surface Winds: Warm air from lower latitudes or continental winds intensify heat.
Criteria for Declaring a Heatwave
At least two stations in a meteorological subdivision must meet one of the following criteria for two consecutive days (declared on the second day): Based on Departure from Normal:
– Heat Wave: Temperature departure of 4.5°C to 6.4°C above normal.
– Severe Heat Wave: Temperature departure of >6.4°C above normal. Based on Actual Maximum Temperature (plains only):
– Heat Wave: Maximum temperature reaches 45°C or higher.
– Severe Heat Wave: Maximum temperature reaches 47°C or higher.
Duration
Typically lasts a minimum of four days but can extend to seven or ten days. Longest Recorded Spell: May 2015, lasting from 18 to 31 May.
Impact of Heatwaves
• Heat Strokes: Increased risk, especially for the elderly and those with chronic illnesses.
• Increased Healthcare Costs: Higher hospital visits and death rates from related illnesses.
• Reduced Productivity: Extreme heat affects the output of over 1 billion workers.
• Risk of Wildfires: Heat domes can lead to wildfires.
• Effect on Vegetation: Prolonged heat damages crops and leads to droughts.
• Increased Energy Demands: Higher electricity usage for cooling, driving up rates.
PYQ:
[2013] Bring out the causes for the formation of heat islands in the urban habitat of the world.
[2013] The annual range of temperature in the interior of the continents is high as compared to coastal areas. What is / are the reason / reasons?
1. Thermal difference between land and water
2. Variation in altitude between continents and oceans
3. Presence of strong winds in the interior
4. Heavy rains in the interior as compared to coasts
Select the correct answer using the codes given below.
The Centre has doubled the limit of Mudra loan amount under the PMMY to Rs 20 lakh from Rs 10 lakh under a new ‘Tarun Plus’ category to promote entrepreneurship in the country.
This higher loan limit is available to entrepreneurs who have previously taken and successfully repaid loans under the existing ‘Tarun’ category.
AboutPradhan Mantri Mudra Yojana (PMMY):
Details
Launch
Launched on April 8, 2015, by Prime Minister.
Objective
To provide financial assistance and support to non-corporate, non-farm small and micro-entrepreneurs through collateral-free loans.
Non-corporate, non-farm small and micro-entrepreneurs are individuals or entities that operate small-scale businesses outside the corporate and agricultural sectors.
These include self-employed workers, small retail shops, artisans, repair services, and other informal sector businesses, often with limited capital and workforce.
Recent Update
Loan limit increased from Rs 10 lakh to Rs 20 lakh under the new Tarun Plus category, announced in July 2024.
Loan Categories
• Shishu: Loans up to Rs 50,000
• Kishore: Loans between Rs 50,000 and Rs 5 lakh
• Tarun: Loans between Rs 5 lakh and Rs 10 lakh
• Tarun Plus: Loans between Rs 10 lakh and Rs 20 lakh
Loan Performance (2023-24)
• 66.8 million Loans sanctioned totaling Rs 5.4 trillion.
• Over 487.8 million loans worth Rs 29.79 trillion sanctioned since launch.
NPA Statistics
• NPA of public sector banks under Mudra loans decreased to 3.4% in FY24, down from 4.77% in 2020-21.
• Gross NPA for scheduled commercial banks at 2.8% as of March 2024.
Target Beneficiaries
Aims to empower women, minorities, and marginalized communities by facilitating easy access to credit.
Technological Intervention
MUDRA Card: An innovative credit product that offers an overdraft facility and can be used like a debit card for transactions.
MUDRA MITRA App: A mobile application providing information about MUDRA and its schemes, guiding loan seekers to approach banks for availing loans.
PYQ:
[2016] Pradhan Mantri MUDRA Yojana is aimed at:
(a) Bringing the small entrepreneurs into formal financial system.
(b) Providing loans to poor farmers for cultivating particular crops.
(c) Providing pension to old and destitute persons.
(d) Funding the voluntary organizations involved in the promotion of skill development and employment generation.
Q) Explain the rationale behind the Goods and Services Tax (Compensation to States) Act of 2017. How has COVID-19 impacted the GST compensation fund and created new federal tensions? (UPSC CSE 2020) Q) How have the recommendations of the 14th Finance Commission of India enabled the States to improve their fiscal position? (UPSC CSE 2021) Q) “Investment in infrastructure is essential for more rapid and inclusive economic growth.” Discuss in the light of India’s experience. (UPSC CSE 2021)
Mentor’s Comment:
“We cannot build a modern India without addressing the issue of poverty and inequality.”
– Dr. Manmohan Singh
In a nation where the top 10% hold 77% of the wealth, true progress can only be measured by the upliftment of the bottom half. Addressing regional disparities is essential for a harmonious India; without it, growth becomes a privilege of the few rather than a right for all.
Today’s editorial discusses the widening economic disparities among Indian states and the implications of this divide.
_
Let’s learn!
Why in the News?
Household savings and private investments are increasingly concentrated in wealthier states, leadingto a widening gap between rich and poor regions. These increasing economic disparities among Indian states have huge implications for Indian federalism.
Current State of Economic Divide in India:
• Per Capita Income Disparities: Wealthier states, primarily in the south and west, have significantly higher per capita incomes compared to poorer states in the north and east. As of 2019-20, per capita State Domestic Product (SDP) in wealthier states was approximately 2.5 times higher than in poorer states, up from a 1.7 times difference in 1990-91. • Sectoral Growth Gaps: The disparity is particularly pronounced in the manufacturing and services sectors. Wealthier states exhibit a much higher per capita SDP in manufacturing (3.6 times) and services (2.9 times) compared to their poorer counterparts.
Primary factors contributing to the growing economic divide among Indian states
Sectoral Growth Disparities: Wealthier states have significantly higher outputs in manufacturing and services, leading to greater economic growth compared to poorer states.
As income rises, people spend less on food and more on manufactured goods and services. Secondly, India’s services sector has grown, but employment has been more modest.
Investment Patterns: A shift from public to private investment has favored wealthier states, resulting in concentrated resources and opportunities.
Infrastructure Gaps: Poorer states often lack adequate power supply and infrastructure, hindering their ability to attract industries and grow economically.
Educational Disparities: Access to quality education is uneven, with most higher education institutions in wealthier states, limiting skill development in poorer regions.
How does the economic divide affect federalism and governance in India?
Erosion of Federal Principles: Disparities challenge equitable resource distribution, leading to dissatisfaction among wealthier states that feel under-compensated.
Political Centralization: Increased control by the central government limits state autonomy, reducing their ability to address regional economic challenges.
Investment Disparities: Wealthier states attract more private investment, while poorer states struggle due to inadequate infrastructure, perpetuating inequality.
Governance Challenges: Poorer states face corruption and weak institutions, hindering effective policy implementation and further entrenching poverty.
Initiatives taken by the Government:
• Aspirational Districts Programme (ADP): Launched in 2018, this program aims to transform the performance of 112 districts lagging in key social indicators by promoting holistic development through targeted interventions in health, education, and infrastructure. This initiative focuses on blocks within districts that need special attention, aiming to improve governance and service delivery at the grassroots level. • Special Economic Zones (SEZs): The government has established SEZs to attract investment and promote industrial growth in underdeveloped regions, encouraging economic activities and job creation. • Pradhan Mantri Gram Sadak Yojana: It focuses on improving rural road connectivity, which is crucial for economic development in remote areas. • FC Recommendations: The 15th Finance Commission has recommended increasing the share of tax revenues allocated to states, particularly those with greater needs, to help address regional disparities.
What strategies can bridge the Economic Divide and promote Inclusive Growth?
Boost Entrepreneurship and Skill Development: Encourage entrepreneurship in poorer states through targeted support and training programs. Enhance skill development initiatives to equip the workforce with the necessary skills for emerging industries.
Upgrade Infrastructure: Invest in improving power supply and overall infrastructure in economically lagging regions, particularly in the Gangetic and eastern areas, to facilitate industrial growth and attract investment.
Expand Access to Education: Increase access to technical and vocational education in poorer states to improve employability and attract high-tech industries. Focus on creating educational opportunities that cater to local economic needs.
Form Interconnected National Value Chains: Develop value chains that link resources from wealthier states with the potential of poorer ones, fostering balanced economic growth across regions.
As the crises inUkraine and Gaza persist, experts and policymakers are increasingly concerned about further rises in the costs of components essential for producing petroleum-based chemical fertilizers.
Current Scenario of Fertilizer Imports:
India’s domestic fertilizer production capacity does not meet the full demand, requiring substantial imports to bridge the gap.
Urea: Approximately 20% of India’s urea requirement is met through imports.
Diammonium Phosphate (DAP): Around 50-60% of DAP demand is fulfilled by imports.
Muriate of Potassium (MOP or Potash): 100% of India’s MOP demand is met through imports, as there is no domestic production.
The Standing Committee on Chemicals and Fertilizers (August 2023) expressed concern about India’s dependence on imports for fertilizers, recommending an increase in domestic production capacity.
How did the conflict in Ukraine impact the Global Fertilizer Market?
Market Instability: Ongoing conflicts in Ukraine and Gaza are disrupting the stability of the global fertilizer market, particularly affecting the prices of oil and petroleum-based fertilizers.
Supply Chain Disruptions: These conflicts affect global supply chains, particularly for fertilizer-producing countries such as Russia, which has been a significant source of fertilizer imports for India.
Price Volatility: Higher oil prices due to geopolitical tensions in Ukraine and Gaza indirectly drive up costs of fertilizers, as these are often by-products of petroleum.
Its effects on India
Rising Import Costs: Increased global fertilizer prices lead to higher import costs for India, putting pressure on the fertilizer subsidy budget.
Potential Supply Constraints: India’s reliance on imports from conflict-affected regions like Russia and West Asia (including the Middle East) poses risks of reduced fertilizer availability.
Budget Strain: India’s fertilizer subsidy allocation for 2023-24 was ₹1.79 lakh crore, with substantial amounts dedicated to both indigenous and imported fertilizers.
Need for Self-Reliance: The conflicts underscore the importance for India to reduce dependency on imports by increasing domestic production capacity, promoting alternatives like nano urea, and exploring sustainable practices like natural farming.
Steps taken by the government:
New Investment Policy (NIP): NIP supports new urea manufacturing units by PSUs and private companies, boosting production capacity from 207.54 LMTPA in 2014-15 to 283.74 LMTPA.
Nutrient-Based Subsidy (NBS): The government included Potash from Molasses under NBS in 2021, encouraging local production and reducing import dependency.
Public-Private Joint Ventures: PSUs and private firms collaborate in urea production, establishing units like the Ramagundam Fertilizers in Telangana and Hindustan Urvarak & Rasayan plants in northern states.
Way forward:
Boost Domestic Production: Increase India’s fertilizer production capacity through investment in domestic infrastructure and support for nano urea and alternative sustainable fertilizers to reduce import dependency.
Adopt Policy Reforms: Implement policies promoting self-reliance in fertilizers, with targeted subsidies and incentives for private, public, and cooperative sectors to enhance production and ensure affordable supply amidst global market volatility.
The Odisha government has translocated a female tiger from Maharashtra’s Tadoba-Andhari Tiger Reserve to Similipal Tiger Reserve, the State’s largest, to enhance the genetic diversity of its tiger population.
Why discuss this?
The All Odisha Tiger Estimation (AOTE-2023-24) says a total of 30 tigers were found in Odisha. Similipal has 27 of them.
A total of 13 adult tigers (seven females and six males) were found to be pseudo-melanistic in Similipal, and no other wild habitat in the world has pseudo-melanistic tigers.
Research indicates that a single mutation in the Transmembrane Aminopeptidase Q (Taqpep) gene causes Similipal’s black tigers to develop distinctive striped patterns.
About Simlipal Tiger Reserve (STR):
Details
Location
Located in the Mayurbhanj District, Northernmost part of Odisha, surrounded by high plateaus and hills.
Highest Peak
Twin peaks of Khairiburu and Meghashini, at 1515 meters above mean sea level.
Designation
Declared a Tiger Reserve in 1956; included in the Project Tiger national conservation program in 1973.
UNESCO Recognition
Included as part of the World Network of Biosphere Reserves by UNESCO in 2009.
Terrain
Mostly undulating and hilly, interspersed with open grasslands and wooded areas.
Vegetation
A mix of different forest types, predominantly Northern tropical moist deciduous and semi-evergreen patches.
Tribal Communities
Inhabited by various tribes including Kolha, Santhala, Bhumija, Bhatudi, Gondas, Khadia, Mankadia, and Sahara.
Flora
Home to 1078 species of plants, including 94 species of orchids, with Sal being the dominant tree species.
Fauna
Diverse wildlife including Leopard, Gaur, Elephant, Langur, Barking and Spotted Deer, Sloth Bear, Mongoose, Flying Squirrel, Porcupine, Turtle, Monitor Lizard, Python, Sambar, Pangolin, etc.
PYQ:
[2020] Among the following Tiger Reserves, which one has the largest area under “Critical Tiger Habitat”?
India has been ranked 176th in the Global Nature Conservation Index (NCI) 2024 with a score of 45.5 out of 100, placing it among the five worst performers alongside Kiribati (180), Turkey (179), Iraq (178), and Micronesia (177).
Reasons for India’s Low Ranking:
High Rate of Land Conversion: 53% of India’s land is converted for urban, industrial, and agricultural purposes, contributing to deforestation and habitat fragmentation that severely impact biodiversity.
Soil Pollution: India’s sustainable nitrogen index is 0.77, indicating high levels of soil pollution primarily due to extensive pesticide use, threatening soil health and agricultural sustainability.
Minimal Marine Conservation: Only 0.2% of India’s national waterways are protected, with no protected areas in its Exclusive Economic Zone (EEZ), highlighting limited efforts in marine biodiversity conservation.
Illegal Wildlife Trade: India ranks as the fourth-largest illegal wildlife trader globally, with an estimated annual trade value of £15 billion, putting added pressure on vulnerable wildlife species.
About the Nature Conservation Index (NCI):
Details
Developed By
Goldman Sonnenfeldt School of Sustainability and Climate Change at Ben-Gurion University of the Negev.
Purpose
To assess each country’s progress in balancing conservation and development through data-driven analysis.
Aim
To help governments, researchers, and organizations identify concerns and enhance conservation policies for long-term biodiversity protection.
Launch Date
Launched on October 24, 2024.
Scope
Ranks 180 countries based on their conservation efforts.
Pillars of the Index
• Managing Protected Areas
• Addressing Threats Against Biodiversity
• Nature and Conservation Governance
• Future Trends in Natural Resource Management
Significance
Provides insights into conservation policies and practices, aiding in the global effort to protect biodiversity and promote sustainable development.
Key highlights of the reports:
Finland, Norway, Switzerland, Costa Rica, and New Zealand ranked highest, showing strong conservation practices and governance.
Nations with advanced climate adaptation policies (e.g., Sweden and Denmark) are better positioned to mitigate biodiversity risks from climate change.
Despite Protected Areas, 46.9% of terrestrial and 67.5% of marine species are in decline worldwide.
High-density nations such as Bangladesh and the Netherlands face intense biodiversity pressures, driving them to implement urban greening and sustainable practices.
PYQ:
[2018] “Momentum for Change: Climate Neutral Now” is an initiative launched by:
Q) Why is Public Private Partnership (PPP) required in infrastructural projects? Examine the role of PPP model in the redevelopment of Railway Stations in India. (UPSC CSE 2022)
Q) Examine the development of Airports in India through joint ventures under Public – Private Partnership (PPP) model. What are the challenges faced by the authorities in this regard. (UPSC CSE 2017)
Q) Adoption of PPP model for infrastructure development of the country has not been free of criticism. Critically discuss the pros and cons of the model. (UPSC CSE 2013)
Mentor’s Comment: The Indian government, through NITI Aayog, is developing an incentive scheme tailored for private bus operators, who currently account for about 90% of the bus fleet in India. This move is crucial for achieving the target of 40% e-bus penetration by 2030 and reaching carbon neutrality by 2070.
Despite existing support under the FAME-II scheme, which primarily benefits state transport undertakings (STUs), the high costs associated with e-buses deter private operators from making the switch. The forthcoming incentive scheme is seen as a potential game-changer that could facilitate the broader adoption of electric buses in public transportation.
Today’s editorial discusses the role of the private sector in India’s electric bus (e-bus) initiative. Today’s discussions will focus more on creating a supportive environment for e-bus deployment beyond state-run services.
_
Let’s learn!
Why in the News?
Despite the government’s push through schemes like FAME II and PM e-Bus Sewa, which have incentivized electric vehicles for public transport, private bus operators have seen little benefit.
Presently, the government is planning to introduce a new incentive scheme specifically aimed at encouraging private operators to invest in e-buses.
Challenges Faced by Private Operators:
• Lack of Financial Incentives: Current government schemes do not extend to private operators, making it difficult for them to invest in e-buses. • High Initial Costs: The substantial upfront investment required for electric buses is prohibitive for many small operators. • Charging Infrastructure: Limited access to charging stations and facilities further complicates the adoption of e-buses. Most charging infrastructure is designed for state-run units, leaving private operators without adequate support. • Operational Inefficiencies: Restrictions on parking and charging at government depots create logistical challenges for private bus operations.
How can the private sector be incentivized to participate in the e-bus market?
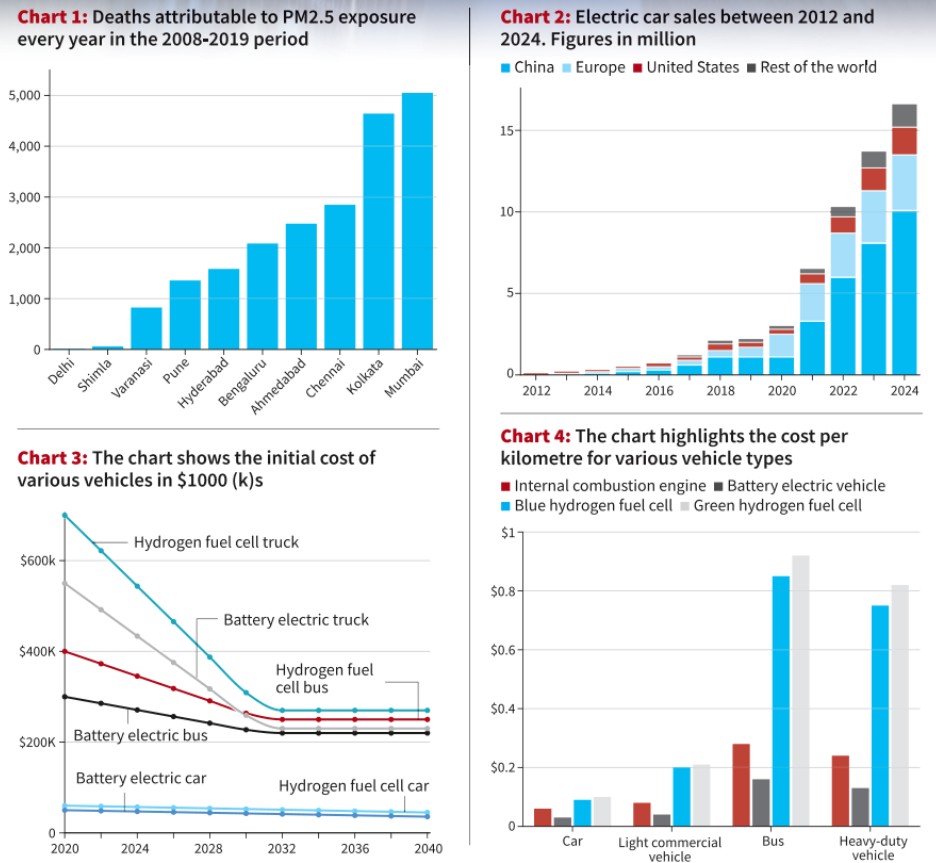
1) Financial Incentives: The incentivized schemes and subsidies could significantly lower the upfront costs associated with e-bus acquisition, which can be up to five times that of diesel buses.
Offering viability gap funding for charging infrastructure and land leases could attract private investment.
Implementing a payment security mechanism can protect private operators against payment delays from state transport undertakings (STUs).
2) Infrastructure Development: Establishing a robust network of charging stations is crucial. Under the Gross Cost Contract (GCC) Model, STUs pay a fixed cost per kilometer, ensuring steady income for operators while minimizing their risk exposure without bearing the full financial burden upfront.
This Flexible Leasing model enables operators to access capital without high initial investments, as maintenance and operational responsibilities can be shared.
What role does financing play in the adoption of electric buses?
High Initial Costs: The upfront costs of e-buses are significantly higher than those of traditional diesel buses, often up to five times more expensive, operators may find it challenging to justify the investment in e-buses despite their long-term operational savings.
Need for Dedicated Financing Facilities: Establishing a dedicated e-bus financing facility could provide concessional loans and grants, helping shield manufacturers and operators from the payment security risks posed by financially struggling state road transport undertakings (SRTUs).
Interest Rate Subventions: To encourage private operators to invest in e-buses, interest rate subventions of 4-6% on loans can be implemented. Lower interest rates can significantly ease the financial burden during the repayment period, making financing more accessible.
Leasing Models: Financing institutions can offer leasing options that include maintenance and battery replacement, thus sharing operational risks with bus operators. This approach not only lowers upfront costs but also allows operators to manage cash flow more effectively.
What infrastructure improvements are necessary for successful e-bus deployment?
Installation of Charging Stations: Establishing charging points within bus depots is crucial. A widespread infrastructure network will alleviate concerns about range and downtime, making e-buses a more viable option for operators.
Depot Charging Facilities: Private operators currently face restrictions in accessing government bus depots for parking and charging. Granting them access would streamline operations and improve efficiency by reducing the distance drivers must travel to pick up their buses.
Power Supply Management: The increased demand for electricity from charging e-buses can strain local power grids. Therefore, collaboration between bus operators and electricity distribution companies (DISCOMs) is vital for planning and managing this demand effectively.
Pilot Projects: Implementing pilot projects in tier-2 and tier-3 cities can help assess infrastructure requirements and operational challenges before scaling up to larger urban areas.
For example, electrifying a specific route, such as Delhi-Mumbai, could provide valuable insights into the necessary specifications for e-bus deployment.
Conclusion: The future of India’s e-bus initiative depends on a united effort between government bodies and private stakeholders to create an inclusive framework that fosters growth and innovation in the electric mobility sector.
India’s Anusandhan National Research Foundation and the BioE3 policy promote academia-industry collaboration, driving the bioeconomy for economic growth, sustainability, and climate action commitment.
What is BioE3 policy?
The BioE3 policy aims to transform chemical industries into sustainable bio-based models, promoting biotechnology to drive economic growth, protect the environment, and create jobs, supporting India’s sustainable development and climate goals.
Primary Environmental impacts associated with FMCG production and consumption:
Resource Depletion: The production of FMCGs often requires significant natural resources, such as water, energy, and raw materials. For example, palm oil, widely used in food and personal care products, leads to deforestation when forests are cleared for plantations.
Greenhouse Gas Emissions: The manufacturing and distribution of FMCGs contribute to greenhouse gas emissions at multiple stages, from sourcing raw materials to production processes and transportation.
Waste Generation: FMCGs, especially those with single-use packaging (e.g., plastics), generate a considerable amount of waste, which ends up in landfills or the ocean, causing environmental pollution.
Water Pollution: The production and use of FMCGs, such as soaps, detergents, and other chemicals, can lead to water pollution through the discharge of untreated wastewater containing harmful substances.
Loss of Biodiversity: The agricultural practices used to source raw materials like palm oil can lead to habitat destruction, thereby threatening biodiversity. Monoculture farming and deforestation disrupt ecosystems and endanger wildlife.
How can FMCG companies implement sustainable practices across their supply chains?
Companies should adopt responsible sourcing policies, such as using certified sustainable palm oil and other raw materials that adhere to ‘No Deforestation, No Peat’ policies.
Implementing energy-efficient processes, switching to renewable energy sources, and optimizing logistics to reduce emissions can minimize the carbon footprint across the supply chain.
Emphasizing recycling, reusing materials, and developing biodegradable or compostable packaging can help reduce waste and resource depletion.
The integration of bio-based or synthetic alternatives to traditional materials can also be beneficial.
Companies should implement measures to reduce water usage in manufacturing and treat wastewater to prevent water pollution.
Working with smallholder farmers to implement regenerative agricultural practices can help restore soil health, improve biodiversity, and support sustainable livelihoods.
What metrics should be used to measure the effectiveness of sustainability initiatives in FMCGs?
Carbon Footprint Reduction: Tracking greenhouse gas emissions across the supply chain and setting targets for reducing Scope 1, 2, and 3 emissions.
Sustainable Sourcing Percentage: Measuring the proportion of raw materials sourced sustainably, such as certified palm oil or recycled materials.
Waste Reduction and Recycling Rates: Monitoring the volume of waste generated, the amount sent to landfills, and the recycling rate of packaging materials.
Water Usage and Pollution Levels: Tracking water consumption in production and measuring the quality of wastewater discharged to ensure compliance with environmental standards.
Biodiversity Impact: Assessing the effect of sourcing practices on ecosystems and tracking initiatives to protect or restore biodiversity.
Product Sustainability Index: Developing a sustainability index for products that takes into account their entire life cycle, from raw material extraction to end-of-life disposal.
Way forward:
Strengthen Collaboration and Innovation: Foster partnerships between academia, industry, and government to drive research and development of sustainable alternatives to traditional materials, such as palm oil, and implement innovative practices throughout the FMCG supply chain.
Implement Comprehensive Sustainability Frameworks: Establish regulatory frameworks that incentivize sustainable practices, including mandatory reporting on sustainability metrics, eco-labelling for products, and support for circular economy initiatives to minimize waste and resource depletion.
The Prime Minister in his recent broadcast of “Mann Ki Baat” warned about the ‘Digital Arrest’ scams in India.
What is Digital Arrest?
Details
What are they?
A fraudulent scheme where scammers impersonate law enforcement officials to extort money from victims under the false pretence of an arrest.
Modus Operandi
• Scammers use audio or video calls to intimidate victims.
• Claim involvement in illegal activities (e.g., drugs, contraband).
• Victims are kept under constant visual surveillance until demands are met.
Common Tactics
• Use of deepfake videos and fake arrest warrants.
• Threats regarding family members being involved in crimes.
• Fake claims about parcels containing illegal goods.
Victim Impact
Victims may face significant financial losses, emotional distress, and a sense of vulnerability due to the intimidation tactics employed by scammers.
Recent Trends
• Increase in reported cases; over 11 lakh complaints of financial cyber fraud in 2023.
• Rising incidents attributed to the expansion of internet users.
Prevention Measures
• Awareness of scams and verification of callers’ identities.
• Immediate disconnection of suspicious calls.
• Reporting incidents to local police and cybercrime helplines.
Legal Framework
• Governed by the Information Technology Act, 2000.
• Reports can be filed through the National Cyber Crime Reporting Portal (www.cybercrime.gov.in).
PYQ:
[2017] In India, it is legally mandatory for which of the following to report on cyber security incidents?
1. Service providers
2. Data centres
3. Body corporate
Select the correct answer using the codes given below: