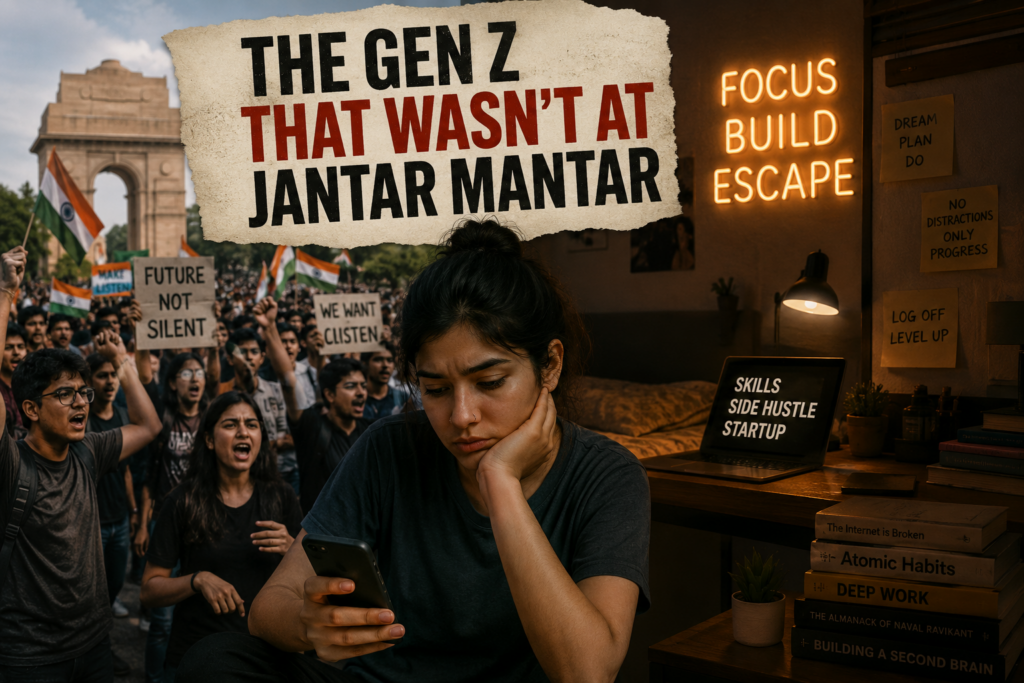
Why in the News
The Gen Z visible at the Jantar Mantar protest was young, articulate and quotable, and drew wide attention online. A far larger part of the same cohort was absent from those photographs, working as delivery riders, security guards, warehouse packers and unemployed graduates. The gap between the two groups sets up the question of whether a generation that has been given aspiration has also been given the means to act on it.
What is the demographic dividend?
- The concept: A demographic dividend is the growth advantage a country gains when the share of its working age population rises relative to its dependent population. The advantage arises from a temporary shift in age structure, not from population size.
- Why it is conditional: The advantage converts into output only where the additional working age population is employed at rising productivity. Absent that, a larger workforce raises the number of job seekers without raising income.
- How India has used the term: For two decades the demographic dividend has been described as an asset that pays out automatically. A young population is better understood as capital advanced against a future that has to be built to repay it, and unlike a dividend, it can default.
What is a reference group?
- The concept: A reference group is the set of people against whom an individual measures their own life, as set out by sociologist Robert Merton. Satisfaction depends on the comparison, not on the absolute level of income.
- What changed the group: A farmhand can now compare himself with a Dubai apartment or a weekend in Silicon Valley, delivered more reliably than a crop forecast.
What is the capacity to aspire?
- The concept: The capacity to aspire, as framed by anthropologist Arjun Appadurai, is not merely wanting a different future. It is knowing the routes that lead to it.
- The asymmetry it exposes: The capacity to imagine has been democratised at internet speed. The capacity to navigate has not.
What is the gig or platform economy?
- The arrangement: Work is allocated by a digital platform on a task by task basis, and the worker is classified as an independent partner rather than an employee. The platform can deactivate a worker without ever meeting him.
- What it prices: The platform prices risk more precisely than labour, so incentives rise when it rains rather than when skill accumulates.
Which Gen Z was absent from the protest?
- The delivery rider: A 22 year old delivering dinner to someone watching the protest on a phone, financing a motorcycle on debt he does not fully understand.
- The security guard: A worker stationed outside a building, protecting a lifestyle he can see but cannot enter.
- The village youth: A young man who can watch a Stanford lecture for free and has no idea what job he will do next year, whose imagination has migrated while his life chances have not.
- The three the category quietly merges: A liberal arts student in Delhi, a warehouse packer outside Gurugram and a UPSC aspirant in Bihar are treated as one cohort because they were born within the same 15 years.
- What they actually share: They share visibility without access, not a common set of opportunities.
Why has inequality become harder to bear without becoming larger?
- The level is not the change: India has never lacked inequality. What has changed is the technology of experiencing it.
- Comparison is no longer rationed: The farmer knew the landlord lived better. He did not begin breakfast watching the landlord’s holiday in the Maldives.
- The comparison set is now global: The smartphone has given a young population the entire planet to measure itself against.
- Consumption has become identity: The sneaker, the café and the start up vocabulary function as signifiers of having arrived rather than as possessions.
- The mismatch of speeds: Desire now travels at the speed of a 5G network. Social mobility still moves at the pace of a passenger train.
Why does the platform economy break the link between work and status?
- The old bargain was legible: Selling labour converted time into standing over a working life, through tenure, wage progression and recognised skill.
- The mechanism was removed, not replaced: The platform economy dropped that conversion and substituted the vocabulary of entrepreneurship for it.
- Hours convert into more hours: A worker classified as a partner finds that additional hours produce additional hours rather than advancement, described as autonomy.
- Deactivation replaces dismissal: Loss of livelihood arrives as an algorithmic status change, without a hearing, a notice period or an identified decision maker.
- The scaffolding is missing: Aspiration has been mass produced without the institutions that let a person act on it.
If a salary cannot deliver status, what does?
- A second economy opens: When the economic route to status narrows, an economy of dignity opens in its place.
- The substitutes on offer: Religion, nationalism, caste and an online tribe can supply the standing a salary does not.
- The switching cost is near zero: A young man cannot change his salary. He can change his avatar.
- The consequence for politics: A society that cannot offer its young enough ladders should not be surprised when identity begins to function as one.
- What the protest actually demonstrated: The protesters possessed something rarer than anger, which is a vocabulary for it. Most anger never reaches that stage.
Why should the demographic dividend be read as a loan rather than a payout?
- A dividend is unconditional, a loan is not: Treating youth as an asset that pays out automatically removes the obligation to build the employment and training system that repays it.
- The default condition is identifiable: Loans default when the future they were advanced against is not built, which in this case means a labour market that cannot absorb the graduates it produces.
- The window is finite: The favourable age structure lasts for a fixed period, after which the dependency ratio rises again and the opportunity closes.
- The test is not happiness: The operative question is whether a generation believes the future is negotiable, not whether it reports itself content.
- The distinction that matters: Every generation tolerates hardship that looks like a corridor. The trouble begins when it starts looking like a closed room.
- The unfinished journey: The protesters had travelled from disappointment to language and from anger to demand. Millions of their contemporaries are still between the first two.
Challenges to realising India’s demographic dividend
- Employability lags enrolment: Degree attainment has risen faster than the skills employers price, so unemployment rises with education level rather than falling. Eg. Urban youth unemployment in the 15 to 29 age group stood at 13.6% even as the overall unemployment rate stayed at 3.1%.
- The workforce is concentrated in low productivity work: A large share of workers remains in self employment and casual labour, where earnings do not accumulate into savings or standing. Eg. Self employment accounted for 56.2% of employment and casual labour for 20.2%.
- Agriculture holds labour it cannot pay for: The sector employs a share of the workforce far above its contribution to output, which caps rural incomes. Eg. Agriculture employs about 43% of the workforce and contributes around 15% to 16% of output.
- Female participation limits the size of the dividend: A dividend calculated on the working age population is not realised where half of it stays outside the labour force. Eg. Female labour force participation stood at 40.0% against 79.1% for men.
- Social security does not follow the worker: Platform and informal workers move between employers and locations faster than benefit entitlements can be established. Eg. Portable benefits for gig workers were introduced only through the e-Shram linkage under the four labour codes effective 21 November 2025.
- The dividend is unevenly distributed across States: States that completed the demographic transition earlier are ageing while the working age surge continues elsewhere, so the labour surplus and the job supply sit in different places. Eg. Kerala’s multidimensional poverty rate of 0.55% sits alongside Bihar’s 33.76%, and the two States are at opposite ends of the age structure.
- Aspiration outruns the migration corridor: Young workers who move for work enter cities without housing, portable schooling or urban welfare registration. Eg. Migrant workers were excluded from ration entitlements outside their home State until One Nation One Ration Card portability was rolled out.
Conclusion
The visible Gen Z at Jantar Mantar had converted disappointment into a demand, and that conversion is what made it photographable. The larger part of the cohort holds the same grievance without the vocabulary or the platform to state it, which is why absence rather than presence is the more accurate measure of the generation. The demographic dividend framing has obscured this by treating a young population as a payout rather than as a claim that must be earned. What remains unaddressed is the machinery that converts aspiration into mobility, namely employable skills, formal jobs and portable social protection.
What is Inclusive Growth?
- About: Inclusive growth is economic growth that raises the incomes and capabilities of every group in the population, not only aggregate output.
- Rationale: It exists because headline growth can rise while the bottom half of the distribution gains little, leaving poverty, unemployment and inequality intact alongside a rising gross domestic product.
- The three domains it is studied across: Overall inequality, poverty, and unemployment.
- The three dimensions in the framework of the Organisation for Economic Co-operation and Development (OECD):
- Participation: All groups are able to contribute to the growth process.
- Benefit sharing: All groups gain from growth in proportion to their contribution.
- Equity: Historical disadvantages are actively redressed through policy.
- Where it entered Indian planning: The Eleventh Five Year Plan (2007 to 2012) was titled “Rapid and More Inclusive Growth” and the Twelfth Five Year Plan (2012 to 2017) was titled “Faster, Sustainable, and More Inclusive Growth”.
Key Concerns Regarding Inclusive Growth
- Trickle down has not operated: Headline expansion in gross domestic product has not translated into proportionate gains for the bottom half of the distribution.
- Growth has been jobless in composition: High informal employment shares and structural underemployment persist alongside robust manufacturing and services output.
- Regional disparity accumulates: Gains concentrate within urban clusters and industrialised States, widening per capita income divergence across regions.
- Redistribution capacity is weak: The effective tax burden on ultra high net worth individuals is often lower than on middle income households, which limits the fiscal space for welfare intervention.
- Wealth inequality compounds across generations: Wealth transfers through inheritance in a way income does not, so the wealth distribution is more concentrated than the income distribution and stays that way.
- Group based exclusion cuts across income: Gender, caste, region and rural or urban location each produce separate deprivation patterns that an income only measure does not capture.
Key Facts about India’s Youth and Labour Market
- Labour force participation: The labour force participation rate stands at 59.3%, with 79.1% for men and 40.0% for women.
- Worker population ratio: The worker population ratio stands at 57.4%, with 76.6% for men and 38.8% for women.
- Unemployment: The overall unemployment rate is 3.1%, at 2.4% in rural areas and 4.8% in urban areas.
- Youth unemployment: Unemployment in the 15 to 29 age group is 9.9%, down from 10.3% in 2024, with urban youth unemployment at 13.6% against 14.3% earlier.
- Employment composition: Self employment accounts for 56.2%, casual labour for 20.2% and regular wage or salaried employment for 23.6%.
- Income concentration: The top 10% capture 58% of national income and the bottom 50% earn 15%, per the World Inequality Report 2026.
- Wealth concentration: The top 10% hold 65% of national wealth and the top 1% alone holds 40%.
- Human development: India ranked 130 of 193 on the Human Development Index with a value of 0.685, and inequality erases 30.7% of that value, bringing the Inequality adjusted Human Development Index to 0.475.
- Multidimensional poverty: The national multidimensional poverty headcount fell from 29.17% in 2013-14 to 11.28% in 2022-23, with 24.82 crore people moving out of multidimensional poverty.
Laws and Rules Governing Gig and Platform Work in India
- Code on Social Security, 2020: Provides the first statutory definition of a gig worker and a platform worker in Indian law and empowers the Centre to frame welfare schemes for them.
- It provides for an aggregator contribution towards a social security fund, set as a share of the aggregator’s annual turnover subject to a ceiling linked to payments made to workers.
- The four labour codes, effective 21 November 2025: Consolidate the earlier labour statutes and introduce a universal minimum wage floor, extend social security to gig workers and provide portable benefits through the e-Shram registry.
- Rajasthan Platform Based Gig Workers (Registration and Welfare) Act, 2023: The first State law dedicated to platform workers, providing for a welfare board, mandatory registration of workers and aggregators and a welfare fee levied on transactions.
- Karnataka platform based gig workers welfare law, 2025: Establishes a welfare board and a transaction level welfare fee, and provides for notice and a reasoned order before a worker is terminated from a platform.
- Unorganised Workers’ Social Security Act, 2008: The earlier framework for welfare schemes for unorganised sector workers, operating through National and State Social Security Boards.
Government Initiatives for Youth Employment and Skilling
- Pradhan Mantri Kaushal Vikas Yojana 4.0 (2022 to 2026): The flagship short term skilling scheme, under which 1.4 crore youth have been trained.
- National Apprenticeship Promotion Scheme: Supports stipend linked apprenticeships in establishments, with over 10 lakh registered apprentices.
- e-Shram: The national database of unorganised and platform workers, used as the registry through which portable social security benefits are delivered.
- Pradhan Mantri Mudra Yojana: Provides collateral free credit to micro enterprises, with disbursement across 43 crore loans since 2015, largely to micro entrepreneurs and women.
- PM SVANidhi: Provides working capital loans to street vendors, with 68 lakh loans disbursed.
- Viksit Bharat Gramin Rozgar Adhiniyam, 2025: Replaces the earlier rural employment guarantee with a 125 day wage guarantee together with skill and livelihood diversification components, effective 1 July 2026.
- Pradhan Mantri Jan Dhan Yojana: Provides the basic banking access on which wage, benefit and credit delivery to young and informal workers rests, with 58.63 crore accounts.
Challenges in Achieving Inclusive Growth in India
- The informal economy absorbs most new entrants: Job creation happens largely outside registered enterprises, where wages, hours and safety are unenforced. Eg. Around 56% to 57% of workers remain self employed rather than in wage employment.
- Regional divergence is widening rather than closing: Poorer States add the most working age population while investment concentrates in already industrialised States. Eg. Bihar records a multidimensional poverty headcount of 33.76% and Jharkhand 28.81%, against Kerala at 0.55%.
- The rural and urban gap persists in deprivation, not only income: Access to health, schooling and sanitation remains structurally weaker in rural areas. Eg. Rural multidimensional poverty stands at 15.96% against urban at 5.27%.
- Caste concentrates assets independently of policy: Ownership of productive wealth remains skewed towards groups that already held it. Eg. Upper castes, at just over a quarter of the population, control 88.4% of billionaire wealth and own nearly 55% of total wealth.
- Women’s work is undercounted and underpaid: Unpaid care work keeps women out of measured employment and depresses earnings when they enter it. Eg. Women earn about 61% of men’s hourly earnings excluding unpaid work, and only 32% when unpaid work is included.
- The tax system does not redistribute at the top: Low effective tax burdens on the very wealthy constrain the fiscal room for public services that would raise mobility. Eg. The World Inequality Report 2026 finds the effective tax burden on the very wealthy often lower than on middle income households.
- Human development trails income growth: Gains in output have not translated into proportionate gains in health, education and gender outcomes. Eg. India’s Gender Inequality Index value is 0.403 with a rank of 102, and the country falls in Group 5 on the Gender Development Index.
Way Forward
- Tie skilling to placement outcomes rather than enrolment counts: Fund training providers on verified employment retention at six and twelve months instead of on numbers trained.
- Extend the platform worker welfare model nationally: Convert the State level transaction fee and welfare board design into a uniform national mechanism under the Code on Social Security, 2020 so benefits do not stop at a State border.
- Make social protection portable by default: Link e-Shram registration to health, accident and pension entitlements that travel with the worker across employers, platforms and States.
- Create a formal job track in labour intensive manufacturing and construction: Direct incentives towards sectors that absorb workers with school level education, rather than towards capital intensive sectors that add output without adding jobs.
- Raise female labour force participation through care infrastructure: Expand crèche provision, safe transport and hostel capacity, which are the binding constraints on entry rather than willingness to work.
- Publish district level youth employment data: Report youth unemployment and employment composition at the district level so the mismatch between where young workers live and where jobs are created becomes visible to planners.
- Strengthen redistribution at the top of the distribution: Widen the base for capital and inheritance related taxation to fund the education, health and urban services that determine mobility.
“[2014, GS3, 12.5] “While we flaunt India’s demographic dividend, we ignore the dropping rates of employ ability.” What are we missing while doing so? Where will the jobs that India desperately needs come from? Explain”