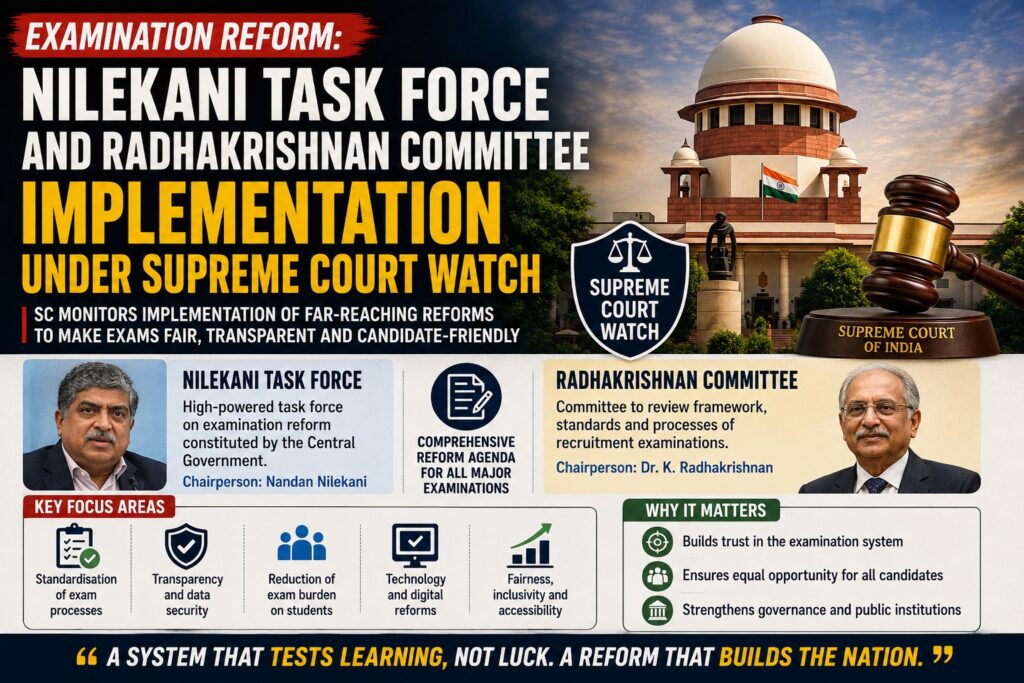
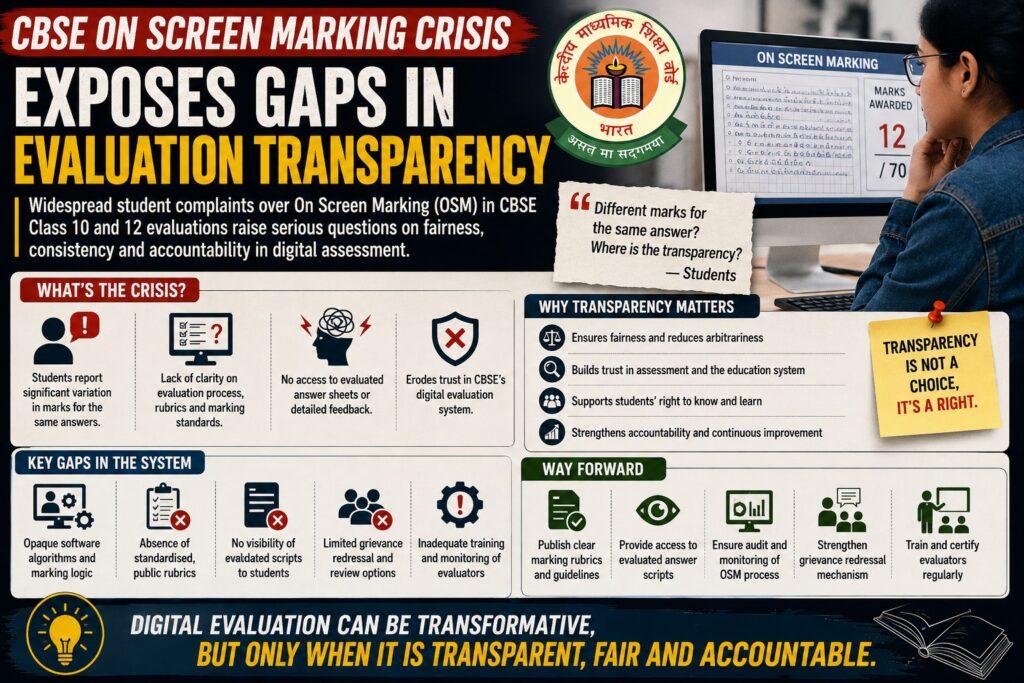
💥UPSC 2027,2028 Mentorship (June Batch) + Access XFactor Notes & Microthemes PDF

Type: Explained

  • Foreign Policy Watch: India-China

    [3rd June 2026] The Hindu OpED: The harvest China wants is one India cannot afford

    PYQ Relevance[UPSC 2017]‘China is using its economic relations and positive trade surplus as tools to develop potential military power status in Asia’. In the light of this statement, discuss its impact on India as her neighbour.Linkage: The PYQ focuses on China’s broader strategy of converting economic, diplomatic, and strategic influence into regional power projection. The article reflects China’s broader strategy of using its growing power to strengthen territorial claims and strategic leverage along the India-China border, particularly through the “Early Harvest” proposal.

    Mentor’s Comment

    India and China have resumed discussions on boundary settlement through the Special Representatives (SR) mechanism after years of tensions following the 2020 Galwan crisis. The significance lies in the reported revival of the idea of an “early harvest” settlement in the Sikkim sector, a proposal first discussed in 2005. 

    What is the Indo-China border?

    The India-China border is defined by a 3,488-kilometre-long frontier known as the Line of Actual Control (LAC).

    Three Sectors of the LAC

    The un-demarcated border is geopolitically divided into three operational sectors:

    1. Western Sector: Covers Ladakh. It features key flashpoints like the Galwan Valley, Pangong Tso, and the Depsang Plains, directly adjacent to the Chinese-controlled Aksai Chin wasteland.
    2. Central Sector: Runs across the peaceful, less contested states of Himachal Pradesh and Uttarakhand.
    3. Eastern Sector: Spans Sikkim and Arunachal Pradesh. It historically follows the McMahon Line, which India recognizes but China disputes by claiming Arunachal Pradesh as “South Tibet“.

    How Have India-China Boundary Negotiations Evolved?

    Phase 1: Historical Boundary Legacy

    1890 Anglo-Chinese Convention

    1. Defined the Sikkim-Tibet boundary.
    2. Mentioned Mount Gipmochi as the starting point.
    3. Introduced the watershed principle.

    Phase 2: Military Confrontation

    1967 Nathu La and Cho La Clashes

    1. Major armed confrontations after the 1962 war.
    2. Demonstrated unresolved border disputes.

    Phase 3: Confidence-Building Era

    1993 Agreement on Peace and Tranquillity

    1. First major agreement to maintain stability along the LAC.
    2. 1996 CBM Agreement: Military confidence-building measures.
    3. 2005 Political Parameters and Guiding Principles: Created framework for final boundary settlement. Envisaged:
      1. Political settlement first.
      2. Delimitation later.
      3. Demarcation afterwards.

    Phase 4: Emergence of the Early Harvest Idea

    2005-2010s

    1. Discussions emerged on resolving easier sectors first.
    2. Sikkim identified as a possible candidate.
    3. India remained cautious about abandoning the package-settlement approach.

    Phase 5: Doklam and Strategic Distrust

    2017 Doklam Standoff

    1. China attempted road construction near the tri-junction.
    2. India intervened.
    3. Highlighted strategic importance of Sikkim-Doklam region.

    Phase 6: Breakdown of Trust

    2020 Galwan Clash

    1. First combat fatalities in decades.
    2. India linked broader bilateral relations to peace on the LAC.

    Phase 7: Renewed Negotiations

    May 2025: Working Mechanism for Consultation and Coordination (WMCC) discussed steps toward boundary delimitation.

    August 2025

    1. 24th Special Representatives Meeting.
    2. Agreement to establish an Expert Group.
    3. China referred to “demarcation” and negotiations in favourable sectors.

    Phase 8: Current Debate

    China’s Preference: Sector-wise or “Early Harvest” settlement.

    India’s Preference

    1. Comprehensive package settlement.
    2. Peace and tranquillity on the LAC as a precondition.
    3. Protection of interests in Eastern Ladakh, Arunachal Pradesh, and the Doklam tri-junction.

    How Do Recent India-China Boundary Talks Indicate a Revival of the “Early Harvest” Approach?

    The Early Harvest Proposal refers to the idea of resolving those sectors of the India-China boundary where agreement is relatively easier, while leaving the more contentious sectors for later negotiations. Under this approach:

    1. India and China would first settle the Sikkim sector, where differences are comparatively limited.
    2. More difficult disputes such as Eastern Ladakh and Arunachal Pradesh would be postponed.
    3. China would obtain a formal settlement in one sector while negotiations continue indefinitely elsewhere.

    Why Does the Revival of the “Early Harvest” Proposal Matter?

    1. Special Representatives Dialogue: India and China held the 24th round of SR talks in August 2025, reviving discussions on boundary settlement.
    2. Expert Group Formation: Both sides agreed to establish an Expert Group to examine boundary delimitation in India-China border areas.
    3. Chinese Terminology Shift: China used the term “demarcation” and referred to launching negotiations in sectors where conditions are favourable.
    4. Strategic Concern: Sector-wise settlements could enable China to secure gains in less disputed regions while retaining leverage in contentious sectors.
    5. Diplomatic Significance: Marks the return of political-level boundary negotiations after prolonged military tensions.

    What Is the Historical Basis of the Sikkim Boundary Dispute?

    1. Nathu La Clashes (1967): Heavy casualties occurred on both sides despite Sikkim’s eventual accession to India.
    2. Convention of 1890: The Anglo-Chinese Convention identified Mount Gipmochi as the starting point of the Sikkim-Tibet boundary.
    3. Watershed Principle: The convention specified that the boundary follows the mountain ridge separating watersheds.
    4. Tri-Junction Dispute: India and Bhutan maintain that the tri-junction lies near Batang La, about 6.5 km north of Gipmochi.
    5. Strategic Geography: The dispute directly affects the location of the India-China-Bhutan tri-junction.

    Why Is the Tri-Junction Location Strategically Important?

    1. Jampheri/Zompelri Ridge: Controls approaches overlooking the Siliguri Corridor.
    2. Siliguri Corridor Security: The narrow corridor connects mainland India with the Northeast.
    3. Chinese Objective: A favourable tri-junction location would provide China greater strategic depth in the Chumbi Valley.
    4. Military Leverage: Enhanced access could improve Chinese observation and operational capabilities.
    5. Territorial Implications: A revised boundary could indirectly legitimise Chinese claims over nearby areas.

    How Does the Doklam Experience Influence India’s Position?

    1. Chinese Consolidation: Since the 2017 Doklam standoff, China has strengthened military infrastructure in western Bhutan.
    2. Road Construction: Expansion of roads and permanent facilities has altered ground realities.
    3. Pressure on Bhutan: Increased Chinese presence creates incentives for Bhutan to negotiate on China’s terms.
    4. Indian Concerns: Any settlement affecting the tri-junction could have direct consequences for India’s security.
    5. Strategic Lesson: Temporary stand-offs do not necessarily prevent long-term territorial consolidation.

    Why Does India Link Boundary Settlement With Peace Along the LAC?

    1. Galwan Legacy: The 2020 clashes fundamentally altered trust levels in bilateral relations.
    2. LAC Stability Principle: India maintains that broader normalization depends on peace and tranquillity along the border.
    3. Military Buildup: Large-scale troop deployments remain in several sectors.
    4. Confidence Deficit: Repeated violations of prior understandings have weakened confidence in incremental agreements.
    5. Negotiation Framework: India seeks restoration of stability before pursuing major political settlements.

    How Has China Altered Ground Realities Along the Border?

    1. Infrastructure Expansion: Construction of roads, airfields, logistics hubs, and border villages.
    2. Military Consolidation: Increased troop presence and deployment capabilities along sensitive sectors.
    3. Administrative Assertion: Renaming locations in Arunachal Pradesh seeks to reinforce territorial claims.
    4. Border Villages Programme: Expansion of settlements near the LAC strengthens administrative presence.
    5. Strategic Messaging: Combines military, political, and infrastructural measures to reinforce claims.

    What Was the Significance of the 2005 Agreement?

    1. Political Parameters Agreement (2005): Established principles for resolving the boundary issue.
    2. Two-Step Process: Envisaged political settlement first, followed by delimitation and demarcation.
    3. Package Settlement Concept: Favoured an overall settlement rather than sector-wise resolution.
    4. Mutual Safeguards: Recognized the need to protect strategic interests of both sides.
    5. Framework Relevance: Continues to provide the most comprehensive basis for negotiations.

    Should India Accept a Sector-Wise Settlement?

    Arguments in Favour

    1. Incremental Progress: Resolves less contentious sectors.
    2. Confidence Building: May improve bilateral atmosphere.
    3. Diplomatic Momentum: Prevents complete stagnation of negotiations.
    4. Administrative Clarity: Reduces ambiguity in settled regions.

    Arguments Against

    1. Loss of Leverage: Settled sectors can no longer be bargaining instruments.
    2. Strategic Risk: May strengthen Chinese positions elsewhere.
    3. Fragmented Resolution: Leaves core disputes unresolved.
    4. Historical Precedent: Past agreements have not always prevented new tensions.
    5. Asymmetrical Benefits: China could secure gains while retaining flexibility in contentious sectors.

    What Principles Should Guide India’s Negotiating Strategy?

    1. Comprehensive Settlement: Prioritises holistic resolution over isolated agreements.
    2. LAC Stability: Makes peace and tranquillity a precondition for progress.
    3. Strategic Reciprocity: Ensures mutual concessions rather than unilateral compromises.
    4. Protection of Core Interests: Safeguards Arunachal Pradesh, Eastern Ladakh, and Siliguri Corridor security.
    5. Ground Verification: Links agreements with verifiable implementation.

    Conclusion

    India’s challenge is not merely to settle a boundary segment but to secure a durable and equitable border framework. Any settlement must preserve strategic interests, maintain stability along the LAC, and avoid creating incentives for future coercion. A comprehensive settlement rooted in the 2005 framework, supported by verifiable peace on the ground, remains more consistent with India’s long-term security and diplomatic objectives than a narrowly defined “early harvest” approach.

  • Industrial Sector Updates – Industrial Policy, Ease of Doing Business, etc.

    The future of India’s chip industry

    Why in the News?

    Recently, NITI Aayog Frontier Tech Hub report was released and it assesses the country’s readiness for chip manufacturing. India has approved its first semiconductor fabrication unit at Dholera and launched a ₹76,000 crore India Semiconductor Mission. But, the report finds that the domestic ecosystem is still not equipped to meet national demand.

    How Has India Built the Foundations of a Semiconductor Ecosystem?

    1. Policy Priority: Semiconductor manufacturing has been identified as a strategic national priority.
    2. India Semiconductor Mission (ISM): Operates with a corpus of ₹76,000 crore.
    3. Financial Support: Provides incentives for fabs, compound semiconductor facilities, packaging units, design initiatives, and research.
    4. Capital Subsidies: Major projects receive capital support of up to 50%.
    5. Production Incentives: Several projects receive production-linked and output-linked incentives.
    6. Dholera Fab: India’s first semiconductor fabrication facility is expected to become operational by 2028.
    7. Ecosystem Development: Multiple packaging and testing facilities have been approved.

    India Semiconductor Mission

    1. The India Semiconductor Mission (ISM) is a specialized, independent business division within the Digital India Corporation under the Ministry of Electronics and Information Technology (MeitY). 
    2. It was launched in 2021 with an original financial outlay of ₹76,000 crore.
    3. Its core purpose is to build a vibrant, sustainable semiconductor and display ecosystem to transition India from a chip consumer into a global electronic manufacturing and design hub.

    Core Schemes & Financial Support: The initiative operates as a single-window nodal agency that evaluates proposals and distributes a 50% fiscal subsidy on a pari-passu basis across critical segments:

    1. Semiconductor Fabs: Financial backing to set up silicon-based wafer fabrication plants.
    2. Display Fabs: Incentives for building TFT LCD or AMOLED display manufacturing units.
    3. Compound Semiconductors & ATMP: Support for Silicon Photonics, Sensors, and Assembly, Testing, Marking, and Packaging (ATMP/OSAT) plants.
    4. Design Linked Incentive (DLI): Financial and infrastructure support for domestic fabless companies developing Integrated Circuits and Systems on Chips (SoCs).

    ISM 2.0

    1. Announced in the latest 2026 Union Budget, ISM 2.0 drives local supply chain self-sufficiency. 
    2. It receives a targeted ₹1,000 crore budgetary provision for FY 2026-27 alongside an overall ₹8,000 crore layout for the modified manufacturing program. 

    Key targets include:

    1. Upstream Supply Chains: Localizing production of specialty gases, chemicals, and lithography tools.
    2. Indian IP & Processors: Scaling indigenous open-source RISC-V processors like DHRUV64 under the Digital India RISC-V (DIR-V) programme to secure digital sovereignty.
    3. Talent Pyramid: Training over 85,000 to 100,000 engineers via the Chips to Startup (C2S) program and dedicated SMART Labs.
    4. NITI Aayog Roadmap: Aligning with the NITI Frontier Tech Hub’s newly released “Future of India’s Semiconductor Industry” roadmap to target a $100-110 billion domestic market by 2030.

    Why Does the Report Argue That India Remains Semiconductor-Dependent?

    1. Import Dependence: India depends almost entirely on external suppliers, importing an estimated $15+ billion in electronics hardware. Major suppliers include China, Hong Kong, Taiwan, and Singapore
    2. Domestic Supply Gap: India’s semiconductor ecosystem cannot fully meet domestic demand. The domestic semiconductor ecosystem is largely limited to Assembly, Testing, Marking, and Packaging (ATMP) rather than full-scale fabrication.
    3. Electronics Vulnerability: Growth in electronics manufacturing remains dependent on external suppliers.
    4. National Security Concerns: Defence systems rely on imported semiconductor components.
    5. Supply-Chain Risks: Geopolitical disruptions could affect access to critical technologies and components.

    What Structural Challenges Limit India’s Semiconductor Manufacturing Ambitions?

    1. Time-Intensive Manufacturing Cycle
      1. Long Gestation Period: Semiconductor fabs generally require 4-5 years before commercial production.
      2. Yield Optimisation: Reliability and quality improvement continue for several quarters after production begins.
    2. Technological Complexity
      1. Equipment Dependence: More than 50 specialised equipment categories are required.
      2. Global Supplier Concentration: Critical manufacturing tools are controlled by a limited number of international firms.
    3. Capital Intensity
      1. High Investment Requirements: Semiconductor manufacturing demands massive upfront capital expenditure.
      2. Financial Risks: Long project cycles increase uncertainty for investors.
    4. Skill Requirements
      1. Advanced Expertise: Requires highly skilled engineers, designers, and process specialists.
      2. Technology Gaps: Domestic capabilities remain under development.

    Should India Replicate the Entire Global Semiconductor Value Chain?

    India should not replicate the entire global semiconductor value chain, as doing so is financially impractical and technologically inefficient. The global semiconductor industry is highly fragmented, capital-intensive, and reliant on decades of hyper-specialization across different countries.

    1. Selective Strategy: The report discourages attempts to replicate the complete global manufacturing spectrum.
      1. Example: Instead of trying to build complex extreme ultraviolet (EUV) lithography machines (a sector monopolized by ASML in the Netherlands), India is focusing on specific nodes (like 28nm and above) that serve automotive and consumer electronics markets.
    2. Capital Efficiency: Setting up a single advanced semiconductor fabrication plant (fab) can cost upwards of $10 billion to $20 billion. Replicating the entire chain would require hundreds of billions of dollars.
      1. Example: By directing capital toward Assembly, Testing, Marking, and Packaging (ATMP) and Outsourced Semiconductor Assembly and Test (OSAT) facilities, such as the Tata Electronics facilities, India can enter the manufacturing ecosystem faster and at a fraction of the cost of a leading-edge logic fab.
    3. System-Level Differentiation: Emphasises strategic specialisation rather than broad replication.
      1. Example: India houses nearly 20% of the world’s semiconductor design engineers. By utilizing the Design-Linked Incentive (DLI) scheme, local startups can design specialized, proprietary chips for Artificial Intelligence (AI), 5G communications, and Internet of Things (IoT) devices, establishing a unique global niche.
    4. Resource Optimisation: Supports targeted investments in high-potential segments.

    Why Does the Report Advocate a Shift Towards Mature and Strategic Nodes?

    Semiconductor nodes represent the transistor size, with advanced (3-7nm) focusing on density for high-end computing and mature nodes (28nm+) offering reliability for industrial use. The report advocates shifting toward mature and strategic nodes because they cost significantly less to build, have higher market demand in India, and directly secure critical industries like defense and automotive.

    1. Technological Feasibility: India currently lacks the manufacturing ecosystem, equipment base, and process expertise required for competitive production at advanced 3-7 nanometre nodes.
    2. Capital Efficiency: Mature-node semiconductor facilities require significantly lower investment and entail lower commercial risks than cutting-edge fabrication plants.
    3. Market Demand: Mature-node chips continue to dominate demand in automobiles, industrial machinery, consumer electronics, power systems, and telecommunications equipment.
    4. Strategic Utility: Domestic production of mature semiconductors can strengthen supply-chain resilience in defence, telecom, automotive, and critical infrastructure sectors.
    5. Comparative Advantage: Compound semiconductors offer niche opportunities where India can develop specialised capabilities without directly competing in the most advanced fabrication segments.
    6. Faster Capability Creation: Focusing on mature technologies enables quicker ecosystem development, workforce training, and industrial scaling than pursuing frontier-node manufacturing.

    Why Can Semiconductor Packaging Become India’s Most Viable Entry Point into the Global Semiconductor Industry?

    1. Lower Capital Requirement: Packaging and testing facilities require substantially lower investment than semiconductor fabrication plants, making entry easier for India.
    2. Technological Accessibility: Packaging operations involve lower technological complexity than advanced-node chip fabrication, reducing entry barriers.
    3. Workforce Advantage: India’s large pool of engineers and technical professionals can support labour-intensive assembly, testing, and packaging operations.
    4. Faster Capacity Expansion: Packaging facilities can be established and scaled more quickly than fabrication units, enabling rapid ecosystem development.
    5. Import Substitution Potential: Domestic packaging capabilities can reduce dependence on foreign assembly and testing services in high-volume semiconductor segments.
    6. Global Value Chain Integration: Packaging provides a practical route for India to participate in international semiconductor supply chains without mastering frontier-node manufacturing.
    7. Foundation for Ecosystem Growth: A strong packaging industry can create demand for ancillary industries, skills, logistics networks, and future fabrication investments.

    What Does “Sovereign Design and Research Capability” Mean for India?

    1. Design Leadership: Moves beyond manufacturing toward intellectual-property creation.
    2. R&D Excellence: Strengthens indigenous innovation capabilities.
    3. AI Integration: Promotes application of Artificial Intelligence in semiconductor engineering.
    4. Deep Capabilities: Supports transition from service-led design activities to original technology creation.
    5. Architectural Innovation: Encourages development of differentiated semiconductor systems and integration technologies.

    How Should India Structure Future Semiconductor Investments?

    1. Second Phase of ISM: Future policy support is under consideration.
    2. Investment Requirement: The report estimates $45-60 billion over a ten-year period.
    3. Bankability Focus: Recommends prioritising projects with clearer commercial viability.
    4. Risk Management: Encourages investment in segments with stronger return potential.
    5. Targeted Expansion: Supports gradual ecosystem deepening rather than large-scale expansion across all segments.

    Which International Partnerships Are Critical for India’s Semiconductor Strategy?

    1. Strategic Partners: Identifies the United States, Japan, European Union, and South Korea as priority partners.
    2. Technology Access: Facilitates acquisition of critical manufacturing tools.
    3. Lifecycle Support: Strengthens equipment servicing and maintenance.
    4. Knowledge Transfer: Expands access to advanced manufacturing practices.
    5. Packaging Advantage: Leverages India’s workforce and packaging ecosystem.

    What Are the Broader Strategic Implications for India?

    1. Economic Security: Reduces dependence on external technology suppliers.
    2. Supply-Chain Resilience: Protects against geopolitical disruptions.
    3. National Security: Supports defence and critical infrastructure requirements.
    4. Industrial Competitiveness: Strengthens electronics manufacturing.
    5. Technological Sovereignty: Enhances control over critical technologies.
    6. Global Positioning: Improves India’s role in future technology ecosystems.

    Conclusion

    India’s semiconductor strategy is entering an execution phase where success will depend less on replicating the entire global value chain and more on building competitive strengths in areas aligned with domestic capabilities. The NITI Aayog report advocates a pragmatic approach centred on mature-node manufacturing, semiconductor packaging, design innovation, and strategic international partnerships. By prioritising commercially viable segments while gradually deepening technological capabilities, India can strengthen supply-chain resilience, reduce strategic vulnerabilities, and establish itself as a credible participant in the global semiconductor ecosystem.

    PYQ Relevance

    [UPSC 2025] India aims to become a semiconductor manufacturing hub. What are the challenges faced by the semiconductor industry in India? Mention the salient features of the Indian Semiconductor Mission

    Linkage: The PYQ tests understanding of high-technology manufacturing, industrial policy, technological self-reliance, and strategic sectors. The article evaluates India’s semiconductor strategy through the NITI Aayog report, highlighting challenges in fabrication, supply chains, investment, and skills while assessing the future direction of the India Semiconductor Mission

  • Land Reforms

    How land pooling solves acquisition woes

    Why in the News?

    Rajasthan has announced its first-ever land pooling scheme, signalling a major shift in the way urban land is assembled for infrastructure and development projects.

    What is land pooling?

    Land pooling is a land acquisition strategy where landowners voluntarily hand over their land parcels to a government agency or development authority. The authority consolidates (pools) the land, builds modern infrastructure and then returns a smaller but highly developed portion of the land back to the original owners.

    How does land pooling work?

    1. Pooling: Landowners voluntarily transfer their fragmented, irregular plots to a central authority to create one continuous tract.
    2. Infrastructure Development: The authority reserves a percentage of the total land to build roads, utilities, parks, and public services.
    3. Reconstitution: The authority reorganises the remaining land into a planned layout of commercial, residential, and industrial plots.
    4. Return: Each landowner receives back a physically smaller but highly developed plot equipped with modern amenities and significantly higher market value.

    Example

    Gujarat Town Planning (TP) Model

    1. Land Contribution: Landowners typically contribute about 25-40% of their land.
    2. Land Return: Approximately 60-75% of land is returned as serviced plots.
    3. Integrated Development: Combines land assembly, infrastructure provision, cost recovery, and urban planning within a single framework.

    How is land pooling governed in India?

    Land pooling in India is governed through a decentralized framework managed primarily by individual state governments, rather than a single central federal law. The structural and legal governance framework breaks down into four primary tiers:

    1. Constitutional Authority: Under the Constitution of India, Land and Colonisation fall explicitly under the State List (List II, Seventh Schedule).
    2. State-Specific Legislative Acts
      1. The Mechanism: States enact standalone Town Planning Acts or Urban Development Acts that provide the legal backbone for land pooling.
      2. Examples: Notable examples include the Gujarat Town Planning and Urban Development Act, 1976, and the Andhra Pradesh Capital Region Development Authority Act, 2014, which laid out the legal rules for building the city of Amaravati.
    3. Execution by Development Authorities
      1. The Mechanism: State governments delegate the actual implementation and policing of land pooling schemes to specialized Urban Development Authorities.
      2. The Power: Entities like the Delhi Development Authority (DDA) or the Mumbai Metropolitan Region Development Authority (MMRDA) are legally authorized to notify zones for pooling, verify land titles, collect landowner consensus, and re-allot reconstituted plots.
    4. Judicial Oversight and Grievance Redressal
      1. The Mechanism: State pooling policies mandatorily incorporate dedicated dispute resolution tribunals, appellate authorities, or arbitrators.

    How Has Traditional Land Acquisition Become a Constraint to Urban Infrastructure Development?

    1. Procedural Complexity: Land acquisition has historically been lengthy, litigation-prone, and administratively challenging.
    2. Post-2013 Cost Escalation: The Right to Fair Compensation and Transparency in Land Acquisition, Rehabilitation and Resettlement Act, 2013 increased compensation, rehabilitation, and resettlement obligations.
    3. Financial Burden: Higher compensation requirements have significantly increased project costs.
    4. Implementation Gap: Planned infrastructure often remains under-executed due to inability to mobilise land.
    5. Urbanisation Pressure: Expanding cities require large-scale land assembly for roads, public facilities, housing, and economic infrastructure.

    Why Is Land Pooling Considered More Equitable Than Compulsory Acquisition?

    1. Participatory Planning: Landowners remain stakeholders rather than losing ownership entirely.
    2. Reduced Displacement: Limits physical displacement compared to conventional acquisition.
    3. Value Capture: Landowners benefit from appreciation in land value after infrastructure development.
    4. Financial Sustainability: Infrastructure costs are recovered through incremental development charges rather than large upfront expenditure.
    5. Social Acceptance: Voluntary participation reduces resistance and legal disputes.
    6. Environmental Protection: Facilitates planned development while preserving environmentally sensitive areas.

    Why Is Gujarat Considered India’s Most Successful Land Pooling Model?

    1. Historical Evolution: Land pooling was introduced nearly 100 years ago.
    2. Legal Foundation: Formalised under the Gujarat Town Planning and Urban Development Act, 1976.
    3. Large-Scale Implementation: More than 1,000 sq. km. has been planned through TP schemes.
    4. Geographical Coverage: Implemented across Ahmedabad, Surat, Rajkot, Vadodara, and Gandhinagar.
    5. Institutional Continuity: Strong legal backing and administrative experience enabled long-term success.
    6. Urban Expansion: Facilitated orderly peripheral growth and infrastructure provision.

    Why Has Maharashtra Recently Revived Interest in Land Pooling?

    1. Statutory Limitations: Existing legal provisions were not adequately updated for TP schemes.
    2. Recent Adoption: The model has gained momentum in Pune and the Mumbai Metropolitan Region Development Authority (MMRDA).
    3. Peripheral Development: Supports infrastructure creation and serviced land development in expanding urban regions.
    4. Growth Management: Provides an alternative to fragmented urban expansion.

    Why Land Pooling Initiatives like Guwahati Face Difficulties?

    1. Institutional Challenges
      1. Legal Gaps: The Guwahati Metropolitan Development Authority Act, 1985 lacked clarity on land appropriation percentages and institutional responsibilities.
      2. Implementation Ambiguity: Development scheme preparation procedures remained inadequately specified.
    2. Land Records Challenges
      1. Manual Records: Land records were not digitised.
      2. Record Mismatch: Discrepancies existed between revenue records and actual ground conditions.
    3. Administrative Solutions
      1. Existing Map Utilisation: Authorities retained existing maps instead of conducting extensive joint surveys.
      2. Revenue-Based Allocation: Final plot allocation was based on land area recorded in revenue documents.
      3. Time Efficiency: Reduced scheme preparation time.
    4. Contribution Adjustment
      1. Reduced Contribution: Private landowners contributed only 12-15% of land.
      2. Comparison: Conventional schemes generally require 35–45% land contribution.
      3. Infrastructure Focus: Contributed land was primarily used for road development.

    How Is Rajasthan Attempting to Make Land Pooling More Viable?

    1. Statutory Recognition: Land pooling provisions already existed since 2016.
    2. Implementation Push: Rajasthan is now operationalising the framework.
    3. Land Value Reforms: Modifications are being made to land-value calculations.
    4. Cost Sharing: Government has absorbed part of the development cost.
    5. Financial Equity: Reduces burden on participating landowners.
    6. Stakeholder Acceptance: Makes participation more attractive.

    What Factors Will Determine the Success of Future Land Pooling Schemes?

    1. Stakeholder Trust: Requires convincing landowners of long-term benefits.
    2. Legislative Clarity: Ensures certainty regarding rights, obligations, and compensation.
    3. Digital Land Records: Improves transparency and reduces disputes.
    4. Flexible Contribution Models: Allows adaptation to local realities.
    5. Institutional Capacity: Strengthens planning authorities and implementation agencies.
    6. Equitable Financial Models: Distributes costs and benefits fairly.
    7. Context-Specific Design: Avoids one-size-fits-all approaches.

    Conclusion

    Land pooling represents a shift from a compensation-centric model of land acquisition to a partnership-based model of urban development. The experiences of Gujarat, Maharashtra, Guwahati, and Rajasthan demonstrate that success depends less on the concept itself and more on institutional capacity, legal clarity, digitised land records, and equitable benefit-sharing. As India’s urbanisation accelerates, land pooling can become a critical instrument for balancing infrastructure needs with property rights and inclusive development.

    Value Addition

    Land Pooling vs Land Acquisition

    DimensionLand AcquisitionLand Pooling
    OwnershipGovernment acquires landLandowners retain stake
    CompensationMonetary paymentReconstituted serviced plots
    ParticipationCompulsoryVoluntary
    DisplacementHigherLower
    LitigationHighRelatively lower
    Cost BurdenUpfront government expenditureShared through value capture
    Benefit SharingLimitedBroader and participatory

    PYQ Relevance

    [UPSC 2024] What were the factors responsible for the successful implementation of land reforms in some parts of the country? Elaborate.

    Linkage: The question focuses on land governance, fair land distribution, and factors that make land reforms successful. Land pooling is a modern land reform approach that uses voluntary participation, clear land records, and shared benefits to support planned development.

  • Air Pollution

    Why do cities get polluted in summer

    Why in the News?

    Summer air pollution has emerged as a major concern after the Commission for Air Quality Management (CAQM) revoked all restrictions under the Graded Response Action Plan (GRAP) in March 2026. This marked the end of the winter pollution season in Delhi-NCR. However, persistent pollution episodes during April-May, including 54 days of PM10 exceedances in Delhi, forced authorities to reimpose GRAP Stage-I measures. This highlights that air pollution is no longer a winter-only problem and requires year-round management.

    How does summer air pollution differ from winter pollution?

    Winter pollution is dominated by PM2.5 accumulation

    1. Temperature Inversion: Traps pollutants near the surface.
    2. Low Wind Speeds: Restrict pollutant dispersion.
    3. Basin-like Topography: Especially in Delhi and the Indo-Gangetic Plain, facilitates pollutant accumulation.
    4. Biomass Burning: Adds substantial PM2.5 load during winter months.

    Summer pollution is dominated by PM10 and ozone

    1. Coarse Particulate Matter (PM10): Generated from dust storms, road dust, construction activity, and resuspended dust.
    2. Ground-Level Ozone: Formed through photochemical reactions under strong sunlight and high temperatures.
    3. Stronger Winds: Enhance pollutant dispersion but simultaneously transport dust across regions.
    4. Thunderstorms: Can temporarily improve air quality through atmospheric cleansing.

    Why are Indian cities witnessing pollution episodes during summer

    Meteorological conditions differ from winter but remain conducive to pollution

    1. Higher Temperatures: Accelerate atmospheric chemical reactions.
    2. Intense Solar Radiation: Enhances ozone formation.
    3. Dust Transport: Winds carry dust over long distances.
    4. Regional Variability: Different cities experience different dominant pollutants.

    Evidence from major cities

    1. Delhi: Recorded 54 days exceeding PM10 standards during April–May 2026.
    2. Mumbai: Experienced elevated PM10 and ozone levels due to construction activity, dust, and traffic.
    3. Hyderabad: Reported pollution spikes despite relatively better ventilation conditions.
    4. Kolkata and Chennai: Recorded ozone and PM10 exceedances on multiple days.
    5. Bengaluru: Witnessed increasing summer ozone episodes.

    What causes PM10 spikes during summer months?

    Dust storms emerge as the primary driver

    1. West Asian Dust Transport: Dust originating from subcontinent-adjacent arid regions interacts with local weather systems.
    2. Dust Intrusion: Dust can travel from arid landscapes toward northern India during strong wind events.
    3. Atmospheric Instability: Supports long-range transport of coarse particles.

    Local dust generation worsens pollution

    1. Construction Activities: Release large quantities of coarse dust particles.
    2. Demolition Work: Contributes significantly to suspended particulate matter.
    3. Road Dust Resuspension: Moving vehicles continuously lift deposited dust.
    4. Urban Expansion: Increases exposed surfaces vulnerable to wind erosion.

    Data from Delhi

    1. PM10 Exceedance Days (April-May 2026): 54 days exceeded 24-hour NAAQS limits.
    2. Hourly Exceedances: At least one CAAQMS crossed 180 μg/m³ on 40 days.

    Why does ozone pollution increase during hot weather?

    1. Ozone is a secondary pollutant
      1. No Direct Emission: Ground-level ozone is not emitted directly.
      2. Photochemical Formation: Forms through reactions involving precursor pollutants. Major precursors
        1. Nitrogen Oxides (NOx): Emitted from vehicles and industries.
        2. Volatile Organic Compounds (VOCs): Released from fuels, solvents, paints, industrial processes, and vehicle exhaust.
    2. Meteorological triggers
      1. High Temperature: Accelerates reaction rates.
      2. Strong Sunlight: Provides energy required for ozone formation.
      3. Heatwaves: Create highly favorable conditions for ozone accumulation.
    3. Public health implications
      1. Respiratory Disorders: Causes breathing difficulties.
      2. Lung Irritation: Damages respiratory tissues.
      3. Public Health Risk: Particularly affects children, elderly persons, and individuals with pre-existing respiratory illnesses.

    How do dust storms affect air quality in India?

    Dust storms have regional impacts

    1. PM10 Surges: Produce sudden spikes in particulate pollution.
    2. Cross-Border Influence: Dust can travel across large geographical areas.
    3. Reduced Visibility: Impairs transportation and public safety.

    Indian context

    1. Northern India: Frequently affected due to proximity to desert regions.
    2. Thunderstorm-Associated Dust Events: Strong downdrafts lift and transport loose soil particles.
    3. Pre-Monsoon Season: Experiences maximum dust storm frequency.

    How do human activities worsen summer air pollution?

    1. Construction Activities: Generate large quantities of coarse particulate matter (PM10) through excavation, demolition, and material handling. Construction dust remains a major contributor to urban summer pollution.
    2. Road Dust Resuspension: Heavy vehicular movement lifts deposited dust from roads, significantly increasing PM10 concentrations during dry summer conditions.
    3. Vehicular Emissions: Release particulate matter, nitrogen oxides (NOx), and volatile organic compounds (VOCs). These contribute directly to particulate pollution and indirectly to ozone formation.
    4. Industrial Emissions: Emit NOx, VOCs, and other pollutants that participate in photochemical reactions responsible for ground-level ozone formation.
    5. Poor Dust Management: Inadequate covering of construction materials, unpaved surfaces, and weak enforcement of dust-control norms aggravate particulate pollution.

    What forecasting mechanisms are available for managing summer pollution?

    1. Air Quality Early Warning System (AQEWS)
      1. Origin: Developed following severe dust storm and smog events.
      2. Coverage Expansion: Extended from Delhi to cities such as Jaipur and Mumbai.
      3. Forecast Capability: Provides multi-day pollutant forecasts.
      4. Integrated Weather Information: Supports proactive response measures.
    2. IMD Air Quality Bulletins
      1. Forecast Frequency: Released several times daily.
      2. Coverage: Delhi and approximately 140 Indian cities.
      3. Utility: Facilitates issuance of public advisories and exposure reduction measures.

    What measures can cities adopt to combat summer air pollution?

    1. Forecast-based interventions
      1. Early Warning Systems: Enable advance preparedness. Authorities can use IMD’s weather forecast bulletins to issue local alerts for dust storms, poor air quality and ozone to the citizens.
      2. Public Health Advisories: Reduce citizen exposure during high-pollution episodes.
    2. Dust management measures
      1. Construction Site Monitoring: Ensures compliance with dust-control norms.
      2. Mechanical Road Sweeping: Reduces loose particulate matter.
      3. Dust Suppression Technologies: Minimize resuspension.
      4. Study by Council on Energy, Environment and Water found that simply reducing heavy-vehicle movement at construction sites can lower local PM levels.
      5. Example: The Brihanmumbai Municipal Corporation’s Air Quality Decision Support System (AQDSS) monitors construction sites and has helped authorities take action against more than 1,000 construction sites since October 2025, demonstrating the importance of strict dust-control compliance.
    3. Vehicular emission reduction
      1. Cleaner Transport Systems: Reduce NOx emissions.
      2. Traffic Management: Limits idling emissions.
      3. Public Campaigns: Encourage behavioral change.
      4. Example: Delhi’s “Red Light On, Gaadi Off” Campaign: Encourages drivers to switch off engines at traffic signals to reduce emissions.

    Key Dust-Control Norms in India

    1. Covering of Construction Materials: Sand, soil, cement, and debris must be covered to prevent wind-blown dust.
    2. Anti-Smog Guns and Water Sprinkling: Mandatory at large construction sites to suppress airborne dust.
    3. Green Nets/Wind Barriers: Installed around sites to prevent dust dispersion into surrounding areas.
    4. Covered Transportation: Trucks carrying C&D waste or raw materials must be covered with tarpaulin sheets.
    5. Wheel-Washing Facilities: Vehicles exiting construction sites should pass through wheel-washing systems to prevent mud and dust deposition on roads.
    6. Mechanical Road Sweeping: Regular cleaning of adjoining roads to remove accumulated dust.
    7. Paved Internal Roads: Reduces dust generation from vehicle movement within sites.
    8. Proper C&D Waste Management: Segregation, storage, recycling, and scientific disposal of construction waste.

    CAQM’s Framework for Dust Mitigation in NCR

    1. Mandatory dust management plans for large projects.
    2. Real-time monitoring of construction activities.
    3. Penalties and project shutdowns for repeated violations.
    4. Use of remote sensing and inspection teams for enforcement. 

    Why is a year-round strategy necessary?

    1. Continuous Forecasting: Enables advance warnings for dust storms, ozone episodes, and deteriorating air quality through systems such as AQEWS and IMD forecasts.
    2. Season-Specific Interventions: Requires winter measures for PM2.5 control, summer dust-management measures for PM10 reduction, and targeted NOx-VOC controls for ozone mitigation.
    3. Public Health Protection: Reduces exposure through timely advisories during heatwaves, dust storms, and ozone episodes.
    4. Institutional Preparedness: Ensures mechanisms such as GRAP, municipal action plans, and pollution monitoring systems remain operational throughout the year rather than only during winter.
    5. Integrated Urban Air Quality Governance: Combines forecasting, construction dust regulation, road dust management, cleaner transport, and industrial emission controls into a continuous management framework.

    Conclusion

    The rise of summer pollution episodes demonstrates that India’s air quality challenge extends far beyond winter smog. Dust storms, PM10 pollution, and ground-level ozone have transformed summer into a critical pollution season. Effective air quality governance now requires year-round monitoring, forecasting, dust control, emission reduction, and public health preparedness across all major urban centres.

    PYQ Relevance

    [UPSC 2021] Describe the key points of the revised Global Air Quality Guidelines (AQGs) recently released by the World Health Organisation (WHO). How are these different from its last update in 2005? What changes in India’s National Clean Air Programme are required to achieve these revised standards?

    Linkage: PYQ directly examines air quality management, pollution standards, monitoring mechanisms, and policy interventions for improving urban air quality. The article reinforces the need for continuous air quality management, forecasting systems, dust control measures, and strengthened NCAP implementation to meet national and global air quality standards.

  • Innovations in Biotechnology and Medical Sciences

    The genie of synthetic biology is out, and with it comes power and peril

    Why in the News?

    Advances in synthetic biology, genome sequencing, artificial intelligence, and genome synthesis are rapidly giving humans the ability not only to read DNA but also to design and create new biological systems. This marks a historic shift from understanding life to engineering life.

    What is Synthetic Biology?

    1. Definition: Synthetic biology is the application of engineering principles to biology to design, modify, or create organisms, cells, genes, or biological systems with desired functions.
    2. Objective: Moves beyond studying life to actively engineering biological systems.
    3. Approach: Combines genetics, molecular biology, biotechnology, computer science, artificial intelligence, and engineering.
    4. Applications: Drug development, vaccines, biofuels, industrial chemicals, climate-resilient crops, and environmental remediation.
    5. Significance: Enables scientists to redesign existing life forms or create biological systems that do not exist in nature.

    What is DNA?

    1. DNA (Deoxyribonucleic Acid): The hereditary molecule that stores genetic information in living organisms.
    2. Building Blocks: Consists of four nucleotide bases:
      1. Adenine (A)
      2. Thymine (T)
      3. Guanine (G)
      4. Cytosine (C)
    3. Function: Contains instructions for building and maintaining an organism.
    4. Location: Found in nearly every cell of living organisms.
    5. Importance: Acts as the biological code that determines traits, growth, development, and cellular functions.

    What is a Genome?

    1. Definition: A genome is the complete set of DNA present in an organism.
    2. Contents: Includes:
      1. Genes that code for proteins
      2. Regulatory DNA that controls gene activity
    3. Role: Serves as the complete biological blueprint of an organism.
    4. Human Genome: Contains about 22,000 protein-coding genes.
    5. Significance: Differences in genomes explain biological diversity among species.

    What is the Genomic Revolution?

    1. Definition: The rapid advancement in genome sequencing technologies that has dramatically increased the ability to read and analyse DNA.
    2. Trigger: Massive reduction in sequencing costs and time.
    3. Human Genome Project Comparison:
      1. Took over a decade
      2. Cost nearly $3 billion
      3. Involved thousands of scientists
    4. Today:
      1. Genome sequencing can be completed in hours
      2. Costs have fallen to a few hundred dollars
    5. Major Outcomes:
      1. Mapping evolutionary history
      2. Understanding diseases
      3. Identifying genetic adaptations
      4. Personalized medicine
      5. Genome engineering
      6. Synthetic biology
    6. Significance: The genomic revolution has transformed biology into a data-driven science and laid the foundation for synthetic biology.

    How Has Understanding DNA Transformed Humanity’s Ability to Engineer Life?

    1. DNA as the Language of Life: DNA stores genetic information through four nucleotides, A, T, G, and C, which determine biological structure and function.
    2. Genome as Biological Blueprint: Every cell contains a genome comprising thousands of genes and regulatory sequences.
    3. Protein Synthesis: Genes encode proteins that perform structural, regulatory, metabolic, and physiological functions.
    4. Regulatory Architecture: Complexity arises not merely from gene numbers but from when, where, and how genes are expressed.
    5. Transcription Factors: Specialized proteins switch genes on or off, creating diverse biological outcomes.
    6. Phenylketonuria Example: Understanding genetic disorders has enabled dietary interventions that allow affected individuals to live normal lives.

    Why Does Gene Number Alone Not Explain Biological Complexity?

    1. Limited Difference in Gene Count: Humans possess approximately 22,000 genes, compared with:
      1. Escherichia coli: ~4,300 genes
      2. Fruit fly: ~17,000 genes
      3. Mouse: ~22,000 genes
      4. Water flea (Daphnia): ~31,000 genes
    2. Regulation Over Quantity: Biological complexity depends largely on gene regulation rather than the absolute number of genes.
    3. Expression Dynamics: Variations in timing, location, intensity, and interaction of gene expression create complexity.
    4. Cellular Specialization: Identical genomes produce diverse cell types through differential gene expression.

    How Has the Genomic Revolution Expanded Human Knowledge About Life?

    1. Reconstruction of Evolutionary History
      1. Evolutionary Mapping: Genome sequencing reconstructs the tree of life and evolutionary relationships among organisms.
      2. Complement to Fossils: Genomic evidence fills gaps where fossil records are absent.
      3. Historical Precision: Provides unprecedented accuracy in tracing biological evolution over millions of years.
    2. Understanding Adaptation and Natural Selection
      1. Adaptive Evolution: Genetic variations reveal how organisms adapt to environmental conditions.
      2. Human Diabetes Example: Genes predisposing populations to Type-II diabetes may have evolved under conditions of fluctuating food availability but become maladaptive under modern abundance.
      3. Selection Processes: Genome studies reveal how mutations are preserved or eliminated through natural selection.
    3. Building Comprehensive Cellular Maps
      1. Cellular Atlases: Sequencing enables identification of:
        1. Gene expression patterns
        2. Protein localization
        3. Cellular functions
        4. Regulatory interactions
      2. Big Data Biology: Massive biological datasets are enabling integrated understanding of cellular systems.
      3. Systems Biology: Facilitates comprehensive models of life processes rather than isolated gene studies.

    How Is Artificial Intelligence Accelerating Synthetic Biology?

    1. Computational Design: AI enables analysis of large-scale biological and environmental data.
    2. Genome Engineering: Scientists can increasingly design sections of genomes or entire genomes digitally.
    3. Predictive Biology: AI supports prediction of biological outcomes before laboratory implementation.
    4. Design Optimization: Accelerates identification of desirable genetic traits and functions.
    5. Reduced Costs: Improves accessibility and efficiency of biological engineering.
    6. Current Limitation: Biological systems often resist simplistic in silico predictions, requiring experimental validation.

    What New Possibilities Does Synthetic Biology Create?

    1. Designer Cells
      1. Biomanufacturing: Engineered cells produce chemicals, drugs, fuels, and advanced materials. Example: Genetically modified yeast is used to manufacture insulin and other therapeutic proteins.
      2. Industrial Biotechnology: Supports sustainable production systems. Example: Engineered microbes are used in the production of bioethanol and biodegradable plastics.
      3. Novel Biological Products: Enables creation of compounds not found naturally. 
    2. Engineered Organisms
      1. Genome-Wide Engineering: Modification extends beyond individual genes to entire genomes.
      2. Agricultural Applications: Facilitates development of improved crops and livestock.
      3. Biomedical Applications: Supports advanced therapeutics and regenerative medicine.
    3. Creation of Synthetic Life
      1. Artificial Genomes: Scientists can synthesize complete genomes and insert them into living cells.
      2. Novel Organisms: Opens possibilities for entirely new biological entities.

    Why Was Craig Venter’s Experiment a Historic Turning Point?

    1. Synthetic Genome Creation: In 2010, J. Craig Venter and his team chemically synthesized a complete bacterial genome.
    2. Genome Transplantation: The synthetic genome was inserted into a bacterial cell whose native DNA had been removed.
    3. Digitally Created Life: The experiment represented the first major demonstration of a cell controlled by a synthetic genome.
    4. Biological Watermarking: Non-coding DNA regions contained encoded quotations from:
      1. James Joyce: “To live, to err, to fall, to triumph, to recreate life out of life.”
      2. Richard Feynman: “What I cannot create, I do not understand.”
      3. J. Robert Oppenheimer: “See things not as they are, but as they might be.”
    5. Future Potential: Genome synthesis may eventually allow creation of larger synthetic genomes and engineered organisms.

    How Does Bottom-Up Synthetic Biology Attempt to Recreate the Origin of Life?

    1. Bottom-Up Synthetic Biology: Seeks to construct living systems from scratch using non-living chemical components. Instead of modifying existing organisms, it attempts to recreate the earliest stages through which life may have emerged on Earth.
    2. Scientific Objective: Examines one of biology’s fundamental questions, how non-living molecules transformed into self-replicating living systems approximately 4 billion years ago.
    3. Protocell Construction: Researchers build simplified cell-like structures called protocells, which mimic some characteristics of primitive life forms but are not fully living organisms.
    4. Jack Szostak’s Research: Developed fatty-acid membrane structures that can spontaneously assemble, encapsulate RNA molecules, grow by incorporating surrounding molecules, and divide into smaller daughter structures.
    5. Origin of Life Studies: Such experiments help scientists understand how the first biological cells may have formed before the evolution of complex organisms.
    6. Future Possibilities: Success in creating self-replicating protocells could eventually enable the development of entirely new forms of artificial life designed for specific purposes.
    7. Example: Jack Szostak’s protocell experiments demonstrated that simple fatty-acid vesicles can spontaneously form membrane-bound compartments capable of enclosing RNA and undergoing growth and division, providing a possible model for the earliest stages of life on Earth.

    Why Does Synthetic Biology Create Unique Governance Challenges?

    1. Self-Replicating Systems: Unlike machines, living organisms can reproduce and evolve.
    2. Unpredictability: Biological systems exhibit emergent properties and complex interactions.
    3. Biosecurity Risks: Potential misuse for harmful biological applications.
    4. Ecological Risks: Release of engineered organisms may alter ecosystems.
    5. Ethical Concerns: Raises questions regarding ownership, modification, and creation of life.
    6. Dual-Use Nature: Technologies useful for medicine and industry may also pose security threats.

    How Should Society Balance Innovation and Regulation in Synthetic Biology?

    1. Scientific Freedom: Advances require open research and innovation.
    2. Risk-Based Regulation: Governance frameworks must evaluate risks proportional to applications.
    3. Global Coordination: Biological risks transcend national boundaries.
    4. Responsible Innovation: Ethical oversight should accompany technological development.
    5. Precautionary Principle: Requires anticipation of future risks before deployment.
    6. Adaptive Governance: Regulations must evolve alongside technological progress.

    Conclusion

    Synthetic biology marks a transition from decoding life to designing life. The convergence of genomics, artificial intelligence, and genome synthesis offers unprecedented opportunities in healthcare, agriculture, industry, and environmental sustainability. However, because biological systems can self-replicate and evolve, governance challenges are fundamentally different from those associated with conventional technologies. The future of synthetic biology will depend on balancing scientific innovation with robust ethical, biosafety, and biosecurity safeguards.

    PYQ Relevance

    [UPSC 2021] What are the research and developmental achievements in applied biotechnology? How will these achievements help to uplift the poorer sections of society?

    Linkage: The PYQ examines the transformative potential of biotechnology and its socio-economic applications. With the new advancements, a question on synthetic biology can be asked next. The article extends the biotechnology discourse from genetic modification to genome engineering, synthetic genomes, and artificial life.

  • Trade Sector Updates – Falling Exports, TIES, MEIS, Foreign Trade Policy, etc.

    Remittance anchor the rupee, India’s external balances

    Why in the News?

    The Indian rupee has lost nearly 12% of its value against the U.S. dollar since May 2025, leading to renewed concerns regarding India’s external-sector vulnerability. Many analysts have attributed this trend to weakening foreign investment inflows. But at the same time, India received $138 billion in remittances in 2024, making it the world’s largest remittance recipient by a wide margin. More significantly, remittances have, on average, financed more than the entirety of India’s trade deficit since mid-2013.

    What are Remittances?

    1. A remittance refers to the transfer of money from one party to another, most commonly signifying foreign remittance, which involves cross-border funds transferred between individuals or entities in India and abroad. 
    2. While it technically encompasses domestic wire transfers, the term is primarily used for the money sent home by Non-Resident Indians (NRIs) and migrant workers to support their families or make investments.

    Types of Remittances in India

    The Reserve Bank of India (RBI) and the Foreign Exchange Management Act (FEMA) classify these financial transfers into two main types: 

    1. Inward Remittance: Funds sent from a foreign country into a domestic bank account in India. An example is an NRI working in the United States sending money to their parents living in Mumbai.
    2. Outward Remittance: Funds sent from a local bank account in India to an account located abroad. An example is parents in India sending money to a child studying at a university in Singapore.

    Why Does the Conventional Explanation for Rupee Depreciation Present an Incomplete Picture?

    1. Rupee Depreciation: The rupee has depreciated by nearly 12% against the U.S. dollar since May 2025.
    2. FDI Narrative: Several analysts attribute the depreciation primarily to declining net FDI inflows.
    3. FPI Narrative: Volatile portfolio investments are also cited as a major source of pressure on the rupee.
    4. Negative Net FDI: Net FDI became negative in Q2 FY2025-26 after showing a declining trend since Q2 FY2021-22.
    5. Analytical Gap: Excessive attention to Financial Account flows understates the contribution of remittances recorded under the Current Account.

    If Net FDI Has Turned Negative, Why Has India’s External Position Not Deteriorated More Sharply?

    1. Remittance Cushion: Large remittance inflows continue to provide foreign exchange despite weakening capital flows.
    2. Scale of Inflows: India received approximately $138 billion in remittances during 2024.
    3. CAD Financing: Remittances absorb a substantial portion of the financing burden created by trade deficits.
    4. Exchange-Rate Support: Stable inflows reduce pressure on the rupee and foreign exchange reserves.
    5. External Stability: Remittances offset some of the risks arising from negative FDI and volatile FPI.

    What is the Current Account Deficit (CAD)? (Points Form)

    1. Definition: Current Account Deficit arises when a country’s payments to the rest of the world exceed its receipts through the Current Account of the Balance of Payments.
    2. Components of Current Account:
      1. Trade Balance (Exports-Imports of Goods)
      2. Net Services (IT, tourism, shipping, etc.)
      3. Net Primary Income (interest, dividends, profits)
      4. Net Secondary Income (remittances, gifts, grants)
    3. Cause: Occurs when imports and income outflows exceed exports, services earnings and transfer receipts.
    4. Significance: Indicates the extent to which a country depends on external financing.
    5. Financing Sources: FDI, FPI, external commercial borrowings and foreign exchange reserves.
    6. Impact of High CAD:
      1. Increases external vulnerability.
      2. Creates depreciation pressure on the domestic currency.
      3. Raises dependence on foreign capital inflows.
    7. India-Specific Context: Large remittance inflows generate a surplus under Net Secondary Income (NSI), which helps reduce the CAD and strengthens external-sector stability.

    How Have Remittances Financed More Than the Entire Trade Deficit Since Mid-2013?

    This is due to their immense scale, steady growth, and structural shift toward high-value transfers from advanced economies. In India’s Balance of Payments (BoP), the massive gap created by importing more goods than exporting (the merchandise trade deficit) is largely cancelled out by “invisibles,” where remittances play an anchoring role.

    1. Record Inflows: India received approximately $138 billion in remittances in 2024, making it the world’s largest remittance recipient and generating foreign exchange inflows equivalent to nearly 3% of GDP.
    2. Net Secondary Income Surplus: Remittances constitute the largest component of India’s Net Secondary Income (NSI) surplus in the Current Account.
    3. Trade Deficit Offset: The NSI surplus generated by remittances offsets a substantial portion of the merchandise trade deficit.
    4. Structural Shift in Sources: A growing share of remittances originates from high-income economies, increasing the value and stability of transfers.
    5. Sustained Foreign Exchange Buffer: Consistently positive remittance inflows have enabled them to finance more than the entirety of India’s trade deficit on average since mid-2013.

    What Has Been the Impact of Remittances on India’s External Sector?

    1. Current Account Impact: Net Secondary Income surpluses significantly reduce the Current Account Deficit.
    2. Residual CAD: Remaining deficits become substantially smaller after accounting for remittance inflows.
    3. Financing Burden: Lower CAD reduces the amount that must be financed through FDI, FPI or external borrowing.
    4. External Resilience: Remittances act as the first line of defence against external imbalances and sudden capital-flow reversals.
    5. Exchange Rate Support: Stable foreign exchange inflows reduce pressure on the rupee and forex reserves.

    How Do Remittances Reduce India’s Dependence on FDI and FPI?

    1. Trade Deficit Absorption: Remittance inflows offset a substantial portion of India’s merchandise trade deficit.
    2. CAD Reduction: Net Secondary Income (NSI) surpluses narrow the Current Account Deficit.
    3. Lower External Financing Needs: A smaller CAD requires less financing through FDI, FPI and external borrowing.
    4. Reduced Vulnerability: Lower dependence on volatile capital flows strengthens external-sector stability.
    5. Exchange Rate Support: Stable foreign exchange inflows help moderate pressure on the rupee.

    Are Remittances a More Reliable Source of External Financing Than FDI and FPI?

    1. Scale: Remittances amount to nearly 3% of GDP and exceed net FDI and FPI inflows.
    2. Stability: Household-driven transfers exhibit lower volatility than financial investments.
    3. Continuity: Family obligations sustain flows even during periods of uncertainty.
    4. Predictability: Migrant earnings and savings decisions generate more stable inflows.
    5. Resilience: Remittances rarely experience sudden stops comparable to capital flight.

    Why Do Remittances Strengthen India’s External Position Without Creating Future Liabilities?

    1. Transfer Nature: Remittances are transfers rather than investment claims.
    2. Liability-Free Inflows: Remittances do not require repayment.
    3. No Profit Repatriation: Unlike FDI, remittances do not generate future dividend or profit outflows.
    4. No Exit Risk: Unlike FPI, remittances cannot be withdrawn from domestic financial markets.
    5. Low Vulnerability: Remittances strengthen the external sector without creating future obligations.

    Conclusion

    India’s external resilience is increasingly anchored in remittances rather than volatile capital flows. While FDI and FPI remain important, remittances have financed a substantial share of the trade deficit, reduced the Current Account Deficit and supported the rupee without creating future liabilities. A comprehensive assessment of India’s external-sector health must therefore place remittances alongside, and in some contexts above, conventional measures of foreign capital inflows.

    PYQ Relevance

    [UPSC 2014] How does the Current Account Deficit affect the external stability of an economy?

    Linkage: The PYQ directly examines the relationship between the Current Account Deficit (CAD) and India’s external-sector resilience. The article revolves around the argument that remittances significantly reduce CAD and thereby strengthen external stability.

  • Tribes in News

    Religion and tribal identity: Why ‘delisting’ debate refuses to die down

    Why in the News?

    A major debate has been triggered following a large mobilisation of tribal organisations demanding the delisting of Scheduled Tribes who have converted to Christianity or Islam from the Scheduled Tribe category. The demand seeks to withdraw reservation benefits and other constitutional safeguards currently available to converted tribal communities.

    What is at Stake in the Delisting Debate?

    1. Educational Reservation: Scheduled Tribes receive 7.5% reservation in Central Educational Institutions, including IITs, NITs, Central Universities and other publicly funded institutions. They are also eligible for Pre-Matric Scholarships, Post-Matric Scholarships, National Fellowships and Eklavya Model Residential Schools (EMRSs).
    2. Public Employment: Scheduled Tribes receive 7.5% reservation in Central Government recruitment under Articles 16(4), 16(4A) and 335, ensuring representation in public services.
    3. Political Representation: Scheduled Tribes enjoy reserved representation under Article 330 (Lok Sabha) and Article 332 (State Legislative Assemblies). Reservation is also provided in local self-government institutions under Articles 243D and 243T.
    4. Constitutional Safeguards: Scheduled Tribes receive special protection under Article 46 (promotion of educational and economic interests), Article 244 (administration of Scheduled Areas), the Fifth Schedule (Scheduled Areas in mainland India), the Sixth Schedule (Autonomous District Councils in the Northeast) and Article 338A (National Commission for Scheduled Tribes).
    5. Protective Legislation: Scheduled Tribes are protected under the SC/ST (Prevention of Atrocities) Act, 1989, which criminalises caste- and tribe-based discrimination, violence and social exclusion.
    6. Forest and Community Rights: Scheduled Tribes enjoy rights under the Forest Rights Act, 2006, including Individual Forest Rights (IFR), Community Forest Resource Rights (CFRR) and rights over minor forest produce. Additional protections are available through the PESA Act, 1996, which empowers Gram Sabhas in Scheduled Areas.
    7. Land and Resource Protection: Many Fifth Schedule states impose restrictions on transfer of tribal land to non-tribals, protecting tribal communities from land alienation and displacement.
    8. Targeted Welfare Funding: Scheduled Tribes benefit from the Development Action Plan for Scheduled Tribes (DAPST), under which Union Ministries earmark funds specifically for tribal welfare and development.
    9. Demographic Significance: Scheduled Tribes constitute 8.6% of India’s population (Census 2011), amounting to over 10.45 crore people, making any proposed change in eligibility a matter of national significance.

    Why has the demand for delisting re-emerged in contemporary tribal politics?

    1. Reservation Benefits: Seeks exclusion of converted tribals from reservations, political representation and welfare schemes available to Scheduled Tribes.
    2. Identity Assertion: Strengthens demands for preservation of indigenous tribal faiths, customs and cultural practices.
    3. Sarna Recognition: Revives calls for separate recognition of Sarna and other tribal religions in Census enumeration.
    4. Cultural Preservation: Raises concerns regarding the perceived erosion of traditional tribal institutions and belief systems.
    5. Policy Reorientation: Attempts to redefine the relationship between constitutional protections and tribal identity.

    Is tribal identity a religious identity or an ethnic-cultural identity?

    1. Ethnic Foundations: Tribal identity originates from ancestry, kinship structures, customary practices and historical experiences.
    2. Community Membership: Continues through clan relationships, village institutions and traditional governance systems irrespective of religion.
    3. Cultural Continuity: Preserves festivals, customs, oral traditions and collective memory across generations.
    4. Constitutional Recognition: Derives from socio-historical disadvantage rather than religious affiliation.
    5. Indigenous Worldview: Reflects unique relationships with land, forests, nature and community life.

    Why does the Constitution treat Scheduled Tribes differently from Scheduled Castes?

    1. Article 342 Framework: Recognises Scheduled Tribes on the basis of community characteristics rather than religious identity.
    2. Religion-Neutral Status: Does not prescribe any religious qualification for inclusion or retention of ST status.
    3. Historical Criteria: Considers distinct culture, geographical isolation and socio-economic vulnerability.
    4. Constitutional Distinction: Differs from the Scheduled Caste framework where constitutional orders historically linked eligibility to religion.
    5. Protective Objective: Ensures support for historically marginalised tribal communities irrespective of faith.

    Can religious conversion extinguish tribal identity?

    1. Ancestral Linkages: Retains ethnic origins and kinship networks despite changes in personal faith.
    2. Social Participation: Enables continued participation in community festivals, customs and collective institutions.
    3. Cultural Affiliation: Preserves linguistic and cultural connections within tribal society.
    4. Legal Interpretation: Recognises tribal identity as broader than religious belief alone.
    5. Community Continuity: Maintains membership within the tribal social structure even after conversion.

    What are the major arguments advanced in favour of delisting?

    1. Benefit Rationalisation: Restricts constitutional safeguards to communities perceived as adhering to traditional tribal beliefs.
    2. Cultural Protection: Seeks preservation of indigenous customs, rituals and faith systems.
    3. Reservation Equity: Advocates redistribution of opportunities among non-converted tribal populations.
    4. Identity Conservation: Emphasises continuity of traditional tribal practices.
    5. Institutional Preservation: Supports protection of customary social and cultural institutions.

    What are the principal arguments against delisting?

    1. Constitutional Equality: Protects freedom of conscience and religion under Article 25.
    2. Ethnic Identity: Maintains that tribal status derives from ancestry and community rather than faith.
    3. Continuing Deprivation: Recognises that socio-economic disadvantages persist despite conversion.
    4. Social Cohesion: Prevents fragmentation of tribal communities on religious lines.
    5. Legal Consistency: Preserves the religion-neutral basis of Scheduled Tribe recognition.

    Why is the demand for a separate tribal religious code becoming increasingly important?

    1. Religious Enumeration: Facilitates independent recognition of tribal faith systems in Census records.
    2. Identity Visibility: Strengthens demographic representation of indigenous belief communities.
    3. Cultural Preservation: Protects distinct rituals, sacred groves and traditional worship practices.
    4. Policy Recognition: Supports formulation of targeted cultural preservation measures.
    5. Autonomous Identity: Reinforces the distinctiveness of tribal religions from major organised religions.

    How have courts interpreted the relationship between religion and tribal identity?

    1. Community Principle: Recognises tribal identity as rooted in community membership and ancestry.
    2. Cultural Criterion: Emphasises customs, traditions and collective practices as important determinants of identity.
    3. Religion-Neutral Approach: Distinguishes tribal status from individual religious affiliation.
    4. Continuity Doctrine: Accepts that conversion does not automatically sever tribal identity.
    5. Constitutional Safeguards: Supports continuation of protections based on tribal status rather than faith.

    What does the delisting debate reveal about the tension between cultural assimilation and tribal autonomy

    1. Cultural Autonomy: Protects the right of tribal communities to preserve distinct traditions and identities.
    2. Religious Absorption: Raises concerns regarding incorporation of tribal belief systems into larger religious frameworks.
    3. Symbolic Integration: Involves reinterpretation of tribal deities, practices and cultural symbols.
    4. Identity Preservation: Supports recognition of tribal cultures on their own terms.
    5. Constitutional Pluralism: Reinforces India’s commitment to protecting diverse cultural traditions.

    Conclusion

    The delisting debate highlights the need to balance tribal identity, religious freedom and constitutional equality. As the Xaxa Committee (2014) observed, tribal development must protect both cultural distinctiveness and socio-economic rights.

    PYQ Relevance

    [UPSC 2022] Given the diversities among tribal communities in India, in which specific contexts should they be considered as a single category?

    Linkage: The question examines the basis of a common constitutional and socio-political identity for Scheduled Tribes despite their immense linguistic, cultural and regional diversity. The article directly relates to the broader question of whether tribal communities should continue to be treated as a single constitutional category despite differences in faith, culture and social practices.

  • Forest Conservation Efforts – NFP, Western Ghats, etc.

    Aravalli range’s role in shielding Gangetic plains from Thar dust

    Why in the News?

    A massive dust storm recently affected Churu, Hanumangarh, Sri Ganganagar, Bikaner, Nagaur, Didwana-Kuchaman, Alwar and Sikar in Rajasthan, drawing attention to the critical role of the Aravalli Range in shielding the Indo-Gangetic Plains from Thar Desert dust. Scientists warn that degradation of the Aravallis due to mining, deforestation and land-use change is allowing more dust to reach Delhi, Punjab, Haryana and Uttar Pradesh, even during less intense storms.

    What are the features of the Aravallis Range?

    1. The Aravalli Range is one of the oldest surviving fold mountain systems on Earth. It serves as a vital ecological and climate-regulating spine across northwestern India.
    2. Location and Extent
      1. Length: The range stretches approximately 670 to 700 kilometres.
      2. Alignment: It runs in a distinct south-west to north-east direction.
      3. States Covered: The range begins near Delhi, passes through southern Haryana and Rajasthan, and terminates near Ahmedabad in Gujarat.
    3. Geological Significance
      1. Age: Formed during the Precambrian era (roughly 1.7 to 2.5 billion years ago), it predates the Himalayas by more than a billion years.
      2. Evolution: It was originally an immense mountain chain, potentially as tall as the modern Himalayas. Over eons, wind and water weathered it down into discontinuous, residual hills and ridges.
      3. Composition: The range consists of highly resistant metamorphic and igneous rocks, including quartzite, granite, schist, and gneiss
    4. Key Peaks and Drainage
      1. Highest Point: Guru Shikhar on the Mount Abu massif in Rajasthan, standing at 1,722 metres (5,650 feet).
      2. Major Rivers: The western slopes give rise to the Luni River (which drains into the Rann of Kutch) and the Sabarmati River. The eastern slopes feed the Banas River, a major tributary of the Chambal-Yamuna system.

    How do the Aravallis act as a natural shield against the Thar Desert dust?

    Dust Interception Mechanism

    1. Obstacle Dunes: Large sand deposits located on western slopes intercept dust-laden winds originating from the Thar Desert.
    2. Wind Velocity Reduction: Mountain slopes reduce wind speed, causing suspended dust particles to settle.
    3. Vegetation Barrier: Native vegetation acts as a natural scrubber, trapping dust and sand particles.
    4. Sediment Retention: Dunes and vegetation prevent long-distance transportation of desert sediments.
    5. Ecological Buffer: Protects densely populated Indo-Gangetic regions from excessive dust exposure.

    Scientific Evidence

    1. Field Observations: Obstacle dunes visibly demonstrate dust interception by the Aravallis.
    2. Vegetation Similarity: Dune vegetation resembles desert ecosystems, indicating long-term dust deposition processes.

    Why are dust storms becoming a growing concern in northern India?

    1. Increasing Dust Transport
      1. Pre-Monsoon Phenomenon: Dust storms commonly occur between April and June.
      2. Heat Conditions: Intense heating and dry atmospheric conditions facilitate dust mobilization.
      3. Wind Systems: South-westerly and westerly winds transport dust across northern India.
    2. Expanding Exposure
      1. IMD Climate Hazards Atlas: Identifies parts of northwest India within a high dust-storm frequency zone.
      2. Dust-Storm Frequency: Climatic normal ranges between 0.89 and 1.55 dust-storm days annually.
      3. Delhi Vulnerability: Long-term records place Delhi and adjacent districts within high exposure zones.
    3. Emerging Trend
      1. Lower Threshold Transport: Dust now reaches northern plains even during less intense storms.
      2. Wind Speed Impact: Dust transport increasingly observed at wind speeds of 35-40 kmph.
      3. Changing Pattern: Earlier, dust transport generally required stronger and more intense storm systems.

    How is degradation weakening the protective role of the Aravalli Range?

    1. Mining Activities
      1. Mineral Extraction: Mining of red silica, granite and other minerals has damaged hill ecosystems.
      2. Landscape Fragmentation: Mining operations create physical gaps that facilitate dust movement.
    2. Deforestation
      1. Vegetation Loss: Reduction in natural vegetation decreases dust-trapping capacity.
      2. Ecosystem Instability: Weakens soil retention and ecological resilience.
    3. Urbanisation and Construction
      1. Land Conversion: Expands built-up areas at the cost of ecological landscapes.
      2. Habitat Disruption: Alters natural terrain and ecological continuity.
    4. Land-Use Change
      1. Pastoral Activities: Intensive grazing pressures affect vegetation regeneration.
      2. Agricultural Expansion: Contributes to habitat modification and soil degradation.

    What is the current state of degradation in the Aravalli ecosystem?

    Forest Survey Findings

    1. Hill Loss: Assessment found that 31 out of 128 Aravalli hills in Rajasthan had disappeared due to anthropogenic pressures.
    2. Topographic Alteration: Significant reduction observed in hill systems between 200 and 600 metres above sea level.

    Affected Regions

    1. Naraina
    2. Kalwar
    3. Kotputli
    4. Jhalana
    5. Sariska

    These areas have witnessed substantial ecological disturbance.

    Government Assessment

    1. Aravalli Restoration Framework: Identified mining, deforestation, urbanisation, construction activities, land-use change, pastoral pressures and encroachments as major causes of degradation.

    What are the environmental and climatic consequences of Aravalli degradation?

    1. Air Quality Impacts
      1. Dust Intrusion: Increased transport of desert dust towards Delhi, Punjab, Haryana and Uttar Pradesh.
      2. Particulate Pollution: Worsens PM10 and PM2.5 concentrations.
      3. Public Health Risks: Raises respiratory and cardiovascular disease burden.
    2. Climate Impacts
      1. Rainfall Modification: Dust aerosols influence cloud formation and precipitation dynamics.
      2. Regional Climate Effects: Alter atmospheric circulation and radiation balance.
    3. Agricultural Impacts
      1. Soil Quality Changes: Dust deposition affects soil properties.
      2. Crop Stress: Reduced productivity under frequent dust exposure.
    4. Ecosystem Impacts
      1. Habitat Fragmentation: Reduces biodiversity connectivity.
      2. Desertification Risk: Facilitates eastward spread of arid conditions.

    Why are ecological gaps in the Aravallis a strategic environmental concern?

    1. Wildlife Institute Findings
      1. Gap Expansion: Twelve major gaps have been identified within the Aravalli system.
      2. Degradation Linkage: Expansion attributed to forest loss and inadequate ecological restoration.
    2. Dust Corridor Formation
      1. Wind Channels: Openings facilitate unhindered movement of dust particles.
      2. Reduced Interception: Weakens the range’s barrier function.
    3. Multi-State Implications
      1. Delhi: Air quality deterioration.
      2. Punjab and Haryana: Increased dust exposure.
      3. Uttar Pradesh: Greater environmental vulnerability.

    What policy interventions are required to restore the Aravalli ecosystem?

    1. Landscape Restoration
      1. Afforestation: Strengthens vegetative barriers across degraded stretches.
      2. Native Species Plantation: Enhances ecological adaptation and dust interception.
    2. Mining Regulation
      1. Compliance Mechanisms: Ensures strict implementation of environmental clearances.
      2. Illegal Mining Control: Prevents further hill degradation.
    3. Ecosystem-Based Management
      1. Watershed Restoration: Improves ecological stability.
      2. Soil Conservation: Reduces erosion and dust generation.
    4. Institutional Coordination
      1. Inter-State Cooperation: Facilitates coordinated conservation across Rajasthan, Haryana, Delhi and Gujarat.
      2. Integrated Monitoring: Strengthens environmental surveillance using remote sensing and GIS.
    5. Climate Adaptation
      1. Nature-Based Solutions: Enhances resilience against desertification and dust storms.
      2. Green Buffer Development: Supports long-term air quality management.

    Conclusion

    The Aravalli Range is not merely a geological feature but a critical ecological barrier that protects northern India from desert dust, air pollution and land degradation. Its continuing degradation due to mining, deforestation and unplanned development threatens the environmental security of Rajasthan, Delhi and the wider Indo-Gangetic Plains, making landscape restoration and sustainable management an urgent policy priority.

    PYQ Relevance

    [UPSC 2020] The process of desertification does not have climatic boundaries. Justify with examples

    Linkage: The PYQ tests understanding of desertification, land degradation and the wider ecological impacts of environmental change beyond arid regions. The article shows how degradation of the Aravalli Range is enabling Thar Desert dust to spread into Delhi and the Indo-Gangetic Plains, illustrating that the effects of desertification can extend far beyond desert areas.

  • Economic Indicators and Various Reports On It- GDP, FD, EODB, WIR etc

    Why inflation rate is not the same as affordability

    Why in the News?

    India’s inflation has remained mostly under the RBI’s target range of 2-6%, showing success in controlling price rise. However, many people still feel daily expenses are high because prices have increased over the years faster than incomes for many families. This has raised an important question: Does low inflation really mean things are affordable?

    Why is inflation different from affordability?

    1. Different Meaning: Inflation measures the rise in prices, while affordability measures whether people can still buy goods and services comfortably.
    2. Different Basis: Inflation focuses on price increase, whereas affordability depends on income growth relative to prices.
    3. Lower Inflation ≠ Lower Prices: A fall in inflation means prices are rising slowly, not that prices have reduced.
    4. Cumulative Effect: Affordability depends on the total increase in prices over time, not only yearly inflation.
    5. Real Purchasing Power: Even with low inflation, affordability declines if wages and incomes do not rise adequately.

    How has RBI succeeded in controlling inflation but not affordability concerns?

    1. Inflation Targeting Framework: RBI adopted formal inflation targeting in 2016, aiming to maintain retail inflation at 4% ±2%.
    2. Policy Success: Retail inflation remained largely within the 2-6% comfort band, except during exceptional shocks.
    3. Monetary Tightening: RBI increased repo rates to curb inflationary pressures arising from excess demand.
    4. Structural Limitation: Monetary policy controls the rate of price increase, not already elevated prices.
    5. Persistent Cost Burden: Even with lower inflation, consumers continue paying higher prices accumulated over previous years.

    Data Highlight:

    1. General price level increased by around 75% between April 2014 and March 2026.
    2. Prices rose by 41% between March 2019 and March 2026.

    How have rising prices affected different categories of workers?

    1. Salaried Workers: Experienced relatively better affordability as income growth outpaced inflation in several periods.
    2. Self-Employed Workers: Faced weaker affordability due to slower and irregular income growth.
    3. Casual Labourers: Remained most vulnerable because of lower absolute earnings despite wage increases.
    4. PLFS Classification: Periodic Labour Force Survey (PLFS) divides workers into:
      1. Salaried workers
      2. Self-employed workers
      3. Casual labourers
    5. Data (2017-18 to 2023-24):
      1. Casual Labour Income: Increased by 43%, yet average monthly earnings remained only around ₹13,590.
      2. Self-Employed Income: Reached around ₹14,861/month.
      3. Salaried Workers: Earned around ₹22,690/month, showing relatively higher resilience.

    Why does cumulative inflation matter more than annual inflation?

    1. Limited Picture of Annual Inflation: Shows price increase only compared to the previous year and may hide long-term cost burden.
    2. Rising Cost of Living: Cumulative inflation reflects the total increase in prices over several years, giving a clearer picture of household expenses.
    3. Real Affordability: Affordability depends on whether incomes grow faster than total price rise, not yearly inflation alone.
    4. Consumer Experience: Households feel the effect of accumulated increase in food, rent, transport, health, and education costs.
    5. Example from Article: If the price index was 100 in 2014 and rose to 175 by 2026, even moderate yearly inflation still results in much higher everyday costs.

    Why is affordability becoming a major policy concern?

    1. Consumption Slowdown: Weak purchasing power suppresses domestic demand.
    2. Growth Challenge: Lower household spending affects sectors dependent on mass consumption.
    3. Income Inequality: Divergence in wage growth widens economic disparities.
    4. Employment Quality Issue: Income growth depends on availability of stable and productive jobs.
    5. Policy Dilemma: Excessive inflation control through higher interest rates may further suppress investment and employment.

    Can RBI alone solve the affordability challenge?

    1. Monetary Policy Constraint: RBI can contain inflation but cannot directly raise incomes.
    2. Fiscal Policy Role: Government intervention through wage support, social protection, and targeted subsidies improves affordability.
    3. Employment Generation: Productive employment raises real wages sustainably.
    4. Supply-Side Reforms: Better logistics, food supply chains, and productivity reduce cost pressures.
    5. Welfare Measures: Public provisioning in health, education, and food reduces household expenditure burden.

    Conclusion

    Inflation management and affordability are not synonymous. While India has achieved relative success in maintaining inflation within RBI’s target range, household well-being ultimately depends on real purchasing power rather than inflation statistics alone. Sustainable affordability requires a combination of price stability, faster income growth, productive employment generation, and reduced cost burden on essential services.

    PYQ Relevance

    [UPSC 2024] What are the causes of persistent high food inflation in India? Comment on the effectiveness of the monetary policy of the RBI to control this type of inflation.

    Linkage: The PYQ tests understanding of inflation, RBI’s monetary policy, and limits of inflation control in improving economic outcomes. The article extends this debate by arguing that controlling inflation alone does not ensure affordability, as real income growth determines purchasing power.

  • Economic Indicators and Various Reports On It- GDP, FD, EODB, WIR etc

    RBI data shows why government is concerned about dollars flowing outs

    Why in the News?

    RBI’s Annual Report 2025-26 showed that India’s Balance of Payments (BoP) deficit widened sharply to $30.8 billion in 2025-26, compared to $5 billion in 2024-25. This marks a major reversal from the $63.7 billion surplus in 2023-24. This highlights rising pressure on India’s external sector due to weaker foreign investments and high dollar outflows for imports such as oil and gold.

    What is Balance of Payments (BoP)?

    The Balance of Payments (BoP) is a systematic record of all economic transactions between a country and the rest of the world during a specific period (usually a year). It tracks the flow of foreign currency (mainly dollars) into and out of the country. In simple terms, BoP shows whether a country is earning more dollars than it spends or spending more than it earns.

    What are the components of BoP?

    1. Current Account (Trade and Income Flows): It records transactions related to:
      1. Goods Trade: Exports and imports of merchandise (e.g., crude oil, machinery).
      2. Services Trade: IT services, tourism, consulting, shipping.
      3. Remittances: Money sent by Indians working abroad.
      4. Investment Income: Interest, dividends, profits.
      5. Example: India imports crude oil and exports IT services.
    2. Capital Account: Investments and Capital Flows: It records:
      1. Foreign Direct Investment (FDI): Long-term investments in industries.
      2. Foreign Portfolio Investment (FPI): Investment in stocks and bonds.
      3. External Borrowings: Loans from abroad.
      4. Banking Capital and Other Transfers
      5. Example: A foreign company investing in India or FIIs buying Indian shares.

    How is BoP interpreted?

    1. BoP Surplus: Dollar inflows exceed outflows, strengthens forex reserves.
    2. BoP Deficit: Dollar outflows exceed inflows, RBI may use foreign exchange reserves to bridge the gap.
    3. In 2025-26, India recorded a BoP deficit of $30.8 billion, meaning the country spent more foreign currency than it received, raising concerns about external sector stability.

    Why has India’s Balance of Payments deteriorated sharply in 2025-26?

    1. Balance of Payments Deficit: India recorded a BoP deficit of $30.8 billion in 2025-26, compared to $5 billion in 2024-25, showing a sharp deterioration in external sector stability.
    2. Sharp Reversal: India moved from a BoP surplus of $63.7 billion in 2023-24 to a large deficit in just two years, indicating weakening capital inflows.
    3. Foreign Exchange Pressure: RBI had to finance the deficit through foreign exchange reserves, leading to reserve depletion.
    4. Investment Slowdown: Net foreign investment inflows into India witnessed a sharp decline, worsening the external financing gap.

    How do the current account and capital account shape India’s external position?

    1. Current Account: Captures trade in goods and services, remittances, and cross-border income flows.
    2. Capital Account: Includes foreign direct investment (FDI), foreign portfolio investment (FPI), external borrowings, and assistance.
    3. Persistent Current Account Deficit (CAD): India generally imports more than it exports, making CAD a structural feature of the economy.
    4. Trade Deficit: India’s merchandise trade deficit stood at $251.6 billion in 2025–26, improving from $286.9 billion in the previous year, but still remaining substantially large.
    5. Services Surplus (‘Invisible Trade’): India earned a services surplus of $221.4 billion in 2025-26, lower than $263.9 billion in 2024-25, reducing the cushion available against merchandise deficits.

    Why did the capital account weaken despite India’s growth story?

    1. Capital Account Contraction: Capital account surplus declined sharply to $72 million in 2025-26, compared to $16.6 billion in 2024-25. This indicates weak external financing.
    2. Funds Held Abroad: Indians parked larger amounts abroad through delayed export receipts, advance import payments, and overseas holdings. This creates a deficit of $22.6 billion, compared to $7.4 billion previously.
    3. Geopolitical Impact: Trade disruptions linked to the West Asia crisis increased payment uncertainties and external pressures.
    4. Foreign Portfolio Investor (FPI) Outflows: FPIs withdrew $4.3 billion more than they invested in 2025-26, reversing the previous trend where inflows exceeded outflows.

    Why is the government especially concerned about oil and gold imports?

    1. Oil Dependence: India imports nearly 90% of its crude oil requirement, making external balances highly vulnerable to global oil price shocks.
    2. Gold Demand: India produces negligible gold domestically despite large consumer demand, increasing pressure on dollar reserves.
    3. Dollar Outflow: A substantial portion of India’s foreign exchange outflow is used to pay for oil and gold imports.
    4. Policy Response: The government raised import duty on gold and silver from 6% to 15% and restricted imports of several silver categories to reduce external pressure.
    5. Consumption Advisory: Prime Minister Narendra Modi urged citizens to moderate fuel consumption and gold purchases, reflecting concern regarding dollar outflows.

    What are the broader macroeconomic implications of a worsening BoP deficit?

    1. Forex Reserve Depletion: Persistent BoP deficits force RBI to utilise foreign exchange reserves, reducing external buffers.
    2. Currency Pressure: Sustained dollar outflows may weaken the Indian Rupee, increasing imported inflation.
    3. Inflationary Impact: Higher oil import costs raise transportation and manufacturing expenses.
    4. External Vulnerability: Reduced capital inflows increase dependence on volatile external borrowing.
    5. Investor Sentiment: Weak BoP signals may affect foreign investor confidence and macroeconomic stability perceptions.

    Can India reduce structural vulnerability in its external sector?

    1. Export Diversification: Strengthens merchandise exports beyond traditional sectors.
    2. Manufacturing Expansion: Supports Make in India and production-linked incentives to reduce import dependence.
    3. Energy Transition: Accelerates renewable energy and domestic energy security to reduce oil import dependence.
    4. Financial Stability: Enhances resilience through stable FDI rather than volatile portfolio flows.
    5. Gold Monetisation: Encourages financialisation of savings through sovereign gold bonds and monetisation schemes.

    Conclusion

    RBI’s latest data highlights a growing imbalance in India’s external sector marked by widening dollar outflows, weakening foreign investments, and structural dependence on imported commodities. While India’s strong services exports continue to provide resilience, sustaining external stability will require export competitiveness, reduced import dependence, stable capital inflows, and prudent macroeconomic management.

    PYQ Relevance

    [UPSC 2019] How would the recent phenomena of protectionism and currency manipulations in world trade affect macroeconomic stability of India?

    Linkage: India’s worsening Balance of Payments (BoP) and rising dollar outflows directly affect macroeconomic stability, exchange rate management, foreign exchange reserves, and external vulnerability. The issue links external trade dynamics with rupee stability and capital flows.