The National Aeronautics and Space Administration has lost contact with its Mars orbiter Mars Atmosphere and Volatile Evolution (MAVEN), which has been studying the Red Planet’s atmosphere for over a decade.
About MAVEN Mission
Launch: by NASA
Launch site: Cape Canaveral, Florida
Mars orbit insertion: September 2014
Mission type: Mars orbiter
Primary objective: Study the loss of Mars atmosphere to space
Scientific Objectives
Measure the thin upper atmosphere of Mars
Study the ionosphere, which consists of charged particles
Observe interaction of sunlight and solar wind with the Martian atmosphere
Explain how Mars changed from a warm and wet planet to a cold and dry one
[2016] Consider the following statements: The Mangalyaan launched by ISRO:
1. is also called the Mars Orbiter Mission.
2. made India the second country to have a spacecraft orbit the Mars after USA.
3. made India the only country to be successful in making its spacecraft orbit the Mars in its very first attempt.
Which of the statements given above is/are correct?
(a) 1 only (b) 2 and 3 only (c) 1 and 3 only (d) 1, 2 and 3
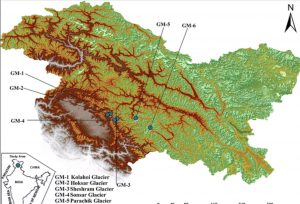
The higher reaches of Kashmir Valley witnessed snowfall and the plains received rain as Chillai-Kalan, the harshest 40 day winter phase, began on December 21, 2025.
What is Chillai Kalan
Meaning: Big cold in Kashmiri
Duration: 40 days
Period: December 21 to January 30
Significance: Coldest phase of winter in Kashmir
Belief: Rain or snow on the first day is considered a good omen and indicates heavy snowfall ahead
Importance of the Precipitation
Ended a prolonged dry spell in the Valley
Helped reduce dust and dryness
Expected to improve water availability and snow reserves
Dry winter last year had caused
Health issues like cough and cold
Problems for agriculture and tourism sector
Follow-Up Cold Phases
After Chillai Kalan, Kashmir experiences two shorter cold spells
Chillai Khurd meaning small cold
Chillai Bacha meaning baby cold
Prelims Pointers
Chillai Kalan is unique to Kashmir climate tradition
Heavy snowfall during this phase replenishes glaciers and water sources
Gulmarg and Sonamarg are key winter tourism centres
Sadhna Top is strategically important due to its proximity to the Line of Control
[2015] Consider the following statements:
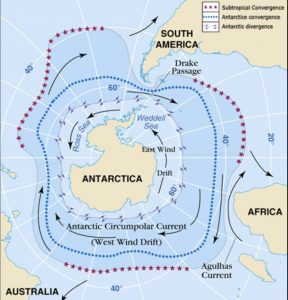
1. The winds which blow between 30° N and 60° S latitudes throughout the year are known as westerlies.
2. The moist air masses that cause winter rains in North-Western region of India are part of westerlies.
Which of the statements given above is/are correct?
(a) 1 only (b) 2 only (c) Both 1 and 2 (d) Neither 1 nor 2
Most aspirants don’t struggle because they lack effort. They struggle because they prepare too many things without a clear structure.
When I analysed years of UPSC papers, one pattern became very clear, UPSC doesn’t test subjects, it tests recurring themes.
That’s exactly why we built a microtheme-based preparation system.
In this session, I will explain how 288 carefully curated microthemes can help you prepare for UPSC 2027 in a focused, integrated, and sustainable way, without syllabus anxiety.
Prayas sir, Civilsdaily IAS
What I will cover (practical, no fluff):
1. Why subject-wise preparation eventually breaks down I will show you why finishing books doesn’t guarantee marks, and how microthemes align your preparation with what UPSC actually asks.
2. What these 288 microthemes really represent These are not random topics. They are distilled from PYQs and mapped across Prelims, Mains, and Current Affairs to reflect the real UPSC syllabus.
3. A clear 15-month roadmap for UPSC 2027 I will explain: • How to distribute microthemes month by month • When to integrate Prelims and Mains preparation • How to revise continuously without restarting • How to avoid burnout in long preparation cycles
4. How microthemes simplify current affairs preparation You will learn how a single issue can serve as: • Prelims facts • Mains arguments • Essay fodder all from one theme.
Why attend this session:
Serious UPSC 2027 aspirants
Aspirants confused about long term planning
Anyone tired of fragmented preparation and constant resets
You won’t walk away with vague motivation, you will walk away with a system.
It will be a 45 minute session, post which we will open up the floor for all kinds of queries which a beginner must have. No questions are taboo and Prayas sir is known to be patiently solving all your doubts.
Join us for a Zoom session on 23rd Dec at 5 PM. This session is a must attend for you If you are attempting UPSC for the first time or have attempted earlier and now preparing for 2027, then it is going to be a valuable session for you too.
See you in the session”
Register for the session for a complete in-depth UPSC Prep
(Don’t wait—the next webinar/session won’t be until End Dec’25)
These masterclasses are packed with value. They are conducted in private with a closed community. We rarely open these webinars for everyone for free. This time we are keeping it for 300 seats only.
[UPSC 2021] “If the last few decades were of Asian’s.” In the light of this statement, examine India’s influence in Africa in recent years.
Linkage: This question is directly relevant as it examines India’s expanding strategic, economic and diplomatic footprint in Africa. India’s recent focus on trade diversification, manufacturing partnerships, MSME integration, and multilateral engagement with Africa reflects its effort to align with Africa’s emerging role in the global economy.
Introduction
India-Africa economic relations have gained renewed momentum following high-level diplomatic engagements in 2025, including the Prime Minister’s visits to Namibia, Ghana, and Ethiopia. Africa’s recognition of India as a full-time G20 member and the African Union’s inclusion in the G20 framework have created institutional depth in bilateral ties. While cultural affinity and political solidarity have long defined the relationship, contemporary engagement is increasingly shaped by trade diversification, manufacturing cooperation, and services-led integration.
Why India-Africa Economic Engagement Matters Now
Export Diversification Imperative: Addresses India’s overdependence on the US and EU, which together accounted for nearly 40% of India’s exports in FY24 amid slowing growth and market volatility.
Trade Scale and Growth Potential: Bilateral trade stands close to USD 100 billion, positioning Africa as India’s fourth-largest trading partner.
Strategic Market Shift: Aligns India’s trade strategy with fast-growing African consumer markets and industrial demand.
Geopolitical Realignment: Reinforces South-South cooperation at a time of fragmentation in global economic governance.
Current Trade Structure and Limitations
Export Concentration: Indian exports to Africa in FY24 amounted to USD 38.17 billion, dominated by petroleum products, engineering goods, pharmaceuticals, rice, and textiles.
Import Dependence: Africa accounts for only around 6% of India’s total imports, indicating asymmetrical trade engagement.
Geographic Concentration: Nigeria, South Africa, and Tanzania remain the principal destinations, limiting regional diversification.
Comparative Disadvantage: China remains Africa’s largest trading partner with bilateral trade exceeding USD 200 billion, reflecting deeper industrial integration.
Shifting from Commodity Trade to Manufacturing Partnerships
Value-Added Manufacturing: Facilitates transition from low-value commodity exports to joint manufacturing and cross-border value chains.
Industrial Incentive Utilisation: Addresses underutilisation of incentives offered by African governments for manufacturing investments.
Preferential Market Access: Enables Indian firms to retain access to US markets through favourable African tariff regimes.
Consumer Demand Alignment: Captures Africa’s expanding consumer base and rising industrial demand beyond hydrocarbons.
Leveraging Regional Trade Frameworks
AfCFTA Integration: Expands market access through engagement with the African Continental Free Trade Area.
Regional Economic Communities: Strengthens India’s trade footprint across East, West, and Southern Africa.
Rules-Based Trade Expansion: Facilitates harmonisation of standards, customs procedures, and logistics networks.
MSMEs as Drivers of India-Africa Trade Expansion
Trade Finance Accessibility: Prioritises scaling up Lines of Credit and improving MSME access to export finance.
Risk Mitigation Instruments: Supports adoption of local currency trade and joint insurance pools to manage political and commercial risks.
Market Entry Enablement: Addresses policy gaps that limit MSME participation in African markets compared to Europe and the US.
Sustainable Trade Linkages: Strengthens long-term trade relations through MSME-led engagement.
Logistics, Connectivity, and Trade Facilitation
Freight and Port Modernisation: Reduces logistics costs through investments in port infrastructure and hinterland connectivity.
Trade Corridors: Supports development of India-Africa maritime corridors to streamline supply chains.
Cost Competitiveness: Enhances export viability by lowering transport and transaction costs.
Services Trade and Digital Integration
IT and Digital Services: Leverages India’s strengths in IT, digital trade, and health services.
Skill Development: Expands professional services exports through training and capacity-building initiatives.
People-to-People Linkages: Strengthens educational, health, and digital exchanges to deepen economic integration.
Strategic Investments: Strengthens Indian public sector presence in African manufacturing, mining, and mineral exploration.
Infrastructure Development: Supports renewable energy, agro-processing, and logistics infrastructure.
Risk Absorption Capacity: Enables public sector entities to navigate political and financial risks more effectively than private firms.
Investment Reorientation: Reduces overreliance on Mauritius-based investments aimed at tax optimisation.
Conclusion:
India’s engagement with Africa is transitioning from limited, commodity-driven exchanges to a structured, long-term economic partnership anchored in trade diversification, manufacturing collaboration, MSME participation, services integration, and infrastructure connectivity. As global supply chains realign and Africa’s growth prospects strengthen, a calibrated strategy combining private enterprise, public sector leadership, and multilateral frameworks can enable India to deepen its economic footprint while reinforcing South-South cooperation and strategic autonomy.
India’s fertiliser subsidy, the second-largest subsidy after food, has expanded rapidly due to rising global energy prices, import dependence, and skewed pricing policies. In 2024-25, the subsidy is estimated to touch nearly ₹2 lakh crore, with projections of ₹2.5 lakh crore in FY26. The article argues not for withdrawal, but for reorientation of subsidies to correct price signals, improve nutrient balance, and enhance productivity while protecting farmers’ incomes.
Why Fertiliser Subsidy Reform Is Back in Focus
Fiscal Expansion: Fertiliser subsidy projected at ~₹2.5 lakh crore in FY26, compared to ₹1.37 lakh crore allocated to agriculture and farmers’ welfare.
Policy Asymmetry: Urea prices remain fixed and among the cheapest globally, while DAP and MOP prices are decontrolled.
Macroeconomic Risk: Heavy import dependence, ~78% for natural gas, ~90% for phosphatic fertilisers, and near-total dependence for potash, exposes India to global commodity shocks.
Structural Distortion: Price controls undercut the Nutrient-Based Subsidy (NBS) regime introduced in 2010.
Reform Window: Stable growth and low inflation provide a favourable macroeconomic context for politically difficult reforms.
How Price Controls Have Distorted Nutrient Use
Urea Price Fixation: Urea sold at a fixed price of ~₹242 per 45-kg bag encourages excessive nitrogen use.
NBS Design Flaw: Subsidy linked to nutrient content for P and K, but not applied uniformly to urea.
Skewed Consumption: Farmers over-apply nitrogen while under-applying phosphorus and potassium.
N:P:K Ratio Collapse: National ratio deteriorated to ~10.9:4:1 against the recommended 4:2:1.
State-Level Distortion: Punjab applies ~61% more nitrogen than recommended, underuses potassium by ~89%, and phosphorus by ~8%.
What Data Reveal About Productivity Outcomes
China Comparison:
Fertiliser use: ~373 kg/ha (China) vs ~182 kg/ha (India).
N:P:K ratio: ~2.6:1.1:1 (China) vs ~10.9:4:1 (India).
Agri-GVA: ~$1.27 trillion (China) vs ~$0.63 trillion (India).
Land Productivity Gap: China generates double India’s agri-GVA despite similar cropped area.
Yield Plateauing: Excess nitrogen creates “lush green fields” but fails to increase yields or grain quality.
Soil Degradation: Imbalanced nutrient use reduces soil organic carbon and long-term productivity.
Why Nutrient Use Efficiency Remains Low
Low NUE Levels: Estimated at only 35-40%, indicating large nutrient losses.
Atmospheric Losses: Nitrogen escapes as nitrous oxide, a greenhouse gas ~278 times more potent than CO₂.
Water Pollution: Nitrate leaching contaminates groundwater, making it non-potable.
Diversion and Leakage: ~20-25% of subsidised urea diverted to non-agricultural uses or smuggled across borders.
Declining Response Ratio: Fertiliser-to-grain response ratio fell from ~1:10 (1970s) to ~1:2.7 (2015).
What Policy Design Lessons Emerge from China
Per-Unit Land Subsidy: Direct input subsidy on a per-mu basis rather than product-based price control.
Market-Determined Prices: Fertiliser prices allowed to reflect market conditions.
Innovation Incentives: Over 60% fertiliser consumption through complex fertilisers.
Gradual Price Decontrol: Phased dismantling of urea price controls.
Direct Income Support: Protects farmers through equivalent cash transfers.
NBS Recalibration: Reduce nitrogen subsidy while increasing support for phosphorus and potassium.
Micronutrient Promotion: Encourages customised blends and soluble fertilisers through fertigation.
Data Integration: Identification of tenant farmers using PM-KISAN data, land records, satellite imagery, and fertiliser sales.
What Are the Expected Gains from Reform
Fiscal Savings: Estimated annual savings of ~₹40,000 crore.
Resource Reallocation: Redirects funds toward agri-R&D, irrigation, and high-value agriculture.
Income Enhancement: Precision farming and balanced nutrients improve yield quality and farm profitability.
Environmental Protection: Reduces greenhouse emissions and groundwater contamination.
Growth Multiplier: Higher rural incomes stimulate demand for manufactured goods.
Conclusion
Reforming the fertiliser subsidy regime is not a question of fiscal retrenchment but of policy correction. By restoring price signals, improving nutrient balance, and protecting farmers through direct support, India can convert a distortionary subsidy into a productivity-enhancing instrument. The challenge is political, but the rewards are structural and long-term.
PYQ Relevance
[UPSC 2014] What are the different types of agriculture subsidies given to farmers at the national and at state levels? Critically analyse the agricultural subsidy regime with reference to the distortions created by it.
Linkage: The question is directly relevant as it focuses on agricultural subsidies and the distortions arising from their design, a core GS III issue. The article offers concrete evidence of how fertiliser price controls create nutrient imbalance, fiscal stress, and environmental damage, strengthening the critical analysis required in this question.
India recorded real GDP growth of over 8% in the recent quarter, even after adjusting for the post-COVID base effect. However, this growth has not translated into a revival of private capital expenditure (capex). Private investment as a share of GDP remains near 11-12%, significantly below earlier peaks. This divergence between output growth and investment momentum raises concerns regarding the sustainability and quality of economic expansion.
Why in the News?
India is witnessing a structural decoupling between GDP growth and private investment, a departure from historical growth cycles where investment led expansion. Despite low corporate leverage, improved profitability, and strong balance sheets, private firms are refraining from capacity expansion. Private capex as a share of GDP in 2023-24 stands at 11.5%, among the lowest since the early 2000s, even as overall GDP growth remains strong. This contradiction signals deeper constraints within the investment climate and demand structure.
Why Has Private Investment Stagnated Despite High GDP Growth?
Low Private Capex Share: Private investment remains around 11-12% of GDP, compared to over 15% during earlier growth phases, indicating limited contribution to growth momentum.
Historical Contrast: During the mid-2000s investment boom, private capex expanded alongside GDP, unlike the present phase where growth is consumption- and public-investment-driven.
Persistence of Trend: The stagnation has continued for over a decade, suggesting structural rather than cyclical causes.
How Do Existing Capacities Affect Investment Decisions?
Export Volatility: Weak global demand constrains export-led investment decisions.
Cautious Business Sentiment: Firms delay irreversible investments under uncertain macroeconomic conditions.
How Has Public Investment Substituted for Private Capex?
Public Capex Surge: Government capital expenditure has expanded rapidly, compensating for private investment weakness.
Crowding-In Limitations: Public capex has not yet generated sufficient downstream demand to trigger private investment.
Infrastructure-Led Growth Bias: Growth relies disproportionately on state-led infrastructure spending.
Why Has Investment Efficiency Declined?
ICOR Trends: Higher Incremental Capital Output Ratios indicate reduced efficiency of capital deployment.
Financialisation of Profits: Corporate profits increasingly channelled into financial investments rather than physical assets.
Shift in Corporate Strategy: Emphasis on balance sheet strength over expansion.
Conclusion
Sustained GDP growth without commensurate private investment reflects a fragile growth model. While public expenditure has stabilised economic momentum, long-term expansion depends on reviving private capex through demand certainty, capacity utilisation improvement, and investment confidence. Without this transition, growth risks remaining shallow and state-dependent.
PYQ Relevance
[UPSC 2020] Explain the meaning of investment in an economy in terms of capital formation. Discuss the factors to be considered while designing a concession agreement between a public entity and private entity.
Linkage: The question examines investment as capital formation. It directly aligns with the article’s focus on weak private GFCF despite strong GDP growth, highlighting the investment-growth disconnect.
The United States Army and United States Navy have successfully completed integrated testing of the Dark Eagle Long Range Hypersonic Weapon (LRHW) system.
About Dark Eagle Hypersonic Missile System
Hypersonic missile system developed for the United States Army • Non nuclear, ground-launched weapon system • Designed for strategic attack missions • Developed by Lockheed Martin and Northrop Grumman • Intended to penetrate Anti Access Area Denial (A2 AD) environments
Strategic Role
Suppresses long range enemy fires • Penetrates advanced missile defense systems • Delivers rapid, precise, and time critical strikes • Enhances conventional deterrence without nuclear escalation
Prelims Pointers
Country: United States • Type: Ground launched hypersonic weapon • Nuclear status: Non nuclear • Speed: Up to Mach 17 • Key component: Common Hypersonic Glide Body • Objective: Penetration of A2 AD defenses
[2022] Which one of the following statements best reflects the idea behind the “Fractional Orbital Bombardment System” often talked about in media?
(a) A hypersonic missile is launched into space to counter the asteroid approaching the Earth and explode it in space.
(b) A spacecraft lands on another planet after making several orbital motions.
(c) A missile is put into a stable orbit around the Earth and deorbits over a target on the Earth.
(d) A spacecraft moves along a comet with the same speed and places a probe on its surface.
![🔴[UPSC Webinar for 2027] By Prayas Sir, Civilsdaily IAS | Clear UPSC 2027 with 288 Microthemes | Get a 15 Month Strategy | Join on 23rd December at 5PM](https://d18x2uyjeekruj.cloudfront.net/wp-content/uploads/2025/12/PrayasT-1568x882.jpg)