💥Join UPSC 2027,2028 Mentorship (July Batch) + XFactor Notes & Microthemes PDF

Subject: “ClimatologyXMonsoon,ENSO,IOD”

  • Behind Europe’s heatwave, cliamte change the culprit

    Why in the News?

    A World Weather Attribution (WWA) study has confirmed climate change as the unequivocal cause of the ongoing European heatwave, which has broken or is forecast to break historic heat-stress records in 45% of 854 cities analysed. The finding sharpens a wider gap between the certainty climate science now offers and the declining political priority accorded to climate action.

    What does the WWA study establish about the causal role of climate change in the current heatwave?

    1. Unequivocal attribution: WWA found climate change, not the El Niño phenomenon or any other factor, responsible for the European heatwave.
    2. Recurrence pattern: This is the third severe heatwave to grip Europe in five years, after 2022 and 2023.
    3. Mortality scale: More than 1,300 excess deaths have been recorded since 21 June; over 1,00,000 people are estimated to have died from extreme heat across 2022 and 2023.
    4. Probability shift: Record-breaking night-time highs are nearly 100 times more likely now than in 2003; daytime peak temperatures are nearly 10 times more likely.
    5. Historical baseline broken: Temperature records being broken were set in 1976; the current daytime and overnight highs would have been virtually impossible to occur as recently as 1976.
    6. ENSO ruled out: The El Niño Southern Oscillation phase played no role in driving the heat during this spell.

    Why has climate attribution science become central to fixing responsibility for extreme weather events?

    1. Definition: Climate attribution is the scientific discipline that determines how much human-caused global warming influences the probability and intensity of specific extreme weather events. It quantifies how much worse or more likely a particular flood, heatwave, or drought has become compared to a hypothetical world without human-driven emissions
    2. Function: Attribution science tests the likelihood of a specific extreme weather event occurring if climate change were not taking place.
    3. Recency: The discipline has developed only over the last two decades.
    4. Speed gain: Assessments earlier took months or years; WWA’s methods now produce findings within days, even while an event is still ongoing.
    5. Purpose: The science removes ambiguity and fixes the exact extent of climate change’s responsibility for an event.
    6. Scientific caution without it: Scientists are otherwise wary of linking any individual extreme weather event to climate change without a dedicated attribution study.
    7. Policy intent: Beyond generating evidence, attribution studies are designed to force policymakers to act faster on climate change.

    Does scientific certainty on climate attribution translate into proportionate political action?

    1. Evidence-action gap: Scientific evidence on climate change is already voluminous and compelling, yet climate change has dropped down the list of global priorities.
    2. Political trigger: The decline has sharpened particularly after Donald Trump took office as US President.
    3. Forum evidence: Recent G7 meetings have carried little or no climate-related agenda or outcomes.
    4. Reversal of salience: Climate change was earlier among the most prominent items at international meetings involving influential leaders; this prominence has receded.
    5. Target abandonment: Scientists maintain the Paris Agreement targets of containing global temperature rise within 1.5°C to 2°C remain achievable, but governments treat them as effectively out of reach.
    6. Reframing of feasibility: Governments are treating the required resource mobilisation as politically impractical rather than scientifically unattainable.

    What risk does the global shift from mitigation to adaptation pose?

    1. Strategic shift: Countries are increasingly choosing to let climate change play out and to adapt to its impacts rather than prevent it.
    2. Scientific objection: Scientists routinely warn against adaptation as a substitute for mitigation.
    3. Inherent limits: Adaptation has limits beyond which impacts cannot be absorbed.
    4. Trend trajectory: Events such as the European heatwave are projected to increase in both frequency and intensity over coming years.
    5. Displacement, not resolution: The shift to adaptation transfers the climate risk from prevention to adaptation capacity rather than resolving it.

    Conclusion

    Climate attribution science has removed the scientific ambiguity once used to avoid linking individual extreme weather events to climate change. The European heatwave attribution exposes a widening gap between scientific certainty and political will, as global climate governance deprioritises mitigation. Countries are substituting adaptation for prevention despite scientists’ warnings that adaptation carries inherent limits. Closing this evidence-action gap is now central to achieving the Paris Agreement targets.

    PYQ Relevance

    [UPSC 2017] ‘Climate Change’ is a global problem. How India will be affected by climate change? How Himalayan and coastal states of India will be affected by climate change?

    Linkage: The PYQ xamines the impacts of climate change and the need for mitigation and adaptation strategies. The article uses the European heatwave as scientific evidence that climate change is intensifying extreme weather events and highlights the growing gap between climate science and political action.

  • In dry monsoon, a test of resilience

    Why in the News?

    India’s 2025 monsoon season is forecast to be the weakest in a decade, with 77% of the country’s land area already recording more than 20% rainfall deficit as of June 24. The season has exposed a structural tension: India’s agricultural and energy systems remain deeply dependent on monsoon rainfall. At the same time, the government’s own investments in renewables, rainwater harvesting, and rural employment infrastructure suggest the country may now be better placed to absorb the stress than in any previous deficit year.

    What Has Made the 2025 Deficit Structurally Different from Past Deficits?

    1. Scale of the deficit: As of June 24, 537 of 740 districts recorded over 20% rainfall deficit. Only eight of 36 States/UTs showed no deficiency. IMD forecast low to moderate rainfall across nearly half of India’s landmass.
    2. El Niño is not the primary cause: El Niño emerged in early June, too late to explain the June deficit because its impact on the Indian monsoon occurs with a lag. The dominant driver is the Madden Julian Oscillation (MJO).
    3. MJO as the proximate driver: A moving system of winds and clouds that alternately enhances or suppresses rainfall. In June, its rain-suppressing phase remained over India, with a shift expected in early July.
    4. June is ordinarily a high-rainfall month: IMD had forecast at least 92% of the Long Period Average (LPA) rainfall for June. The actual deficit of over 40% marks a significant departure from expectations.
    5. The La Niña lag: La Niña’s favourable impact on the Indian monsoon also occurs with a lag and was unlikely to influence June rainfall. This raises the possibility of a drier-than-expected monsoon season.

    What Is the Nature of India’s Dependence on the Monsoon and What Has Reduced It?

    1. The baseline dependence: The southwest monsoon provides nearly 75% of India’s annual rainfall. It supports irrigation, groundwater recharge, reservoirs, hydropower, agriculture, food security, rural incomes and economic growth.
    2. Infrastructure investments over a decade: India has expanded irrigation, rainwater harvesting, water storage and conservation. Official reports also show improving groundwater levels.
    3. Renewable energy as the decisive structural shift: Solar and wind power have reduced dependence on hydropower, which relies on reservoir storage. This helps preserve water for irrigation and drinking purposes.
    4. The residual dependence: Better resilience reduces stress but does not eliminate the need for planning and policy intervention.
    5. Rural employment as a demand buffer: MGNREGS has created water conservation and storage assets while providing income support to rural households during rainfall deficits, helping stabilise rural demand.

    What Existing Strengths Make Absorption of the 2025 Deficit Possible?

    1. Major reservoirs at good storage levels: Good rainfall over the last two years has kept reservoir storage comfortable, reducing immediate pressure on irrigation, drinking water and hydropower.
    2. Improvement in groundwater situation: Better groundwater levels provide an additional irrigation source where reservoir supplies become constrained.
    3. Renewable energy reducing reservoir pressure: Expansion of solar and wind power lowers dependence on hydropower, allowing reservoirs to conserve water despite weak monsoon inflows.
    4. Pre-monsoon rainfall altering farmer behaviour: Early forecasts encouraged many farmers to sow kharif crops using pre-monsoon showers, reducing exposure to the subsequent rainfall deficit.
    5. The limits of absorption: Resilience has improved but remains incomplete, requiring continued policy intervention.

    Where Does Resilience End and Vulnerability Begin? 

    1. The central tension: India has strengthened resilience, but climate change is making monsoon deficits more frequent, prolonged and unpredictable, testing existing adaptation measures.
    2. Quantitative unpredictability now exceeds planning assumptions: Climate change is making even good monsoon years less predictable, weakening the idea of a stable “normal monsoon.” The 2025 deficit could represent a recurring pattern rather than an exception.
    3. Hydropower remains a structural vulnerability: Solar and wind reduce dependence on hydropower but cannot replace it entirely. Reservoir shortages during weak monsoons can still affect electricity generation and grid stability.
    4. Agricultural productivity remains rainfall-sensitive: Investments in water conservation reduce drought impacts but cannot fully break agriculture’s dependence on monsoon performance, leaving food security vulnerable during prolonged deficits.
    5. Rural demand suppression risk persists: Poor monsoons lower farm incomes and rural demand. MGNREGS mitigates this impact but cannot fully offset a season-long rainfall deficit.

    What Must India Do That It Has Not Yet Done?

    1. The policy direction is defined: Developing greater climate resilience remains the only long-term solution, as monsoon behaviour cannot be controlled
    2. Quantitative rainfall forecasting must improve: More accurate district-level and sub-seasonal forecasts are essential for planning crop calendars, reservoir operations and water storage.
    3. The transition from input-side to output-side resilience: Investments in storage, groundwater recharge and renewables must translate into stable farm output, rural incomes and food prices during rainfall shocks.
    4. Climate adaptation must be recalibrated to current trajectories, not historical averages: Adaptation must continuously evolve because climate conditions are changing faster than the historical benchmarks used for planning.

    Conclusion

    India’s improved groundwater levels, major reservoir storage, and renewable energy capacity mean that a decade-worst monsoon need not produce a decade-worst crisis. However, the reduction in monsoon dependence is partial. Hydropower reliance persists, agricultural productivity remains rainfall-sensitive, and climate change is making deficits more frequent, longer, and harder to predict. Resilience built for last decade’s weather is already being outpaced by this decade’s climate.

    PYQ Relevance

    [UPSC 2023] Why is the South-West monsoon called ‘Purvaiya’ (easterly) in Bhojpur Region? How has this directional seasonal wind system influenced the cultural ethos of the region?

    Linkage: The PYQ tests understanding of the South-West Monsoon and its significance. The article moves beyond monsoon mechanics to examine how changing monsoon behaviour is reshaping India’s climate resilience.

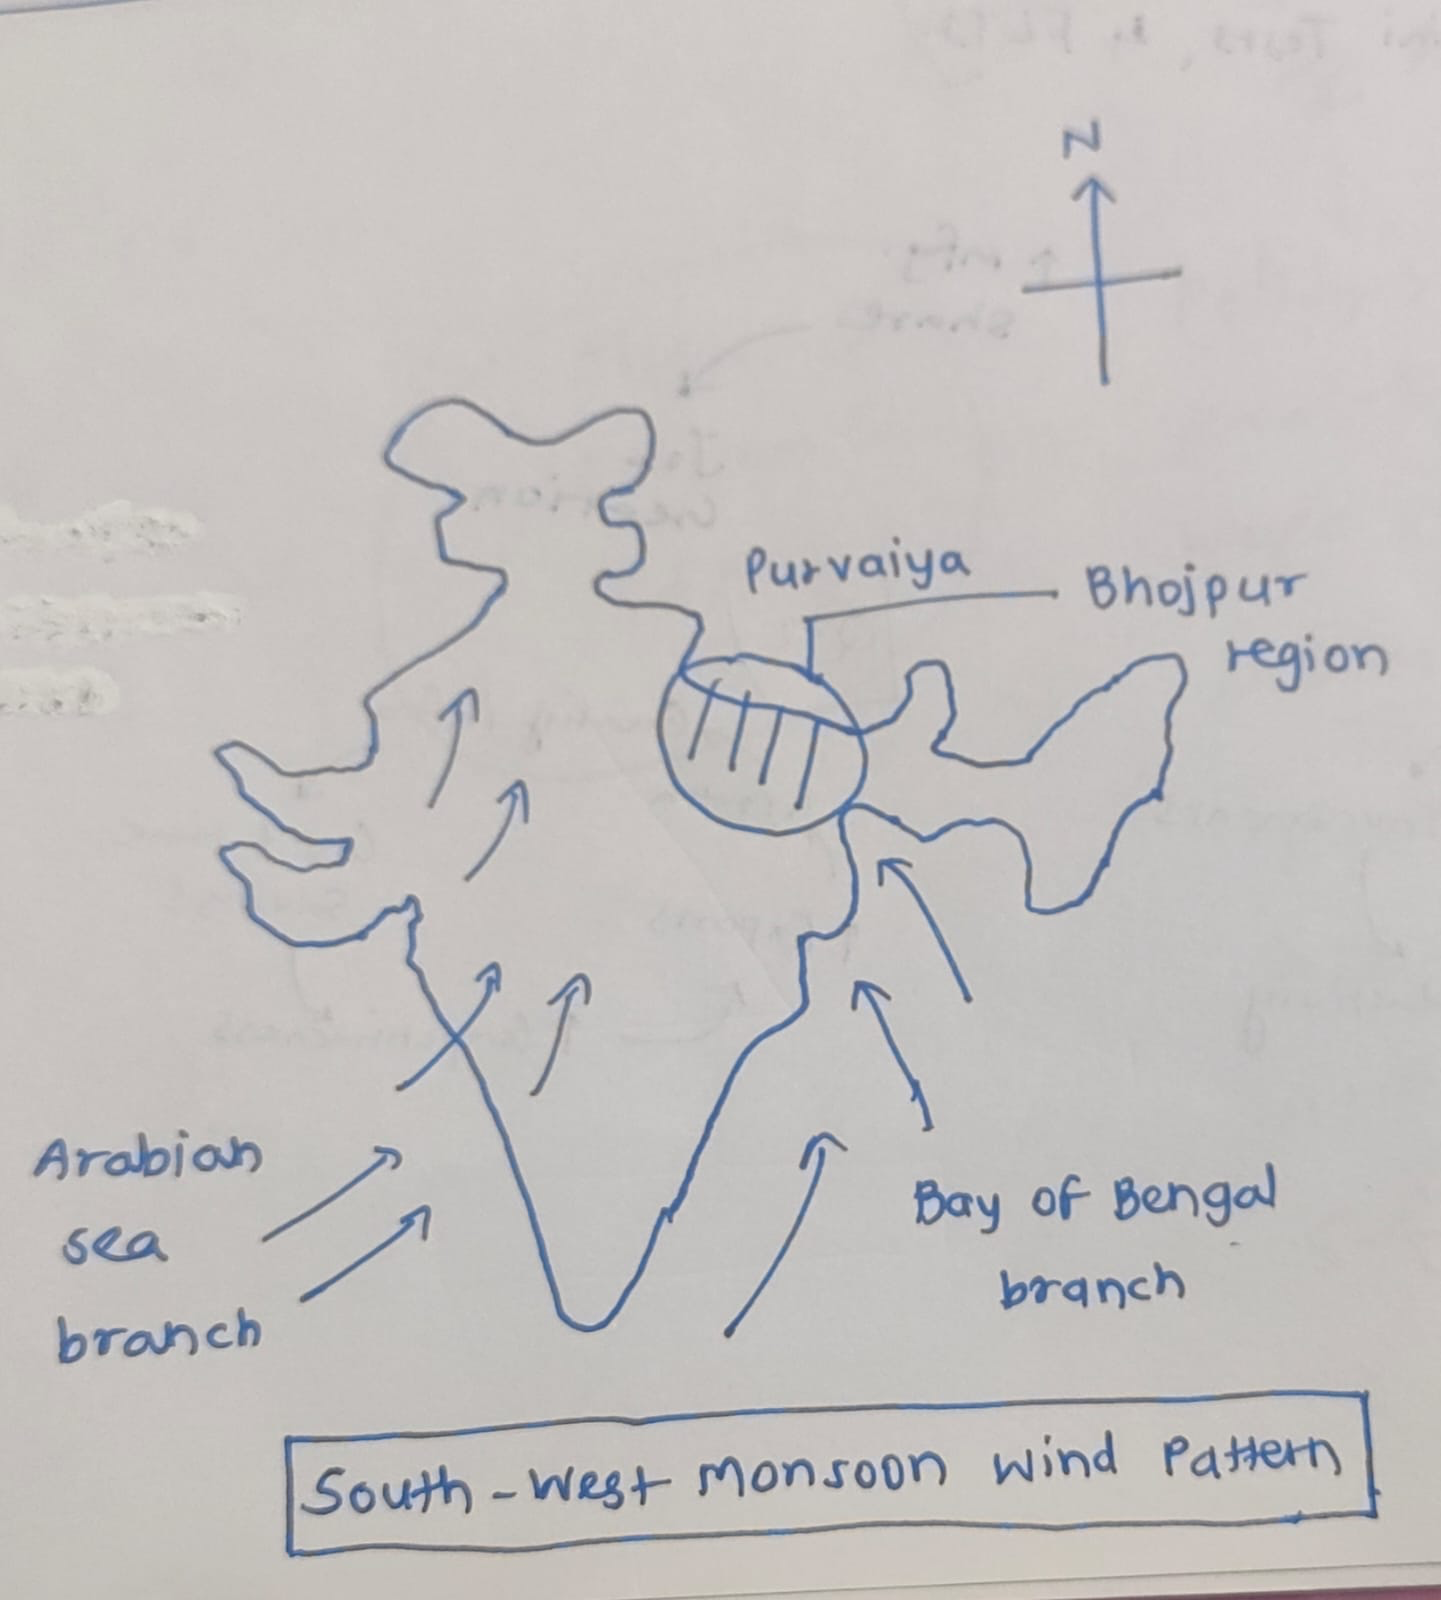
  • Why is the South-West monsoon called ‘Purvaiya’ (easterly) in Bhojpur Region? How has this directional seasonal wind system influenced the cultural ethos of the region?

    The Monsoon is a seasonal reversal of winds accompanied by corresponding changes in precipitation. In India, it brings nearly 75% of annual rainfall, shaping agrarian, ecological, and cultural life.

    Bay of Bengal Branch branch monsoon winds hit the Purvanchal Himalayas and are deflected westward into the Ganga Plains.

    Coriolis Effect and Meghalaya Plateau help “turn” the southwestern winds into a westward-flowing stream before they reach Bhojpur.

    For the Bhojpur region, the moisture-laden winds arrive from the East/South-East.

    In Bhojpuri, the suffix ‘-aiya’ denotes “originating from”. Thus, winds from the East are called Purvaiya

    Influence of ‘Purvaiya’ on cultural ethos of Bhojpur Region

    Agrarian calendar structuring – Sowing of paddy linked to arrival of Purvaiya.

    Agrarian deities and rituals – Prayers for timely Purvaiya winds. Eg- Indra worship during drought conditions.

    Folk songs and oral traditions – Eg- Purvaiya is personified in Kajri songs as a messenger of love and longing for women waiting for their husbands.

    Emotional-cultural symbolism – Rain as metaphor for longing and reunion. Eg- Bhojpuri cinema and poetry portraying Purvaiya romantically.

    Festivals of Fertility- Hariyali Teej and Nag Panchami celebrate the rejuvenation of the earth brought by the moisture-laden Purvaiya.

    Architectural adaptation – Sloped roofs and raised plinths designed for heavy rainfall. Also, eastern-facing verandahs (Dalan) to catch the cooling breeze.

    Culinary patterns – Seasonal foods linked to rainy months. Eg- Consumption of saag, pakoras, and millets during monsoon.

    Traditional “Madhubani painting” also depicts purvailya frequently.

    Thus, Purvaiya highlights the deep interlinkage between climate and culture in the Indo-Gangetic plains.

  • Consider the following statements

    Consider the following statements:
    1. The duration of the monsoon decreases from southern India to northern India.
    2. The amount of annual rainfall in the northern plains of India decreases from east to west.
    Which of the statements given above is / are correct?

  • India’s Monsoon Deficit and Super El Niño Concerns

    Why in News?

    India’s southwest monsoon rainfall deficit widened to 35%, with Central India recording a 61% deficit, as the monsoon stalled before reaching Mumbai. The Centre has placed around 150 to 200 districts under priority monitoring and directed States to prepare crop-wise contingency plans.

    Key Highlights

    • All-India rainfall deficit: 35%.
    • Regional deficits: Northwest India: +5%, East & Northeast India: -43%, Central India: -61%, and Southern Peninsula: -14%
    • Monsoon reached Kerala on 4 June, but its advance weakened near Mumbai.
    • Around 150 to 200 districts under priority monitoring.
    • Government encouraging a shift towards cotton and pulses.
    • Reservoir storage stood at 30.4% of capacity, compared to 25.1% average during previous El Niño years.

    Why has the Monsoon Stalled?

    • Anticyclonic circulation north of Mumbai blocked monsoon progression.
    • Influence of mid-latitude westerly systems.
    • Madden-Julian Oscillation (MJO) is currently in an unfavourable phase.
    • Next monsoon pulse may strengthen with a low-pressure system over the Bay of Bengal.

    El Niño Concerns

    • El Niño: Periodic warming of the central and eastern Pacific Ocean that generally suppresses the Indian monsoon.
    • U.S. National Oceanic and Atmospheric Administration (NOAA): Issued El Niño advisory on 11 June. 63% probability of a very strong El Niño by winter.
    • World Meteorological Organization (WMO): 80% probability of El Niño developing between June and August.
    • India Meteorological Department (IMD):
      • Seasonal rainfall forecast revised from 92% to 90% of the Long Period Average (LPA).
      • Assigned a 60% probability of a deficient monsoon, the most pessimistic pre-season forecast since 2015.
      • No positive Indian Ocean Dipole (IOD) expected to offset El Niño effects.

    Significance

    • Threatens kharif sowing and agricultural output.
    • May increase food inflation and rural distress.
    • Necessitates timely contingency planning and climate-resilient agriculture.
    • Highlights the need for improved water management and drought preparedness.

    Value Addition

    • Long Period Average (LPA): Average rainfall during 1971-2020, used as the benchmark for monsoon forecasts.
    • Madden-Julian Oscillation (MJO): Eastward-moving atmospheric disturbance influencing monsoon activity.
    • Indian Ocean Dipole (IOD): Difference in sea surface temperatures between the western and eastern Indian Ocean that can influence Indian monsoon rainfall.

    [2017] With reference to ‘Indian Ocean Dipole (IOD)’ sometimes mentioned in the news while forecasting Indian monsoon, which of the following statements is/are correct?
    1. IOD phenomenon is characterised by a difference in sea surface temperature between tropical Western Indian Ocean and tropical Eastern Pacific Ocean.
    2. An IOD phenomenon can influence an El Nino’s impact on the monsoon.
    Select the correct answer using the code given below:

    [A] 1 only

    [B] 2 only

    [C] Both 1 and 2

    [D] Neither 1 nor 2

  • ‘Super El Niño’ forms in Pacific: Why 2027 is likely to be the hottest year on record

    Why in the News?

    The emergence of Super El Niño conditions in the equatorial Pacific Ocean has become a major concern because it coincides with India’s crucial southwest monsoon season. The India Meteorological Department (IMD) has officially confirmed the development of El Niño and warned that it is expected to strengthen further during the monsoon months. This

    How Has El Niño Developed During the Current Monsoon Season?

    1. IMD Confirmation: El Niño conditions have officially emerged in the equatorial Pacific Ocean.
    2. Strengthening Trend: IMD expects the phenomenon to intensify further during the ongoing southwest monsoon season.
    3. NOAA Assessment: The US National Oceanic and Atmospheric Administration (NOAA) earlier confirmed El Niño emergence.
    4. Peak Projection: NOAA projects the event to peak during November-January.
    5. Intensity Forecast: The event may approach the “very strong” category.

    ENSO Threshold

    1. Niño 3.4 Region: El Niño is declared when sea surface temperature anomalies exceed +0.5°C in the Niño 3.4 region.
      1. The Niño 3.4 region (5°N-5°S, 170°W-120°W) is the primary equatorial Pacific area used by scientists to monitor, define, and predict the El Niño-Southern Oscillation (ENSO). 
    2. Current Reading: Weekly Niño 3.4 Index reached +0.7°C.
    3. Eastern Pacific Warming: Temperature anomalies reached +2.1°C in the easternmost Pacific region.

    What Makes the Current El Niño Different from Previous Events?

    Emerging “Super El Niño” Concerns

    1. NOAA Forecast: El Niño has officially formed in the tropical Pacific Ocean and is likely to strengthen significantly in the coming months.
    2. Historical Significance: Scientists have projected that the current event could rank among the strongest El Niño episodes recorded since 1950.
    3. Probability Estimate: NOAA estimates a 63% probability that the event will intensify into one of the largest El Niño events in the historical record.
    4. Transition Phase: The current event follows the end of La Niña conditions earlier in 2026.
    5. Global Warning: The UN Secretary-General António Guterres has described the phenomenon as an “urgent climate warning.”

    Why is it Being Called a “Super El Niño”?

    1. Exceptional Ocean Warming: Unusually warm Pacific Ocean temperatures are accelerating ENSO development.
    2. Early Intensification: Forecast models indicate stronger warming developing earlier than normally expected.
    3. Historical Comparison: Scientists have compared the event to major El Niño episodes such as 1982-83, 1997-98 and 2015-16.
    4. Global Temperature Impact: Multiple climate models suggest that 2027 could become the hottest year ever recorded globally.

    What is ENSO and How Does It Operate?

    El Niño-Southern Oscillation (ENSO)

    1. Climate Oscillation: Naturally occurring ocean-atmosphere phenomenon over the central and eastern equatorial Pacific Ocean.
    2. Recurrence: Appears every 2-7 years.
    3. Phases: El Niño, Neutral, and La Niña.

    El Niño

    1. Oceanic Condition: The abnormal warming of surface waters in the central and eastern tropical Pacific Ocean.
    2. Mechanism: Trade winds weaken, allowing warm water to push east toward South America.
    3. Indian Impact: Usually suppresses monsoon rainfall.

    La Niña

    1. Oceanic Condition: The abnormal cooling of surface waters in the central and eastern tropical Pacific Ocean.
    2. Mechanism: Trade winds strengthen, pushing warm water toward Asia and pulling cold water up to the surface off South America.
    3. Indian Impact: Generally supports stronger monsoon rainfall.

    Why Could 2027 Become the Hottest Year on Record?

    Interaction Between El Niño and Global Warming

    1. Natural Climate Driver: El Niño releases large amounts of heat from the Pacific Ocean into the atmosphere.
    2. Anthropogenic Warming: Human-induced greenhouse gas emissions have already raised baseline global temperatures.
    3. Compounding Effect: El Niño adds temporary warming on top of long-term climate change trends.
    4. WMO Forecast: Above-average global temperatures are expected between June and August, with effects continuing through November.

    Climate Consequences

    1. Temperature Extremes: Higher likelihood of record-breaking temperatures globally.
    2. Heatwaves: Increased frequency and intensity across multiple continents.
    3. Hydrological Extremes: Simultaneous occurrence of droughts and floods in different regions.
    4. Wildfire Risk: Elevated probability of large-scale forest fires in drought-prone regions.

    Why Does the Impact of El Niño Differ Across Regions?

    Not Every El Niño Produces the Same Outcomes

    1. Climate Variability: Every El Niño develops differently in terms of intensity, timing and ocean-atmosphere interaction.
    2. NOAA Observation: Each El Niño leaves a unique climatic imprint on global weather systems.
    3. Regional Factors: Local ocean temperatures, atmospheric circulation and other climate oscillations influence outcomes.

    Importance of Forecasting

    1. Advanced Monitoring: Improved ocean observation systems enhance prediction capabilities.
    2. Early Warning Systems: Better forecasting enables governments to prepare for disasters and agricultural losses.
    3. Climate Preparedness: Supports adaptation planning and resource allocation.

    How Could Super El Niño Reshape Global Weather Patterns?

    North America

    1. Atlantic Hurricane Suppression: Reduced hurricane activity in the Atlantic Ocean.
    2. Pacific Hurricane Intensification: Increased cyclone activity over the Pacific.
    3. US Winter Impact: Southern United States may experience wetter conditions and flooding.
    4. Pacific Northwest: Warmer and drier weather expected.

    South America

    1. Flood Risk: Northern Peru and southern Ecuador face heightened flooding threats.
    2. Heavy Rainfall: Western South America may experience excessive precipitation.
    3. Temperature Rise: Greater likelihood of unusually warm summers.

    East and Northeast Africa

    1. Weather Whiplash: Rapid shifts between drought and extreme rainfall.
    2. Flood Hazards: Increased flood risk in vulnerable regions.
    3. Agricultural Stress: High uncertainty for rain-fed agriculture.

    India

    1. Monsoon Deficit: Higher probability of below-normal rainfall.
    2. Heatwaves: Greater frequency and intensity.
    3. Agricultural Losses: Increased stress on kharif crops and water resources.

    Indonesia and Vietnam

    1. Drought Risk: Rainfall shortages may affect major rice-producing regions.
    2. Food Security Concerns: Potential reduction in agricultural output.

    Australia

    1. Heatwaves: Higher temperature anomalies.
    2. Wildfires: Elevated bushfire risk.
    3. Drought Conditions: Reduced precipitation in several regions.

    Why Does El Niño Affect India’s Southwest Monsoon?

    1. Walker Circulation Shift: Alters atmospheric circulation responsible for moisture transport.
    2. Reduced Moisture Transport: Weakens monsoon winds reaching the Indian subcontinent.
    3. Rainfall Deficiency: Leads to below-normal precipitation across large parts of India.
    4. Temperature Rise: Reduced cloud cover increases surface temperatures.

    IMD Forecast

    1. Seasonal Deficit: Rainfall expected to be 10% below normal.
    2. Spatial Distribution: Most regions likely to receive below-normal rainfall.
    3. Exception: Northeastern India expected to receive relatively normal rainfall.

    How Do Rainfall Patterns Change During El Niño Years?

    Regional Variability

    1. Northeastern India: Often receives normal rainfall.
    2. Extreme Southern India: May receive near-normal rainfall.
    3. Rest of India: Usually experiences rainfall deficits.

    Temperature Effects

    1. Heat Intensification: Reduced rainfall contributes to rising temperatures.
    2. Extended Heat Conditions: Higher risk of heatwaves and moisture stress.

    What Role Does the Indian Ocean Dipole (IOD) Play?

    Indian Ocean Dipole (IOD)

    1. Definition: Difference in sea surface temperatures between western and eastern Indian Ocean.
    2. Phases: Positive, Neutral, Negative.

    Current Status

    1. Neutral Phase: Expected to remain neutral during the southwest monsoon.
    2. 2026 Outlook: Neutral conditions expected to continue for most of the year.

    Significance

    1. Monsoon Modulator: Positive IOD can sometimes offset El Niño-induced monsoon weakness.
    2. Current Concern: Neutral IOD may not provide compensatory support.

    What Oceanic Changes Are Being Observed Around India?

    Bay of Bengal Warming

    1. Temperature Increase: Significant positive sea surface temperature anomalies observed.
    2. Impact: Supports atmospheric instability and temperature rise.

    Arabian Sea Warming

    1. Above-Normal Temperatures: Positive SST anomalies recorded.
    2. Climate Consequence: Enhances extreme weather variability.

    Eastern Indian Ocean

    1. Widespread Warming: Above-normal SST conditions observed during May

    How Could Super El Niño Trigger a Global Food Security Crisis?

    Agricultural Disruptions

    1. Crop Vulnerability: Maize, rice and several staple crops are highly sensitive to drought conditions.
    2. Production Risks: Major agricultural regions may experience reduced productivity.
    3. Market Volatility: Supply shocks can increase global food prices.

    Countries at Risk

    1. India: Rainfed agriculture vulnerable to monsoon deficits.
    2. South Africa: Drought threatens maize production.
    3. Indonesia: Rice production risks increase.
    4. Vietnam: Potential impacts on rice exports.
    5. Brazil: Rainfall variability may affect agricultural output.

    Global Consequences

    1. Food Inflation: Rising prices of cereals and food commodities.
    2. Supply Chain Disruptions: Agricultural trade flows may be affected.
    3. Livelihood Risks: Farmers and vulnerable populations face income losses.

    Why Is El Niño a Concern for India’s Economy and Agriculture?

    1. Agriculture
      1. Crop Stress: Reduces soil moisture availability.
      2. Rainfed Farming: Increases vulnerability of kharif crops.
      3. Yield Losses: Impacts rice, pulses, oilseeds, and coarse cereals.
    2. Water Security
      1. Reservoir Recharge: Limits replenishment of water bodies.
      2. Groundwater Stress: Increases extraction pressures.
    3. Inflation
      1. Food Prices: Reduced agricultural output may trigger food inflation.
      2. Supply Constraints: Affect agricultural supply chains.
    4. Energy
      1. Power Demand: Rising temperatures increase cooling requirements.
      2. Hydropower: Lower reservoir levels affect generation capacity.

    What Lessons Can Be Drawn from the 2015-16 Super El Niño?

    India’s Experience

    1. Rainfall Deficit: India received only 86% of Long Period Average (LPA) rainfall.
    2. Agricultural Stress: Several states experienced drought-like conditions.
    3. Water Scarcity: Reservoir levels and groundwater recharge declined.

    Key Lesson

    1. ENSO Alone is Not Deterministic: Strong El Niño events do not always produce identical outcomes.
    2. Role of Other Drivers: Indian Ocean Dipole (IOD), Madden-Julian Oscillation (MJO), Eurasian snow cover and regional ocean temperatures also influence monsoon performance.

    Conclusion

    The emerging El Niño highlights the growing interaction between natural climate variability and global warming. With risks of weaker monsoons, heatwaves, food insecurity and extreme weather events, India must strengthen climate-resilient agriculture, early warning systems, water management and disaster preparedness to reduce vulnerability and build long-term resilience.

    Value Addition

    YearCharacteristicsGlobal Impact
    1982-83One of strongest recordedDroughts, floods, crop losses
    1997-98Extreme warmingMajor global weather disruptions
    2015-16Strongest of recent decadesGlobal temperature records broken
    2026-27*Potential Super El NiñoRisk of hottest year in recorded history

    Positive vs Negative IOD

    Positive IODNegative IOD
    Warmer western Indian OceanWarmer eastern Indian Ocean
    Supports Indian monsoonWeakens monsoon
    Can offset El Niño impactCan worsen El Niño impact

    PYQ Relevance

    [UPSC 2015] How far do you agree that the behavior of the Indian monsoon has been changing due to humanizing landscapes? Discuss.

    Linkage: The PYQ examines changing monsoon patterns and the factors affecting rainfall variability in India. The article discusses how the emerging Super El Niño could weaken the southwest monsoon, alter rainfall distribution, intensify heatwaves and interact with climate change to reshape India’s monsoon behaviour.

  • La Nina is suspected to have caused recent floods in Australia. How is La Nina different from EI Nino

    La Nina is suspected to have caused recent floods in Australia. How is La Nina different from EI Nino?
    1. La Nina is characterized by unusually cold ocean temperature in the equatorial Indian ocean whereas EI Nino is characterized by unusually warm ocean temperature in the equatorial Pacific Ocean.
    2. EI Nino has an adverse effect on the southwest monsoon of India, but La Nina has no effect on monsoon climate.
    Which of the statements given above is/are correct?