💥Mains Ready By December. Smash Mains & Smash PYQ Admissions Open

Subject: Economics

  • Parliament passes Carriage of Goods by Sea Bill, 2025

    Why in the News?

    Parliament has passed the Carriage of Goods by Sea Bill, 2025, replacing the nearly century-old Indian Carriage of Goods by Sea Act, 1925.

    About Carriage of Goods by Sea Bill, 2025:

    • Replaces: The colonial-era Indian Carriage of Goods by Sea Act, 1925.
    • Purpose: Regulates the rights, duties, liabilities, and immunities of parties involved in shipping goods by sea from Indian ports to domestic or international destinations.
    • International Alignment: Retains consistency with the Hague Rules (1924), which also formed the basis of the 1925 Act.
    • Objective: Modernises maritime law in line with global standards and boosts India’s ease of doing business in the maritime sector.

    Key Features:

    • Bills of Lading Defined: It outlines the details of the shipment, including the type and quantity of goods, the origin and destination, and the terms of the agreement between the shipper and the carrier.
      • Includes details on goods’ type, quantity, condition, and destination.
      • Serves as a legally binding contract between the shipper and carrier.
    • Central Government Powers:
      • May issue directions for implementation.
      • Can amend the Schedule of Rules related to bills of lading.
    • Part of Broader Maritime Reforms:
      • Supports port development and coastal trade.
      • Encourages creation of State Maritime Boards and a Maritime State Development Council.
      • Covers port safety, disaster response, pollution control, and dispute resolution.
    • Global Compliance: Aligns India’s shipping laws with evolving international conventions and practices.
    [UPSC 2016] The term ‘import cover’, sometimes seen in the news, refers to

    (a) It is the ratio of value of imports to the Gross Domestic Product of a country

    (b) It is the total value of imports of a country in a year

    (c) It is the ratio between the value of exports and that of imports between two countries

    (d) It is the number of months of imports that could be paid for by a country’s international reserves*


  • Asset Under Management (AUM)

    Why in the News?

    India’s Mutual Fund (MF) industry has witnessed exponential growth, with Assets Under Management (AUM) reaching ₹74.40 lakh crore as of June 2025, a sevenfold increase over the past decade.

    What are Assets Under Management (AUM)?

    • Definition: AUM refers to the total market value of financial assets (stocks, bonds, etc.) managed by an investment firm on behalf of clients.
    • Growth Drivers:
      • Net investor inflows and redemptions
      • Market performance
      • Dividend reinvestments
    • Importance:
      • Indicates fund size, investor confidence, and fund stability
      • Reflects fund manager performance and popularity
      • Higher AUM allows better liquidity and portfolio diversification
      • Impacts management fees and minimum investment limits

    What is a Mutual Fund?

    • Definition: A mutual fund pools money from multiple investors to invest in a diversified portfolio.
    • Management: Handled by professional fund managers to balance risk and return.
    • Unit-Based Investment: Investors purchase fund units; each unit’s value is called the Net Asset Value (NAV), which changes with market movement.

    Classification of Mutual Funds

    a. Based on Asset Class:

    1. Equity Funds: Invest in stocks; includes large-cap, mid-cap, and small-cap funds.
    2. Debt Funds: Invest in bonds and other fixed-income instruments.
    3. Hybrid Funds: Mix of equity and debt for balanced risk-return.

    b. Based on Investment Objective:

    1. Growth Funds: Focus on capital appreciation; suitable for long-term investors.
    2. Income Funds: Aim for regular income via bonds/dividends.
    3. Liquid Funds: Invest in short-term debt; low risk and high liquidity.
    4. Tax-saving Funds (Equity Linked Savings Scheme): Offer Section 80C tax benefits; equity-focused.
    5. Pension Funds: Meant for retirement; long-term return-focused.

    c. Based on Structure:

    1. Open-ended Funds: Investors can enter or exit anytime; highly liquid.
    2. Closed-ended Funds: Fixed maturity; investments only during the initial offer period.
    3. Interval Funds: Allow purchase/redemption only at specific intervals.


    [UPSC 2025] Consider the following statements:

    I. India accounts for a very large portion of all equity option contracts traded globally, thus exhibiting a great boom. II. India’s stock market has grown rapidly in the recent past, even overtaking Hong Kong’s at some point in time. III. There is no regulatory body either to warn small investors about the risks of options trading or to act on unregistered financial advisors in this regard.

    Which of the statements given above are correct?

    Options:  (a) I and II only * (b) II and III only (c) I and III only (d) I, II and III


  • [pib] India Electric Mobility Index (IEMI)

    Why in the News?

    To support India’s net-zero transport goal by 2070, NITI Aayog launched the India Electric Mobility Index (IEMI) to track and rank States/UTs on their shift to electric mobility.

    [pib] India Electric Mobility Index (IEMI)

    About India Electric Mobility Index (IEMI):

    • Launched by: NITI Aayog in 2024.
    • Purpose: To evaluate and benchmark the progress of Indian States and Union Territories (UTs) in achieving their electric mobility and transport decarbonization goals.
    • Scoring: States and UTs are scored out of 100 using 16 indicators grouped under 3 core themes.
    • Core Themes:
      1. Transport Electrification Progress – Measures EV adoption across segments (2W, 3W, 4W, buses, etc.)
      2. Charging Infrastructure Readiness – Assesses public charging station density, coverage, and policy support.
      3. EV Research & Innovation Status – Tracks EV startups, R&D activity, patents, and skilling efforts.
    • Significance:
      • Supports tailored policymaking and cross-learning.
      • Enables transparency and healthy competition among states.
      • Aligns with India’s net-zero emissions target by 2070.
    • Methodology: Based on VAHAN data, charging infrastructure maps, and stakeholder consultations.
    • Accessibility: Publicly available dashboard and report for rankings, scores, and methodology.

    Key Highlights (2024 Edition):

    • Top Performers: Delhi, Maharashtra, and Chandigarh lead overall in EV readiness.
    • Category Leaders:
      • Transport Electrification: Delhi and Maharashtra.
      • Charging Infrastructure: Karnataka, Haryana, Himachal Pradesh, Ladakh.
      • Research & Innovation: Delhi, Tamil Nadu, Maharashtra, Karnataka, Telangana, Haryana.
    • EV Policy Status: 29 States/UTs have formal EV policies; 4 are in the draft stage.
    • EV Adoption Data:
      • EVs make up 5.3% of private vehicle sales in 2024.
      • Over 12 lakh EVs registered in India during the year.
    • Public Charging Network: India has over 25,000 public EV charging stations.
    • State Categories:
      • Performers: Karnataka, Tamil Nadu, Uttar Pradesh, Chhattisgarh, Odisha, Haryana, Goa.
      • Aspirants: Punjab, Rajasthan, Telangana, Andhra Pradesh, Assam, Bihar, Kerala, North-East states.
    [UPSC 2024] Which one of the following is the exhaust pipe emission from Fuel Cell Electric Vehicles powered by hydrogen?

    Options: (a) Hydrogen peroxide (b) Hydronium (c) Oxygen (d) Water vapour*


  • Sawalkote Hydro Project

    Why in the News?

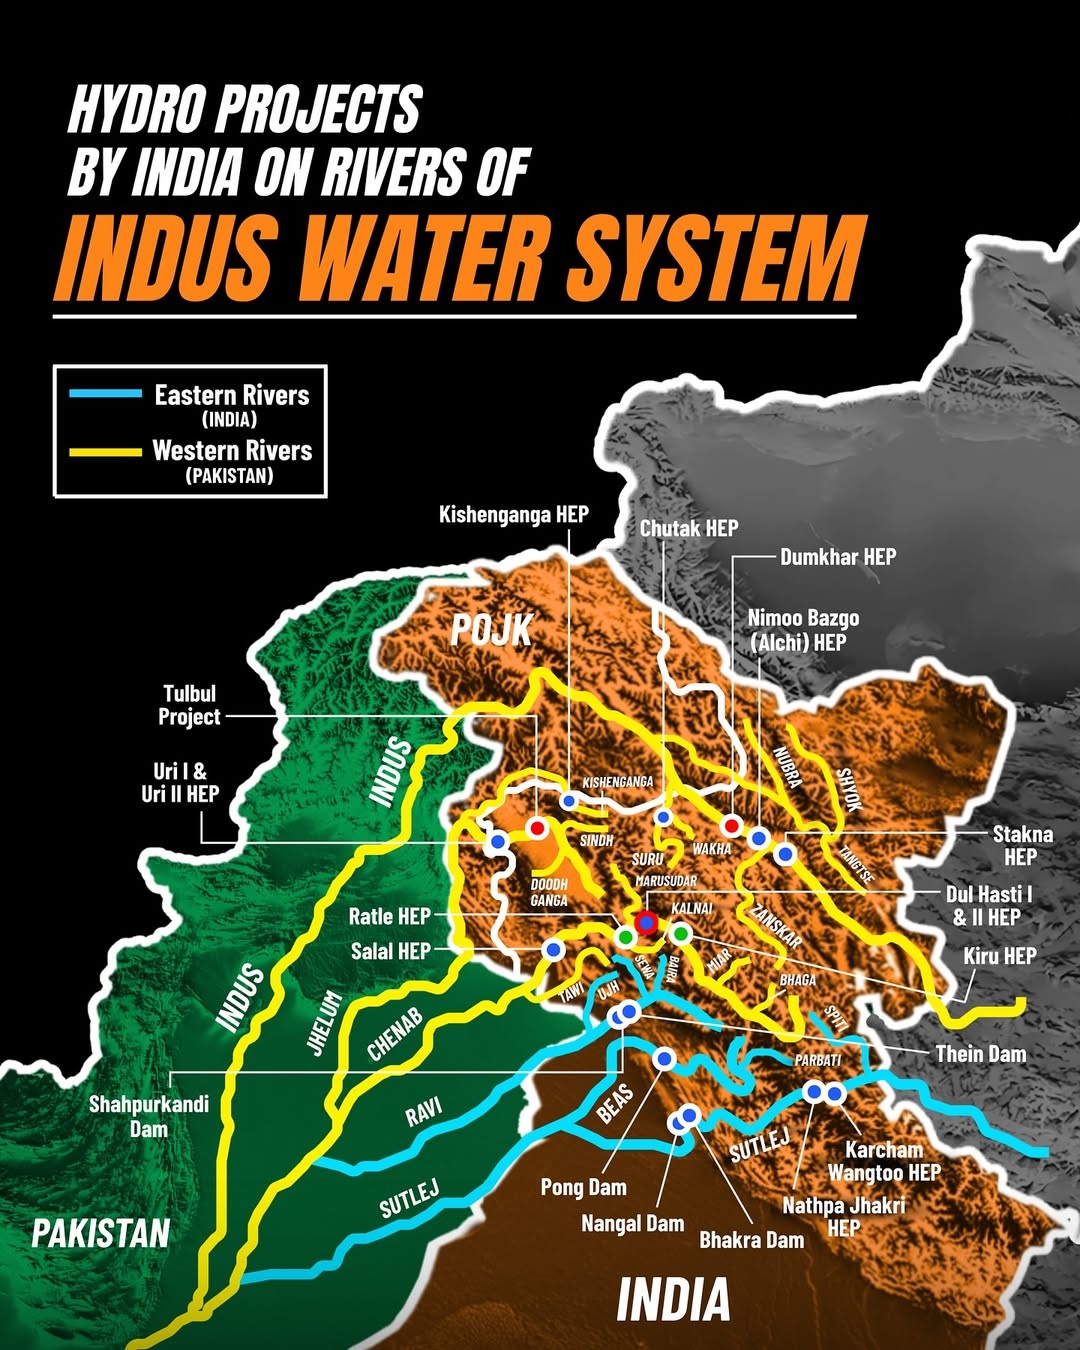
    After suspending the Indus Waters Treaty, India is asserting water control in J&K by reviving the Sawalkote Hydroelectric Project — the UT’s largest planned hydro project.

    Sawalkote Hydro Project

    About Sawalkote Hydro Project:

    • Location: Ramban and Udhampur districts, Jammu and Kashmir.
    • River: Built on the Chenab River (a western river under the Indus Waters Treaty).
    • Agency: Implemented by National Hydroelectric Power Corporation.
    • History: Proposed in the 1960s; delayed due to Pakistan’s objections, environmental issues, and red tape. Revived after India suspended the Indus Waters Treaty post the April 2025 Pahalgam terror attack.
    • Status (2025): Forest clearance granted; tenders floated on 29 July 2025; declared a project of national importance.
    • Timeline: 96 months post-clearance; expected commissioning by or after 2032.

    Key Features:

    • Type: Run-of-the-river (utilizes the natural flow and elevation drop of a river) hydroelectric project.
    • Capacity: 1,856 Megawatts (8 × 225 MW + 1 × 56 MW).
    • Dam: 192.5 m high, roller-compacted concrete gravity dam; reservoir holds 550 million cubic meters.
    • Powerhouse: Underground, with Francis turbines.
    • Cost: ₹22,704.8 crore (~2.6 billion United States Dollars).
    [UPSC 2009] Gandhi Sagar Dam is a part of which one of the following?

    Options: (a) Chambal Project * (b) Kosi Project (c) Damodar Valley Project (d) Bhakra Nangal Project


  • [1st August 2025] The Hindu Op-ed: Why the world needs better green technologies

    PYQ Relevance:

    [UPSC 2024] The world is facing an acute shortage of clean and safe freshwater. What are the alternative technologies which can solve this crisis? Briefly discuss any three such technologies citing their key merits and demerits.

    Linkage: This question directly related to “alternative technologies” to address a critical global environmental and resource crisis (freshwater scarcity). This aligns with the broader theme that the world needs better and diverse green technologies to tackle urgent environmental problems and ensure resource self-sufficiency, as emphasized in the context of energy innovation.


    Mentor’s Comment: As the push for sustainable energy intensifies, concerns are rising over the efficiency limits of widely used silicon photovoltaics. With the growing need for green hydrogen and land constraints, experts are questioning whether next-gen solar technologies offer better solutions. India must invest in efficient, diverse, and scalable innovations to meet climate goals and ensure energy self-sufficiency.

    Today’s editorial analyses the concerns that are rising over the efficiency limits of widely used silicon photovoltaics. This topic is important for GS Paper III (Environment) in the UPSC mains exam.

    _

    Let’s learn!

    Why in the News?

    Recently, as the global need for clean energy has increased and countries aim to fulfill their climate promises, silicon solar panels have become the most popular choice, changing the look of places from city rooftops to large solar farms in villages.

    What limits silicon photovoltaics in meeting India’s climate goals?

    • Low Energy Efficiency: Silicon solar panels have an in-field efficiency of only 15–18%, meaning a significant portion of solar energy is not converted into electricity. Eg: In Rajasthan, more panels are required to meet energy demand, increasing cost and land use due to low conversion efficiency.
    • High Land Requirement: Due to their low efficiency, silicon panels need a larger surface area to generate the same output compared to newer technologies. Eg: The Rewa Solar Park in Madhya Pradesh covers over 1,500 hectares, reducing land availability for agriculture and conservation.
    • Slow Climate Impact: Despite growing solar capacity, CO₂ levels have risen from 350 ppm in 1990 to ~425 ppm in 2025, indicating renewables are not scaling fast enough. Eg: Even after installing 4.45 TWh of renewable energy by 2024, India remains behind on its climate targets.
    • Environmental Footprint of Manufacturing: The production of silicon panels involves high energy use and toxic chemicals, partially offsetting their green benefits. Eg: Most panels are imported from China, where coal-powered factories dominate, adding to indirect emissions.
    • Incompatibility with Advanced Applications: Silicon PVs are less suitable for high-efficiency applications like green hydrogen production, which needs more consistent, high-output energy. Eg: In pilot projects in Gujarat, using silicon panels reduces the overall efficiency of green hydrogen production due to energy losses.

    Why rethink electrolysis-based green hydrogen?

    • High Energy Consumption: Electrolysis requires more energy to produce green hydrogen than the energy hydrogen provides when used, making the process energy-inefficient. Eg: In India’s pilot projects in Ladakh, the high electricity input from solar panels results in low net energy gain, raising concerns about economic viability.
    • Storage and Transportation Challenges: Hydrogen has very low density, making it difficult and expensive to store and transport, often requiring high-pressure tanks or cryogenic conditions. Eg: In hydrogen mobility projects, such as those in Delhi, leakage and compression issues have hampered safe and cost-effective deployment.
    • Compounding Energy Losses in Conversion: Using green hydrogen to produce green ammonia or methanol, and then extracting hydrogen back, leads to multiple stages of energy loss. Eg: In proposed export hubs like Vizag, converting hydrogen to ammonia for shipping and then reconverting it abroad reduces overall energy efficiency.

    How do land and efficiency issues impact India’s solar push?

    • Low Efficiency Increases Land Requirement: Silicon solar panels with 15–18% efficiency require larger surface areas to generate the same energy as advanced solar technologies. Eg: In Rajasthan’s Bhadla Solar Park, vast desert land is used to compensate for low panel efficiency, which limits deployment in land-constrained states.
    • Urbanisation Limits Land Availability: Rapid urban expansion and the need to conserve green zones reduce the availability of suitable land for large-scale solar projects. Eg: In Mumbai’s metropolitan region, limited open space has pushed the focus toward rooftop solar, which has its own technical and regulatory hurdles.
    • Hinders Achievement of Renewable Energy Targets: The inefficient land-to-energy ratio slows down the pace of solar capacity expansion, affecting progress toward India’s net-zero commitments. Eg: In Tamil Nadu, where land is both fertile and scarce, competing demands between agriculture and solar installations have delayed key solar proposals.

    What role can artificial photosynthesis play in renewable energy?

    • Direct Conversion of Sunlight into Fuel: Artificial photosynthesis (APS) mimics natural photosynthesis to convert sunlight, water, and CO₂directly into fuels like green methanol or hydrogen, offering a clean, efficient alternative to traditional energy-intensive processes.
    • Bypasses Inefficiencies in Current Technologies: APS has the potential to eliminate multiple energy-loss steps such as electrolysis, storage, and reconversion, thereby enhancing the overall energy efficiency of renewable fuel production systems.

    Why invest in next-gen renewable tech like RFNBO? (Way forward)

    • Enhances Energy Independence: Renewable Fuels of Non-Biological Origin (RFNBO) can reduce India’s heavy reliance on imported fossil fuels (currently ~85%), promoting energy self-sufficiency in a geopolitically volatile world.
    • Supports Diverse and Efficient Decarbonisation: RFNBO technologies enable the production of cleaner fuels like green hydrogen, ammonia, and methanol using renewable electricity, offering higher efficiency and adaptability for industrial and transport sectors.
    • Future-Proofing India’s Energy Strategy: Investing in RFNBO ensures India is aligned with global clean energy innovations, allowing it to meet net-zero targets and remain competitive in emerging green fuel markets.
  • IMF releases World Economic Outlook (WEO)

    Why in the News?

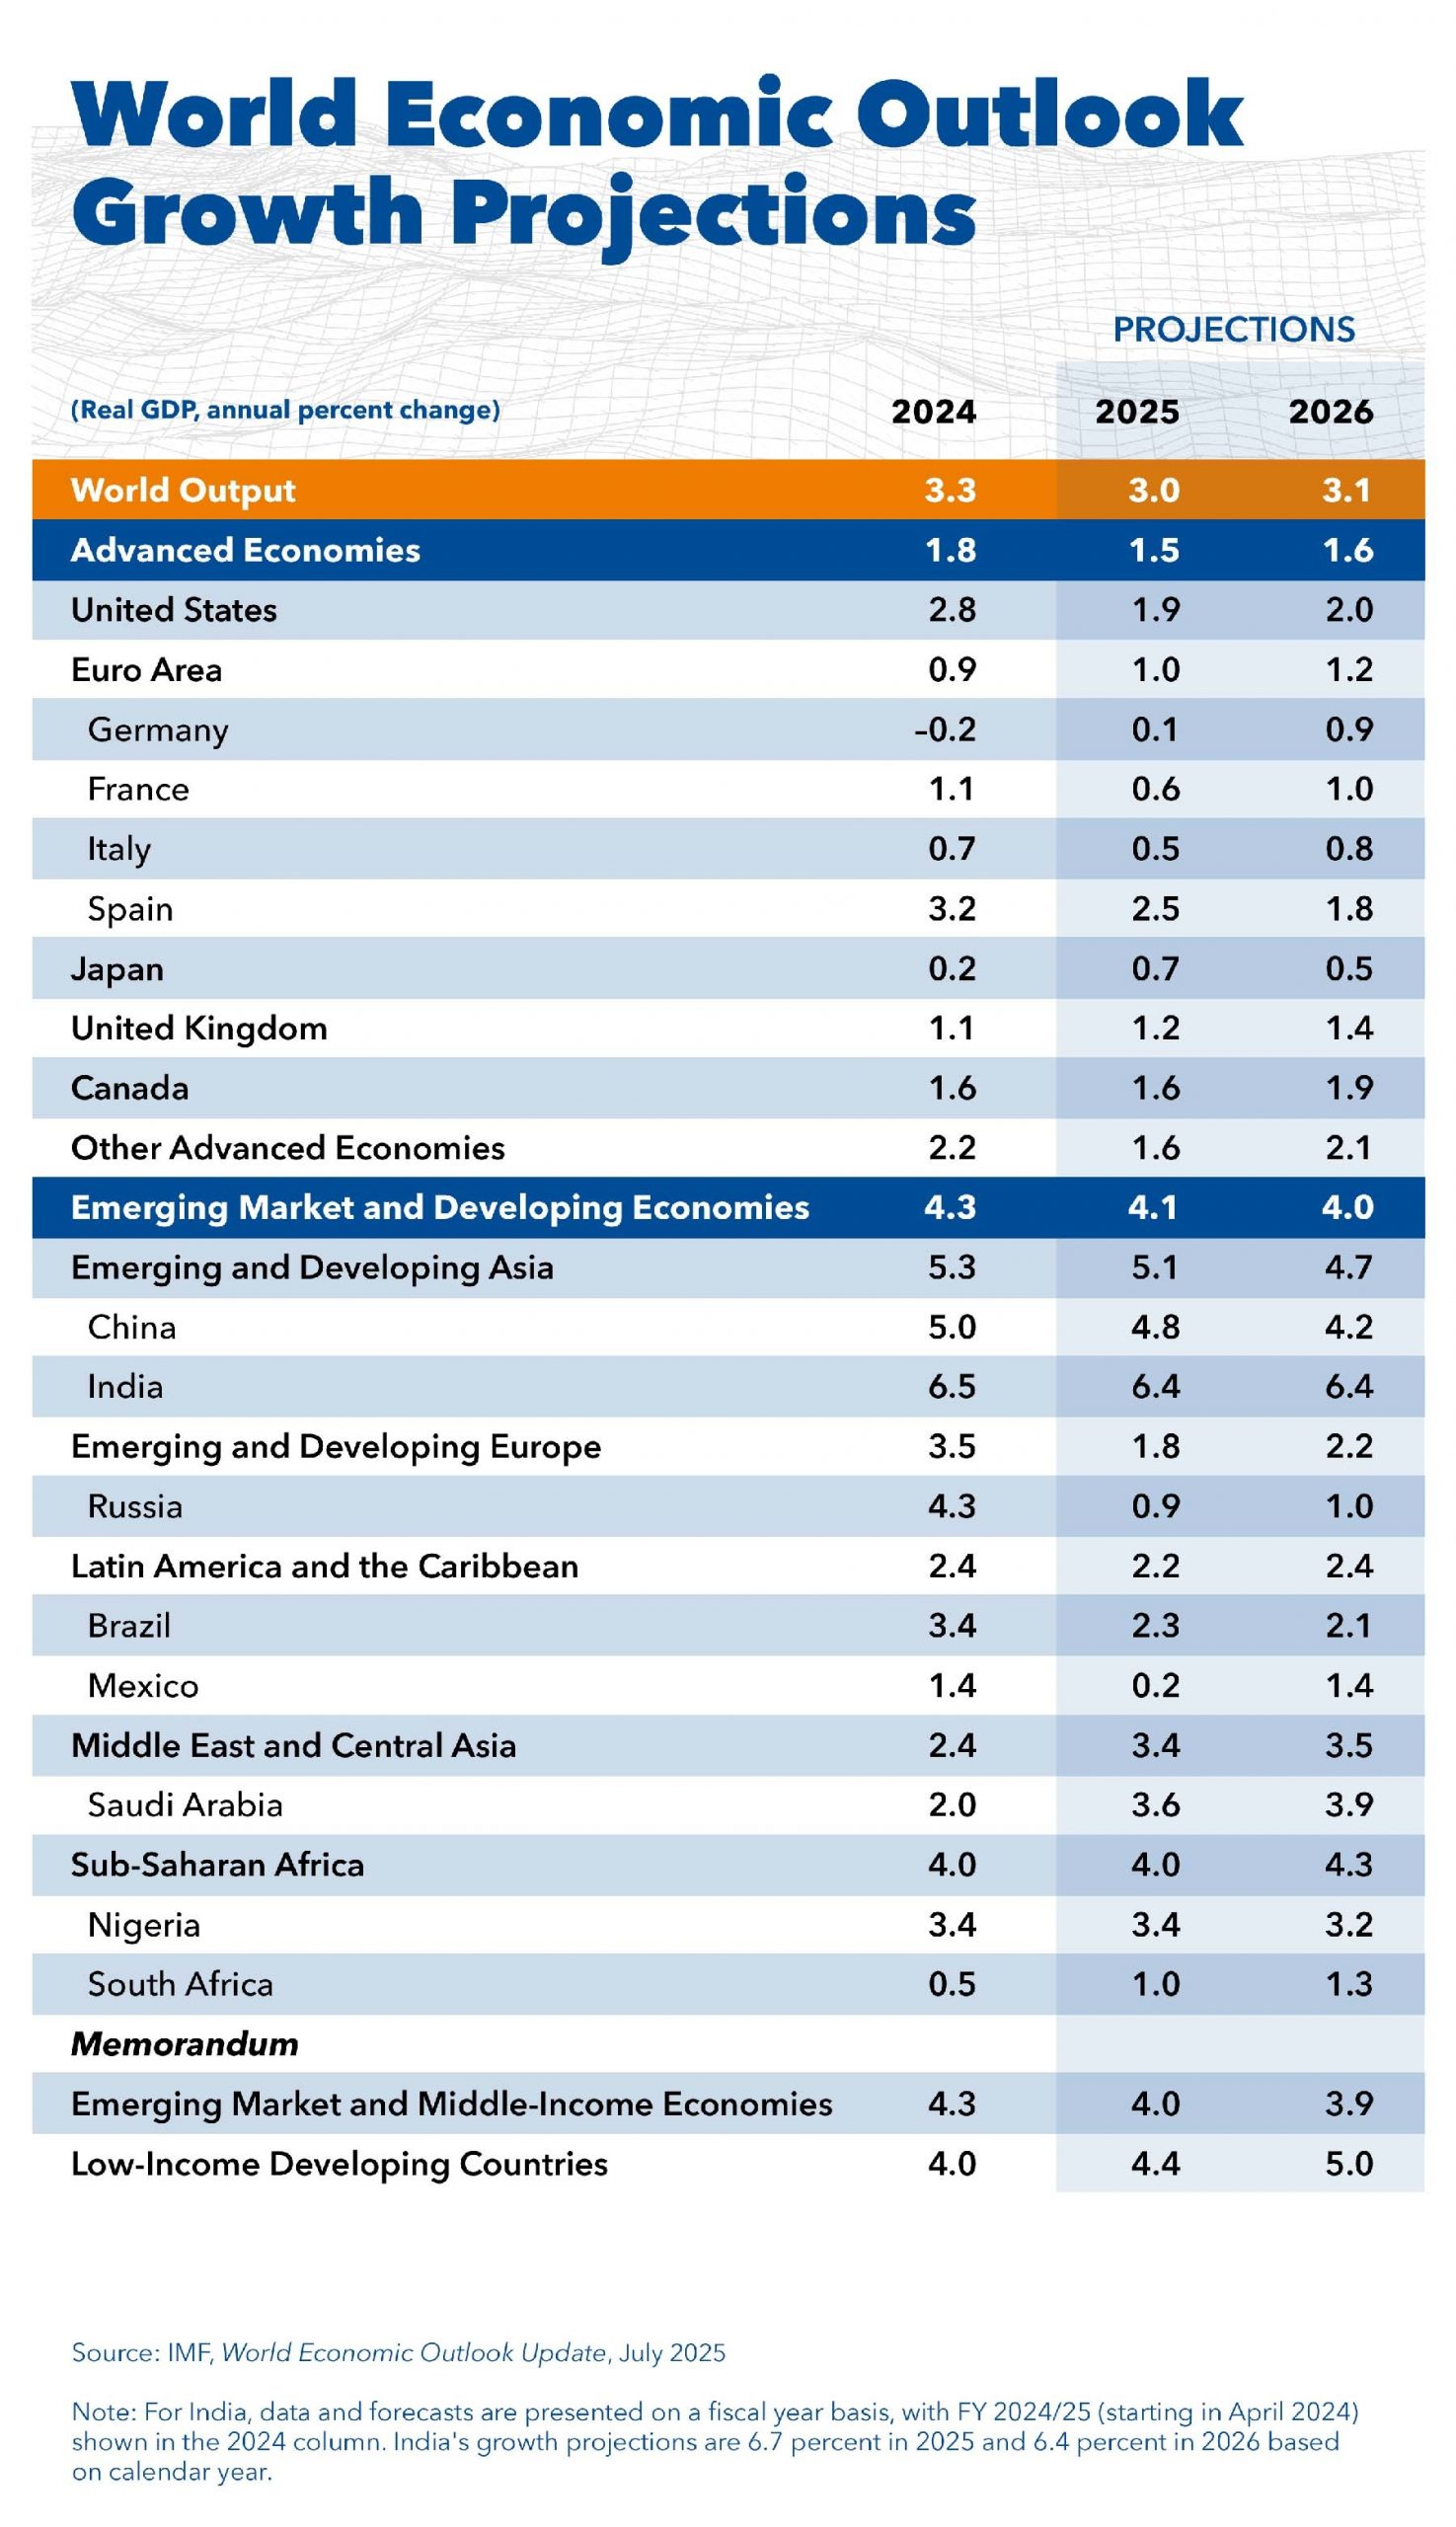
    The International Monetary Fund (IMF) has released the July 2025 update to its World Economic Outlook (WEO).

    IMF releases World Economic Outlook (WEO)

    About World Economic Outlook (WEO):

    • Published By: International Monetary Fund (IMF)
    • Frequency: Biannual (April, October) + updates in January and July
    • Purpose: Provides global forecasts on GDP, inflation, trade, and policy trends
    • Data Sources: IMF consultations with member nations and internal models
    • Audience: Governments, institutions, investors, researchers
    • July 2025 Update Title: “Global Economy: Tenuous Resilience amid Persistent Uncertainty”

    Key Highlights – July 2025 Update:

    • Global Growth Projections:
      • 2025: 3.0% (↑ from 2.8% in April)
      • 2026: 3.1% (↑ from 3.0%)
    • Despite multiple shocks—COVID-19, the Ukraine war, tariff increases—global growth continues.
      However, resilience remains fragile due to:

      • US–China tariff tensions and rising protectionism
      • Conflicts in Ukraine and the Middle East
      • High public debt in advanced economies is raising interest rates
    • Country Forecasts for 2025:  United States: 1.9%,  China: 4.8% (↑ from 4.0%),  Euro Area: 1.0%,  Germany: 0.1%,  United Kingdom: 1.2%,  Japan: 0.7%,  Russia: 0.9%,  Pakistan: 2.7%.

    India – The Bright Spot:

    • Growth Rate: 2023: 9.2%;  2024: 6.5%;  2025: 6.4% (strongest among major economies).
    • Drivers of Growth:
      • Robust domestic demand
      • Strong services and manufacturing output
      • Effective inflation and monetary policy management
    • Strategic Position:
      • Set to overtake several advanced economies in GDP size
      • Viewed globally as a “bright spot” amid persistent uncertainties
    [UPSC 2014] Which of the following organisations brings out the publication known as ‘World Economic Outlook?

    Options: (a) The International Monetary Fund * (b)The United Nations Development Programme (c) The World Economic Forum (d) The World Bank


  • What are Skill Impact Bonds (SIB)?

    Why in the News?

    Skill Impact Bonds (SIB) were recently highlighted by the Skill Development Ministry.

    About the Skill Impact Bond:

    • Launched: November 2021
    • Nature: India’s first Development Impact Bond (DIB) focused on employment-linked skill development
    • Lead Agency: National Skill Development Corporation (NSDC), under the Ministry of Skill Development and Entrepreneurship
    • Collaborators: British Asian Trust, HSBC India, Michael & Susan Dell Foundation
    • Target: Train and place 50,000 youth over 4 years, with 62% women participation
    • How it Works:
      • Risk Investors: Provide upfront capital to training providers
      • Training Providers: Deliver skill training and ensure job placements
      • Outcome Funders: Repay investors only if job outcomes are achieved
      • Evaluators: Independently assess outcomes via CATI surveys and document verification

    Key Features:

    • Outcome-Focused Approach: Measures success by certification, placement, and 3-month retention, not just enrolment
    • Eligibility Criteria:
      • Age: 18–40 years; Education: Undergraduate or below
      • Status: Unemployed or earning below ₹15,000/month, or household income below ₹25,000/month
    • Sectoral Coverage: Retail, Healthcare, Apparel, Logistics, Information Technology & IT-enabled Services, Banking, Financial Services & Insurance.
    • Women-Focused Design: Ensures 62% female participation to bridge the gender employment gap
    [UPSC 2018] With reference to Pradhan Mantri Kaushal Vikas Yojana, consider the following statements:

    1. It is the flagship scheme of the Ministry of Labour and Employment.

    2. It, among other things, will also impart training in soft skills, entrepreneurship, financial and digital literacy.

    3. It aims to align the competencies of the unregulated workforce of the country to the National Skill Qualification Framework.

    Which of the statements given above is/are correct?

    Options: (a) 1 and 3 only (b) 2 only (c) 2 and 3 only* (d) 1, 2 and 3


  • [pib] Digital Payments Index (DPI)

    Why in the News?

    According to the Reserve Bank of India (RBI), digital payments registered a 12.6% year-on-year rise as of March 31, 2024, as measured by the RBI’s Digital Payments Index (DPI).

    About RBI’s Digital Payments Index (DPI):

    • Launched by: Reserve Bank of India (RBI) in January 2021
    • Purpose: Measures the extent of digital payment adoption across India
    • Base Period: March 2018 (Index value = 100)
    • Release Frequency: Semi-annually (with a 4-month lag)
    • Objective: Track usage, infrastructure, and growth in digital payments
    • Key Parameters (with Weightage): These evaluate infrastructure readiness, transaction volume, user adoption, and innovation.
      1. Payment Enablers – 25%
      2. Payment Infrastructure – Demand Side – 10%
      3. Payment Infrastructure – Supply Side – 15%
      4. Payment Performance – 45%
      5. Consumer Centricity – 5%

    Growth Highlight:

    • Growth Trends in RBI-DPI: DPI grew nearly 5 times from 100 in March 2018 to 493.22 in March 2025, reflecting India’s rapid digital payment adoption.
    • Nearly 5× increase from the base value in 7 years
    • Driven by rapid expansion of Unified Payments Interface (UPI), mobile wallets, and QR code infrastructure
    [UPSC 2024] Consider the following countries:

    I. United Arab Emirates II. France III. Germany IV. Singapore V. Bangladesh

    How many countries amongst the above are there other than India where international merchant payments are accepted under UPI?”

    Options: (a) Only two (b) Only three* (c) Only four (d) All the five

    Answer: (b) Only three (UAE, France, Singapore)


  • Interrupted growth Industrial growth is still tied to government spends on infrastructure 

    Why in the News?

    India’s Index of Industrial Production (IIP) recorded a 10-month low growth of 1.5% in June, primarily due to a sharp decline in mining (–8.7%) and electricity output (–2.6%).

    What caused the IIP slowdown in June?

    • Sharp contraction in mining and electricity output: Mining activity declined by –8.7%, and electricity generation fell by –2.6%, significantly dragging overall growth. These two sectors jointly account for 22.3% of the IIP weightage.
    • Erratic monsoon and waterlogging in key mining belts: Early and uneven southwest monsoon caused flooding in mining areas of Odisha, Jharkhand, and West Bengal, disrupting production and logistics.
    • Damage to infrastructure and supply chain disruptions: Waterlogging led to damage in power distribution infrastructure and interrupted supply chains, resulting in subdued industrial activity and power demand.

    How did climate events contribute?

    • Disruption of mining activities: Heavy rainfall and waterlogging in mineral-rich regions like Jharkhand, Odisha, and West Bengal hindered extraction and transportation of key minerals. Eg: Jharkhand received 504.8 mm rainfall (against a normal of 307 mm), affecting coal and iron ore production.
    • Damage to power infrastructure: Flooding led to breakdowns in electricity distribution systems, especially in rural and semi-industrial belts. Eg: Widespread inundation disrupted power supply, lowering electricity output by –2.6% in June.
    • Supply chain interruptions: Climate irregularities caused logistical delays and increased input costs, hampering industrial flow.

    Why is India reluctant to link climate events with economic data like IIP or GDP?

    • Institutional hesitation and narrative control: Key agencies like the Ministry of Statistics and RBI prefer attributing economic fluctuations to factors like high base effects, global demand shifts, or input cost variations, avoiding politically sensitive climate linkages.
    • Complexity of climate attribution: Linking specific events (like heavy rain or drought) to climate change requires scientific modelling and probabilistic data, which are resource-intensive and not yet integrated into mainstream reporting.
    • Fear of politicisation and accountability: Acknowledging climate-linked economic slowdowns could invite policy criticism and demand for corrective action, making policymakers cautious.

    How do climate disruptions in mining and power affect industrial output?

    • Halted Mining Operations: Extreme rainfall leads to waterlogging and flooding in mining belts, making extraction unsafe and unviable. Eg: In June, mining activity contracted by –8.7% due to excessive rainfall in Odisha, Jharkhand, and West Bengal.
    • Damage to Power Infrastructure: Climate events like floods and storms disrupt power transmission lines and generation facilities, leading to reduced electricity output. Eg: Electricity production shrank by –2.6% in June, which lowered industrial productivity across sectors.
    • Supply Chain Disruptions: Delays in the supply of raw materials (like coal) due to climate-induced transport and logistical breakdowns affect the manufacturing cycle. Eg: Sluggish industrial output growth of 3.9% in June, despite some sectoral growth, was partly due to such disruptions.

    What can India learn from global practices in integrating climate risk into economic reporting?

    • Mainstream Climate Risk in Macroeconomic Analysis: Institutions like the European Central Bank (ECB) and Bank of England incorporate climate risk assessments into their economic forecasts and financial stability reports. Eg: The ECB uses climate stress tests to estimate the impact of extreme weather on GDP and inflation projections, helping shape responsive monetary and fiscal policies.
    • Develop Probabilistic Climate Attribution Models: Global agencies invest in scientific and data-driven models to link specific climate events to broader economic outcomes. Eg: The UK Met Office partners with economic bodies to assess how floods or heatwaves influence sectoral output and employment, ensuring better policy alignment and risk preparedness.

    Why is climate attribution important for informed economic policymaking?

    • Enables Targeted Risk Mitigation and Resource Allocation: Understanding the economic impact of specific climate events helps policymakers design sector-specific interventions, such as improved infrastructure in flood-prone mining regions or energy grid resilience plans.
    • Strengthens Long-term Economic Planning and Resilience: Integrating climate attribution allows for accurate forecasting and budgeting, ensuring that climate-linked disruptions (e.g., to power or mining) are factored into growth strategies, insurance frameworks, and industrial policies.

    Way forward: 

    • Integrate Climate Risk Frameworks into Economic Reporting: Agencies like the Ministry of Statistics and RBI should formally include climate-related variables in metrics like IIP and GDP, using probabilistic models and event attribution tools to capture the economic impact of extreme weather events.
    • Build Institutional Capacity for Climate-Economic Analysis: Establish a dedicated national climate-economic observatory or task force to monitor, assess, and publish regular reports on how climate disruptions affect different sectors, drawing inspiration from institutions like the European Central Bank.

    Mains PYQ:

    [UPSC 2021] Investment in infrastructure is essential for more rapid and inclusive economic growth.”Discuss in the light of India’s experience.

    Linkage: This question is highly relevant as it directly addresses the crucial role of “investment in infrastructure” for “economic growth.” The article explicitly states that “the robust growth in capital (3.5%), intermediate (5.5%) and infrastructure (7.2%) goods output, indicates that much of industrial growth continues to hinge on the government’s infrastructure spends”.

  • Adopt formalisation to power productivity growth 

    Why in the News?

    India’s manufacturing sector is facing renewed scrutiny due to the rising contractualisation of labour, which has grown from 20% in 1999-2000 to 40.7% in 2022-23, according to the Annual Survey of Industries

    What drives the rise of contract labour in formal manufacturing?

    • Cost Minimization: Employers hire contract workers to reduce wage bills and avoid social security contributions. Eg: In large firms, contract workers often earn up to 31% less than regular employees.
    • Bypassing Labour Laws: Contracting allows firms to circumvent regulations under the Industrial Disputes Act, 1947, such as rules on retrenchment and notice period.  
    • Operational Flexibility: Firms use contract labour to scale up or down quickly with demand without long-term obligations. Eg: Seasonal industries like textiles use short-term contract workers during peak export periods.
    • Third-Party Shielding: Outsourcing through contractors protects the principal employer from legal accountability for employment terms. Eg: Automobile assembly lines often outsource non-core work to manpower agencies.
    • Sector-Wide Trend Across Sizes: The rise in contract labour is not limited to small firms; it extends to large and capital-intensive industries. Eg: Between 2000 and 2022, contract labour share doubled from 20% to 40.7% across all industries.

    Why does contract labour hurt long-term productivity?

    • Low Skill Development: Contract workers are rarely given training or upskilling opportunities, limiting their efficiency and innovation. Eg: In India’s electronics manufacturing sector, companies like Dixon Technologies rely heavily on contract labour, leading to a shortage of skilled technicians for precision assembly.
    • High Attrition and Turnover: Contract workers frequently change jobs due to lack of job security, resulting in loss of institutional knowledge. Eg: In food processing units in Punjab, annual turnover among contract workers exceeds 70%, disrupting workflow continuity.
    • Reduced Worker Motivation: Absence of benefits like promotion, pension, or medical cover leads to low morale and reduced effort. Eg: In government-run power plants, studies have shown that contract workers contribute less to maintenance efficiency than permanent staff, affecting overall plant performance.
    • Weak Industrial Relations: Contract workers are often excluded from grievance redressal mechanisms or unions, increasing workplace tensions and risking disruptions. Eg: Maruti Suzuki’s Manesar plant witnessed violent unrest in 2012, partly attributed to discontent between permanent and contract workers.
    • Quality Compromise and Rework: Contract workers may lack the ownership mindset, resulting in errors and product rework, which lowers productivity. Eg: In garment export hubs like Tiruppur, repeated quality rejections from overseas buyers have been traced to inconsistent output from untrained contract labour.
    • Wage and cost gaps act as a disincentive
      • Unequal pay for equal work: Contract workers often earn much less than permanent workers for doing the same job, violating fairness.
        Eg: In PSUs like ONGC, contract workers earn up to 50% less than permanent employees for the same technical work.
      • Avoidance of social security: Employers save costs by not contributing to Provident Fund, gratuity, or health benefits, increasing worker insecurity.
        Eg: A CAG audit of private thermal power plants found 30–40% labour cost savings due to evasion of statutory benefits.

    What are the existing policy?

    • Contract Labour (Regulation and Abolition) Act, 1970: This law aims to regulate the employment of contract labour in certain establishments and abolish it in specific cases where work is perennial in nature. However, enforcement is weak, and many employers bypass provisions through sub-contracting.
    • Code on Occupational Safety, Health and Working Conditions (OSH Code), 2020: Consolidates 13 labour laws, including those related to health, safety, and working conditions of workers (including contract labour). It mandates registration of establishments and welfare facilities, but monitoring and implementation remain inconsistent.
    • Fixed Term Employment (FTE) provision under the Industrial Relations Code, 2020: Legalises short-term employment contracts with a provision for equal pay for equal work. But in practice, social security benefits and job security are often denied to such workers.

    Way forward: 

    • Ensure Universal Social Protection: Extend mandatory social security coverage (e.g., ESIC, EPF) to all contract and gig workers, with portable benefits and employer accountability, regardless of tenure or contract type.
    • Improve Legal Enforcement and Transparency: Strengthen labour law enforcement through digital compliance portals, randomised inspections, and public disclosure of contract employment data to prevent misuse and promote accountability.

    Mains PYQ:

    [UPSC 2024] Discuss the merits and demerits of the four ‘Labour Codes’ in the context of labour market reforms in India. What has been the progress so far in this regard?

    Linkage: The article talks about the “labour code on industrial relations” introduced in 2020 which is related to the demand of the question. This code, awaiting implementation, aims to provide greater flexibility in hiring and firing by allowing firms to directly hire non-regular workers on fixed-term contracts without third-party contractors. However, it also seeks to curb exploitation by mandating basic statutory employment benefits.