💥Mains Ready By December. Smash Mains & Smash PYQ Admissions Open

Subject: External Sector

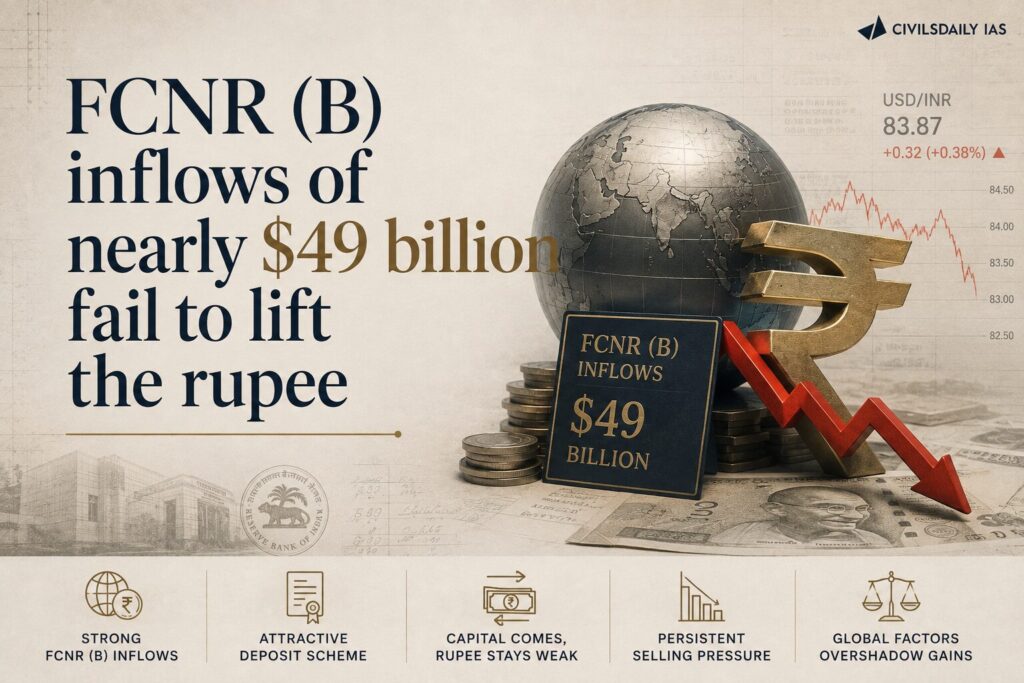
  • FCNR (B) inflows of nearly $49 billion fail to lift the rupee

    Why in the News

    India received nearly USD 49 billion during June-July 2026 through the Foreign Currency Non Resident (Bank) [FCNR(B)] swap window, foreign loans, and bond investments. However, the Indian Rupee (INR) remained stable at around ₹95.38/USD, unlike the sharp appreciation seen under a similar scheme in 2013.

    What are FCNR(B) Deposits and the Swap Window?

    FCNR(B) Deposits

    • Foreign currency term deposits maintained by Non-Resident Indians (NRIs) with Indian banks.
    • Protect depositors from exchange rate risk.
    • Tenure: 1-5 years.

    Swap Window

    • A facility by the Reserve Bank of India (RBI) where banks swap FCNR(B) dollar deposits for rupees.
    • Since dollars go directly to the RBI, they do not increase dollar supply in the forex market.

    Why Didn’t the Rupee Strengthen?

    • Dollar inflows bypassed the open forex market.
    • RBI sold dollars to stabilize the rupee amid global uncertainty.
    • Banks hedged future foreign currency liabilities.
    • Higher crude oil prices and a stronger US dollar offset the impact of inflows.

    Challenges

    • Strong US dollar and geopolitical risks.
    • Lower Foreign Direct Investment (FDI) inflows.
    • Rising crude oil prices widening the Current Account Deficit (CAD).
    • Risk of reversal of FCNR(B) deposits after the swap window ends.

    Value Addition

    • Spot Market: Immediate currency exchange.
    • Forward Market: Currency exchange at a future date and predetermined rate.
    • Foreign Exchange Reserves comprise:
      • Foreign Currency Assets (FCA) (largest component)
      • Gold
      • Special Drawing Rights (SDRs)
      • IMF Reserve Position

    Back2Basics:

    • FCNR(B): Foreign Currency Non Resident (Bank) Deposit.
    • Eligible: NRIs and Overseas Citizens of India (OCIs).
    • Tenure: 1-5 years.
    • Exchange Rate Risk: Borne by the bank/RBI, not the depositor.

    “[2017] Which of the following has/have occurred in India after its liberalization of economic policies in 1991?
    1. Share of agriculture in GDP increased enormously.
    2. Share of India’s exports in world trade increased.
    3. FDI inflows increased.
    4. India’s foreign exchange reserves increased enormously.
    (a) 1 and 4 only
    (b) 2, 3 and 4 only
    (c) 2 and 3 only
    (d) 1, 2, 3 and 4

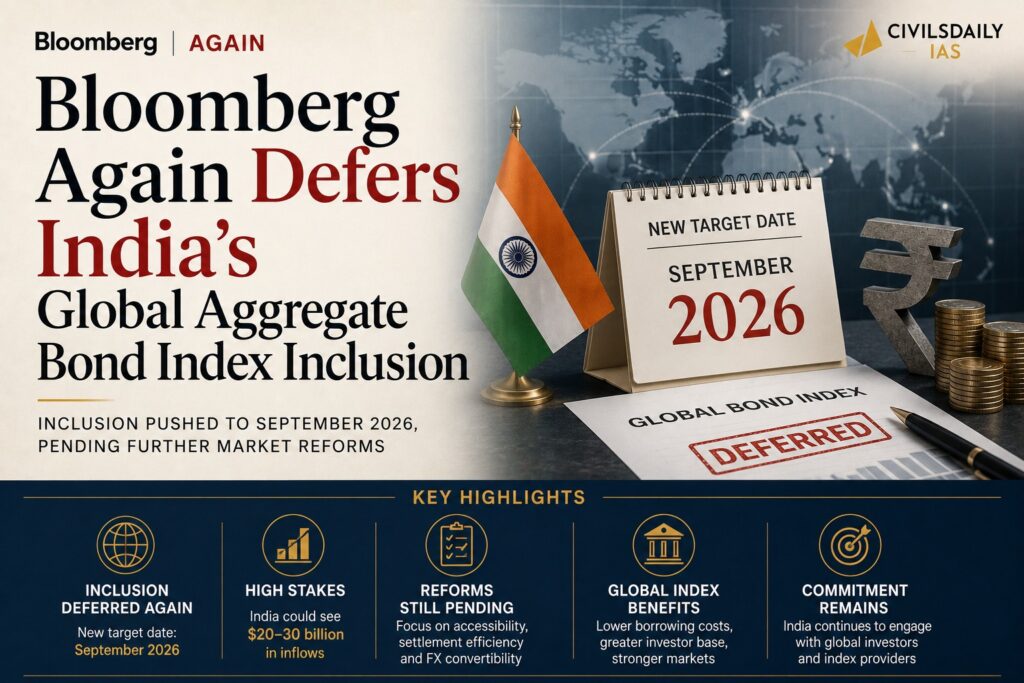
  • Bloomberg again defers India’s Global Aggregate Bond Index inclusion

    Why in the News?

    Bloomberg Index Services Ltd deferred India’s inclusion in the Bloomberg Global Aggregate Bond Index for the second time, stating that recent market reforms need to be fully reflected in operational practice before inclusion.

    What is the Bloomberg Global Aggregate Bond Index?

    • A global benchmark tracking investment-grade government and corporate bonds.
    • Widely followed by global institutional and passive investors.
    • Inclusion can attract passive foreign capital inflows into a country’s bond market.

    Why was India’s Inclusion Deferred?

    • Recent tax reforms are yet to be fully implemented in market operations.
    • Automated trading systems are not fully operational across investor regions.
    • Foreign investor onboarding and account opening remain cumbersome.
    • Bloomberg seeks evidence of sustained operational efficiency before inclusion.

    Significance

    • Inclusion could attract an estimated $20-30 billion in foreign investment.
    • Expands the investor base for Indian Government Securities (G-Secs).
    • Helps reduce government borrowing costs.
    • Enhances India’s integration with global financial markets.

    Challenges

    • Operational bottlenecks in trading and settlement.
    • Complex onboarding process for foreign investors.
    • Global market uncertainty affecting capital flows.
    • Need for robust market infrastructure despite policy reforms.

    Government Securities (G-Secs)

    • Debt instruments issued by the Government of India to finance fiscal deficits.
    • Considered virtually risk-free as they carry a sovereign guarantee.

    India’s Recent Bond Index Inclusions

    • JPMorgan Government Bond Index Emerging Markets (GBI-EM): June 2024.
    • Bloomberg Emerging Market Local Currency Government Index: January 2025.
    • FTSE Russell Emerging Markets Government Bond Index: September 2025.

    June 2026 Reforms

    • Removal of withholding tax to improve investment attractiveness.
    • Removal of capital gains tax for eligible foreign investors in specified government bonds.

    [2011] Both Foreign Direct Investment (FDI) and Foreign Institutional Investor (FII) are related to investment in a country. Which of the following statements best represents an important difference between the two?

    (a) FII helps bring better management skills and technology, while FDI only brings in capital.

    (b) FII helps in increasing capital availability in general, while FDI only targets specific sectors.

    (c) FDI flows only into the secondary market, while FII targets primary market.

    (d) FII is considered to be more stable than FDI.

  • What are India’s problems with most credit rating agencies

    Why in the News?

    Union Minister of Commerce, at a London business conference, accused global sovereign credit rating agencies of being “unfair to India” while praising India-headquartered CareEdge Ratings as “objective.” The remark reopens a standing government charge that international agencies keep India’s rating just above junk grade by over-weighting subjective, opinion-based judgments of “willingness to repay” over India’s stronger, verifiable “ability to repay” data.

    What are sovereign credit ratings?

    1. A sovereign credit rating is an independent evaluation of a country’s creditworthiness. 
    2. It measures a government’s ability and willingness to repay its debt obligations, helping global investors assess the risk of investing in that nation’s bonds or lending it money.
    3. Working: Ratings are assigned by independent credit rating agencies, most notably Standard & Poor’s (S&P), Moody’s, and Fitch Ratings.
      1. High Ratings (e.g., AAA, Aaa): Signal strong economic stability, low risk of default, and allow the government to borrow money at lower interest rates.
      2. Low Ratings (e.g., BB+, Ba1): Indicate higher credit risk and are typically labeled as “speculative” or “junk” grade, forcing the country to pay higher interest to compensate investors for the increased risk.

    How do rating agencies define and measure sovereign creditworthiness?

    1. Rating universe: India is rated by seven international sovereign credit rating agencies, S&P, Moody’s, Morningstar DBRS, Fitch, Japanese Credit Rating Agency (JCRA), Rating and Investment Information (R&I), and CareEdge Ratings. The three most widely accepted globally are S&P, Fitch, and Moody’s.
    2. Rated entities: The same alphabet-scale logic applies not only to sovereigns but to companies, municipal corporations, and state governments.
    3. Scale mechanics: Fitch and S&P run from AAA downward through AA+, AA, AA-, A+, A, A- into the B-grade band, ending at D for default. Moody’s follows an identical structure using different letters, starting at Aaa.
    4. Price-of-risk function: The rating fixes the interest rate at which an entity can borrow. AAA signals zero default risk and the lowest borrowing cost; each downward notch raises the rate to compensate lenders for higher perceived risk.
    5. The dual metric: Ability to repay is quantitative, drawn from hard, verifiable macroeconomic data. Willingness to repay is qualitative, resting on an agency’s opinion of intent rather than capacity. This distinction structures India’s later grievance against the agencies.

    What has India’s rating trajectory looked like?

    1. Persistent floor: Across most agencies, India has stayed at the lowest rung of investment grade, a grade or two above junk status, the threshold at which institutions stop lending for fear of default.
    2. Long stagnation: Until recently, this rating stayed unchanged for more than a decade, and in some cases for nearly two decades.
    3. S&P upgrade: S&P raised India’s long-term sovereign rating to BBB from BBB- in August 2025, its first upgrade of India in 18 years.
    4. Moody’s upgrade: Moody’s raised India to Baa2 (equivalent to BBB) from Baa3 in 2017, its first upgrade of India in 13 years.
    5. Other 2025 movements: R&I upgraded India to BBB+ from BBB in September 2025; Morningstar DBRS upgraded India to BBB in May 2025.

    Why does the government call the ratings agencies’ methodology unfair to India? 

    1. Persisting grievance despite upgrades: Even after the 2025 upgrades, India’s rating remains just above junk grade. India argues that agencies have not credited India’s growth story, its fundamentals, or its sovereign capabilities as a rating agency should.
    2. Official continuity: The Finance Minister of India has separately called for reform of the agencies’ methodologies, establishing this as a standing government position rather than a one-off remark.
    3. Economic Survey precedent: The 2020-21 Economic Survey devoted a full chapter to the issue. It noted this was the first time the world’s fifth-largest economy had been assigned such a low rating.
      1. Ability case made: The Survey argued India’s macroeconomic fundamentals were strong enough to demonstrate ability to repay debt.
      2. Willingness case made: It also argued India’s record of never defaulting on sovereign debt despite multiple crises should establish willingness to repay.
    4. Core allegation: The central charge is that agencies weigh the qualitative willingness metric (grounded in the opinions of a small group of experts and prone to subjectivity) more heavily than the quantitative ability metric, on which India performs comparatively well but which carries lower weightage.

    Why is CareEdge Ratings being held up as the corrective model?

    1. Origin and perception: CareEdge is the first sovereign ratings agency headquartered in India, feeding the perception that it can better capture the ground realities of the Indian economy.
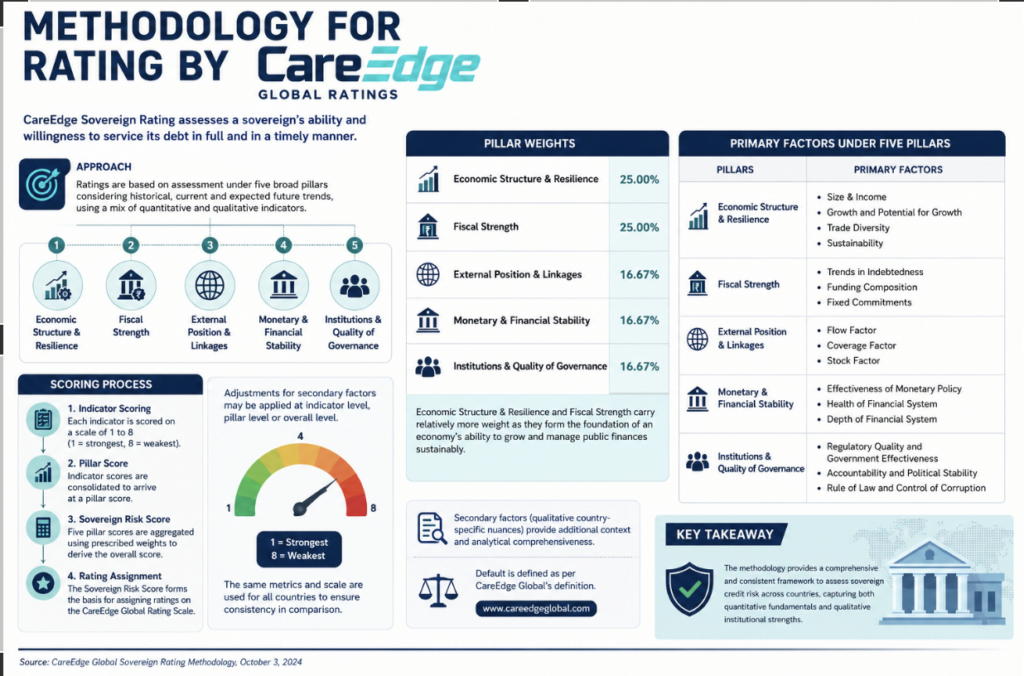
    2. Methodological difference: CareEdge’s own methodology note assigns primary importance to quantitative factors, directly inverting the qualitative-heavy approach India accuses the major agencies of using.
    3. Political endorsement: Goyal singling out CareEdge as “objective” aligns with the government’s broader argument that a quantitative-first method would rate India more favourably.

    Conclusion

    India’s persistently sub-BBB sovereign rating, despite improving fundamentals, stems from ratings agencies’ structural preference for qualitative, opinion-driven assessments of willingness to repay over quantitative measures of ability to repay. This is a metric on which India performs well. The government’s promotion of CareEdge Ratings, a domestic agency that weights quantitative factors more heavily, functions less as a technical fix than as an assertion that India deserves to be rated on its own terms. This does not resolve who sets the criteria for creditworthiness: India’s grievance can only be addressed if the major agencies alter their own weighting, a decision outside New Delhi’s control. Until then, India’s rating will likely continue to lag its economic weight.

    PYQ Relevance

    [UPSC 2017] Among several factors for India’s potential growth, the savings rate is the most effective one. Do you agree? What are the other factors available for growth potential?

    Linkage: Sovereign credit ratings directly influence investment flows and borrowing costs, which affect capital formation and India’s long-term growth potential. The article argues that global rating agencies undervalue India’s macroeconomic strengths and growth prospects, thereby increasing borrowing costs despite strong economic fundamentals.

  • Export Inspection Council (EIC)  

    Why in the News?

    • India clarified that Export Inspection Council (EIC) certificate for rice exports is required only for certain European countries, including: European Union (EU), United Kingdom, Iceland, Liechtenstein, Norway, and Switzerland

    About Export Inspection Council (EIC)

    • Established Under: Export (Quality Control and Inspection) Act, 1963
    • Statutory Body 
    • Established By: Government of India
    • Year: 1963
    • Nodal Ministry: Ministry of Commerce and Industry
    • Headquarters: New Delhi

    Purpose

    • Ensures quality and safety of Indian exports
    • Promotes sound development of export trade
    • Acts as official export certification body of India

    Organizational Structure

    • Chairman — Head of Council
    • Executive Head: Director of Inspection & Quality Control
    • Responsible for day to day functioning
    [2025] With reference to India, consider the following pairs: Organization  Union Ministry 
    1. The National Automotive Board: Ministry of Commerce and Industry 
    2. The Coir Board: Ministry of Heavy Industries 
    3. The National Centre for Trade Information: Ministry of Micro, Small and Medium Enterprises 
    How many of the above pairs are correctly matched? 
    [A] Only one [B] Only two [C] All the three [D] None
  • Export Preparedness Index (EPI) 2024

    Why in the News?

    NITI Aayog released the Export Preparedness Index (EPI) 2024, assessing export readiness of Indian States and Union Territories. This is the 4th edition of the Index, first launched in August 2020.

    The Index aligns with India’s targets of USD 1 trillion merchandise exports by 2030

    About Export Preparedness Index

    • Evidence based framework to assess strength, resilience and inclusiveness of subnational export ecosystems
    • Recognises the critical role of States and districts in India’s global trade performance
    • Identifies
      • Structural challenges
      • Growth levers
      • Policy opportunities
    • Focus on districts as core units of export competitiveness

    Top Performing States and Union Territories

    A. Large States

    1. Maharashtra
    2. Tamil Nadu
    3. Gujarat
    4. Uttar Pradesh
    5. Andhra Pradesh

    B. Small States, North Eastern States & Union Territories

    1. Uttarakhand
    2. Jammu and Kashmir
    3. Nagaland
    4. Dadra and Nagar Haveli & Daman and Diu
    5. Goa
    [2020] With reference to the international trade of India at present, which of the following statements is/are correct? 

    1. India’s merchandise exports are less than its merchandise imports

    2. India’s imports of iron and steel, chemicals, fertilisers and machinery have decreased in recent years

    3. India’s exports of services are more than its imports of services

    4. India suffers from an overall trade/current account deficit

    Select the correct answer using the code given below: 

    (a) 1 and 2 only (b) 2 and 4 only (c) 3 only (d) 1, 3 and 4 only

  • Excessive dependence: On India’s external trade landscape

    Introduction

    India recorded a historic goods trade deficit in October ($41.68 billion), following a sharp rise from September’s $32.15 billion deficit. The decline in exports, driven largely by the U.S.’s steep tariffs, coincides with an abnormal spike in gold and silver imports, rupee depreciation, and heavy portfolio outflows. The article highlights how India’s dependence on the U.S. market has exposed it to both economic and diplomatic vulnerabilities, raising questions about whether the shift in trade patterns is structural or a temporary response to external shocks.

    Why in the News

    India’s record October trade deficit of $41.68 billion, the sharpest ever, signals a significant disruption in its external trade landscape. Exports plunged due to the U.S.’s sudden 50% tariffs, critical because the U.S. is India’s largest export market, while gold imports tripled and silver inflows rose fivefold, creating an unprecedented import spike.

    A Rising Trade Deficit and What It Reveals

    1. Record Deficit ($41.68 bn): Reflects a sequential deterioration from September’s $32.15 bn deficit, signalling a disturbing shift.
    2. Export Fall (-11.8% YoY): Goods exports dropped to $34.38 bn (from $38.98 bn in 2024), driven primarily by U.S. tariffs.
    3. Heavy Import Surge: Driven by a dramatic rise in bullion inflows and the use of cheaper imported intermediates.

    Why the U.S. Tariffs Hit India Hard

    1. 50% Tariff Shock: Imposed in August, directly affecting sectors for which the U.S. has been India’s major market since 2018-19.
    2. Large Market Dependence: The U.S. remains the biggest buyer of India’s textiles, yarn, readymade garments, and engineering goods.
    3. Export Decline (-9% YoY): Overall exports to the U.S. contracted sharply in October.

    What Is Driving the Surge in Gold and Silver Imports?

    1. Gold Imports Tripled: Rising from $4.92 bn (last October) due to economic uncertainty.
    2. Silver Imports Up Fivefold: Indicates hedging behaviour rather than seasonal demand.
    3. Rupee Weakening (₹85.6 to ₹88.4): Encouraged investors to seek bullion as a safe asset.

    Sector-Wise Export Stress

    1. Cotton Yarn & Handlooms (-13.31%): Major labour-intensive sector hit due to tariff-led slowdown.
    2. Man-Made Yarn (-11.75%): Reflects weakening competitiveness.
    3. Readymade Garments (-12.88%): Particularly vulnerable to U.S. demand contraction.
    4. Engineering Goods (-16.71%): Hit despite being a major export strength area.

    Is the Import Surge a Structural Pattern?

    1. Cheaper Intermediate Goods: Firms increasingly rely on imported inputs to maintain export competitiveness.
    2. Depreciating Rupee: Makes imports costlier but also signals reduced domestic sourcing.
    3. Need for HS-Chapter Analysis: A breakdown by commodity and source country will clarify which imports are rising structurally.

    Government Measures and Their Limitations

    1. Export Promotion (₹25,060 crore over 6 years): Centre has stepped in to cushion exporters.
    2. RBI Relief Measures: Target tariff-affected exporters.
    3. Too Early to Call It Structural: Realignment of supply chains and market diversification could take years.

    Geopolitical Shifts and Bilateral Trade Dynamic

    1. India-U.S. Bilateral Trade Agreement: If concluded soon, October’s deficit spike may be temporary.
    2. Russian Imports Down (-27.73%): Sharp drop indicates effort to reduce crude dependence.
    3. U.S. Imports Up (13.89%): Suggests attempt to ease American concerns over trade imbalance.

    Conclusion

    India’s record trade deficit underscores the risks of concentrated export dependence and volatile imports driven by economic uncertainty. While the current shift may be partly reactionary, persistent decline in labour-intensive exports and rising reliance on imported intermediates signal deeper structural weaknesses. Managing this transition will require sustained policy intervention, diversification of markets, and a recalibration of India’s trade portfolio to mitigate vulnerability.

    PYQ Relevance

    [UPSC 2018] How would the recent phenomena of protectionism and currency manipulations in world trade affect macroeconomic stability of India?

    Linkage: The U.S. tariff shock and rupee weakening in the article directly mirror the PYQ’s theme, showing how protectionism and currency swings widen India’s trade deficit. Together, they illustrate the resulting stress on India’s macroeconomic stability.

  • Low taxes spur buying but jobs and incomes will have to grow

    Introduction

    India’s economy is witnessing strong domestic demand supported by lower income tax and GST rates, easing inflation, a healthy monsoon, and lower interest rates. However, external uncertainties, high U.S. tariffs on Indian exports, and weak goods-export momentum pose headwinds. While consumption, services exports, and government capital expenditure show strength, India’s long-term growth will depend on sustained job creation and rising household incomes.

    Why in the News? 

    India’s domestic demand is rebounding strongly due to lower income taxes, GST rationalisation, easing inflation, and a good monsoon, marking a sharp contrast to earlier quarters of weak consumption. The IMF upgrading India’s GDP projection for FY25-26 from 6.4% to 6.6% signals strong resilience despite external headwinds. However, goods exports face pressure from U.S. reciprocal tariffs, and income growth has not kept pace with consumption, making it crucial to assess how India can sustain growth without widening inequalities.

    What is driving the current revival in domestic demand?

    1. Lower income tax & GST rates: Supported domestic demand as rationalisation reduced consumer burden.
    2. Good monsoon: Enabled agricultural stability, boosting rural purchasing power.
    3. Lower inflation & interest rates: Created favourable consumption conditions in the first half of the year.
    4. Higher government capital expenditure: Surged by 40%, strengthening infrastructure demand and pushing growth.
    5. Higher disbursements by Food & Public Distribution: Supported rural consumption and safety nets.

    How is India’s export performance shaping up?

    1. Non-oil goods exports grew 7% in the first half of the year, with overall goods exports rising 10%.
    2. Electronics exports increased 10% in the same period, indicating success of PLI-supported segments.
    3. Items like gems & jewellery, carpets, leather slowed due to global weak demand.
    4. High U.S. tariffs: India’s exports to the U.S. are facing pressure, especially textiles and electronics.
    5. Risk of global consolidation: Export growth may moderate due to volatility in global capital flows.

    What is the role of India’s services exports?

    1. Services remain the big buffer: Annual growth projected at around 10%, providing stability.
    2. IT services: Still robust despite global slowdown.
    3. Travel, transport, logistics, professional services: Showing strong expansion post-pandemic.
    4. CAGR of services exports (FY20-FY25): Strong performance contributed substantially to overall GDP.

    Why is investment activity picking up?

    1. Government capital expenditure +40%: Major driver of infrastructure formation.
    2. Private sector investment: Modest but improving, with pickup in power, cement, construction, pharma, and logistics.
    3. Lower interest rates: Created enabling conditions for investment in the second half of the year.
    4. High forex reserve ($690 billion): A comfort factor for foreign investors.

    Why must jobs and household incomes grow now?

    1. Strong consumption without matching income growth is unsustainable.
    2. Sticky unemployment risks weakening domestic demand.
    3. Labour-intensive sectors (textiles, leather, small manufacturing) face export pressure due to high U.S. tariffs.
    4. Structural reform need: India requires higher household income growth, MSME support, and labour-market reforms to sustain growth.
    5. Long-term challenge: Services-led growth creates fewer jobs, while global slowdown limits export-driven job creation.

    Conclusion

    India’s growth momentum is increasingly anchored in strong domestic demand supported by rationalised taxes, a good monsoon and inflation moderation. However, sustaining this trajectory requires broad-based income growth, job creation, and resilience in export sectors affected by global uncertainty. Without strengthening labour-intensive sectors and expanding household purchasing power, India’s growth revival may lose steam.

    PYQ Relevance

    [UPSC 2015] The nature of economic growth in India in recent times is often described as jobless growth. Do you agree? Give arguments in favour of your answer.

    Linkage: Such articles recur because growth-jobs imbalance is a persistent structural issue in India, making it a favorite UPSC theme. The article directly reflects the GS-3 question on “jobless growth” as consumption rises but employment and incomes lag. It helps analyze why India’s recent growth remains demand-led but not job-led, a core UPSC economic concern.
  • Authorised Economic Operator (AEO) India Scheme 

    Why in the News?

    India’s Authorised Economic Operator (AEO) programme was commended by the World Trade Organization (WTO) for significantly enhancing MSME participation in global trade.

    What is AEO India Scheme?

    • Overview: It is a voluntary certification programme launched by the Central Board of Indirect Taxes and Customs (CBIC) in 2011 to promote secure and efficient cross-border trade.
    • Objective: Identifies and accredits trusted traders demonstrating high customs compliance and supply chain security, offering trade facilitation benefits.
    • Evolution: Began as a pilot in 2011, revised in 2016 to merge with the Accredited Client Programme (ACP), aligning with the World Customs Organization (WCO) SAFE Framework of Standards.
    • Certification Tiers: Consists of AEO-T1, AEO-T2, AEO-T3, and AEO-LO (Logistics Operator) each offering progressively higher benefits based on compliance, solvency, and security.
    • Key Benefits: Provides faster customs clearances, deferred duty payments, direct port delivery, reduced inspections, priority adjudication, and dedicated client managers.

    About WCO AEO Framework:

    • Origin: Established by the World Customs Organization (WCO) under the SAFE Framework of Standards (2005) to enhance trade security and customs modernisation.
    • Core Aim: Ensures secure, legitimate trade through collaboration between Customs authorities and private traders.
    • Three Pillars:
      • Customs-to-Customs cooperation for border coordination.
      • Customs-to-Business partnership via AEO certification.
      • Customs-to-Other Agencies collaboration for integrated control.
    • AEO Concept: Certifies compliant entities as trusted operators, granting simplified and expedited procedures.
    • Benefits: Enables faster clearances, mutual recognition between countries, enhanced risk management, and lower transaction costs.
    • Global Adoption: Over 90 countries have operational AEO programmes with Mutual Recognition Arrangements (MRAs) ensuring standardisation.
    • India’s Alignment: India’s AEO model is fully harmonised with the WCO SAFE Framework, ranking among the most comprehensive customs–business partnership systems in the developing world.
  • Remission of Duties and Taxes on Exported Products (RoDTEP) Scheme

    Why in the News?

    The Government has extended the Remission of Duties and Taxes on Exported Products (RoDTEP) Scheme until March 31, 2026, providing relief and policy certainty to exporters.

    About the RoDTEP Scheme:

    • Launch & Context: Introduced on 1 January 2021 under the Foreign Trade Policy 2015–20, replacing the Merchandise Exports from India Scheme (MEIS) after India lost a case at the World Trade Organisation (WTO).
    • Administration: Managed by the Department of Revenue, Ministry of Finance, and implemented via the Central Board of Indirect Taxes and Customs (CBIC).
    • Objective: Refund hidden domestic taxes/duties on exports to ensure goods leave the country free of embedded levies, enhancing competitiveness and ensuring WTO compliance.
    • Coverage: Applicable to all Indian exporters (manufacturers and merchants) including SEZs, Export Oriented Units (EOUs), Advance Authorisation (AA) holders, and Domestic Tariff Area (DTA) units.
    • Timeline: Initially valid till 5 February 2025, restored in May 2025 for AA, EOU, and SEZ exports after industry lobbying, and now extended till 31 March 2026.

    Key Features:

    • Hidden Taxes Covered: Refunds duties such as electricity duty, mandi tax, fuel charges in transport, and local cesses.
    • Rebate Mechanism: Calculated as a percentage of the Free on Board (FOB) value of exports.
    • Refund Mode: Benefits disbursed as electronic scrips (e-scrips), stored in CBIC’s digital ledger.
    • Use of E-Scrips: Can be utilised to pay basic customs duty or transferred to other importers.
    • Sectoral Priority: Focus on labour-intensive industries like textiles, handicrafts, leather, etc.
    • Exclusion: Re-exported goods are not eligible under RoDTEP.
    • Budgetary Control: Operates strictly within annual budget allocations, as clarified by DGFT.
    • Policy Certainty: Extension till 2026 ensures stability for exporters facing global trade headwinds.
    [UPSC 2020] With reference to the international trade of India at present, which of the following statements is/are correct?

    1.  India’s merchandise exports are less than its merchandise imports.

    2. India’s imports of iron and steel, chemicals, fertilizers and machinery have decreased in recent years.

    3. India’s exports of services are more than its imports of services.

    4. India suffers from an overall trade/current account deficit.

    Select the correct answer using the code given below:

    Options: (a) 1 and 2 only  (b) 2 and 4 only (c) 3 only (d) 1, 3 and 4 only*


  • India at the Crossroads: Navigating WTO Pressures After China’s SDT Exit

    Introduction

    The World Trade Organisation (WTO) has long been a battleground where developing nations, including India and China, defended their need for lenient subsidy caps, longer compliance timelines, and tariff protections. China’s self-exit from Special and Differential Treatment (SDT) concessions, despite retaining its developing country tag, signals a dramatic shift in the global trade order. For India, which has depended on SDT since its 1995 WTO accession, this development comes amid escalating US trade pressures, Trump-era tariff wars, and growing criticism of India’s subsidy regimes. The question is not only about trade but about food security, farmer livelihoods, and future economic strategy.

    Why is this development significant?

    1. First-time shift: China, the world’s second-largest economy, has for the first time announced it will not seek SDT despite being classified as a developing country.
    2. Sharp contrast: Since 1995, SDT flexibilities have been central to India’s WTO negotiations; China’s withdrawal isolates India’s position.
    3. Big stakes: India subsidises around $50 billion annually to low-income farmers and channels over $40 billion into Minimum Support Price (MSP) schemes, directly impacting 1.4 billion people.
    4. Striking implications: If phased AMS (Aggregate Measurement of Support) cuts are enforced, subsidies may fall by 20–30% per decade, with a 10–15% rural income drop and worsening food insecurity.

    How has India historically benefited from SDT?

    1. Tariff flexibility: Allowed India to impose 100%+ tariffs on sensitive goods such as branded medicines, automobiles, and luxury goods.
    2. Agriculture support: Article 6.2 exemptions for low-income farmers and public distribution schemes like MSP ensured food and livelihood security.
    3. Special treatment: Shielded India from disputes, despite often breaching the 10% subsidy cap under AMS rules.
    4. Trade defence: Enabled India to resist developed country pressures, citing its developing nation status.

    What challenges does India face now?

    1. Coercive reduction: Phased AMS cuts threaten to undermine National Food Security Act (NFSA) provisions.
    2. Malnutrition risk: With 35% of children under five malnourished, subsidy rollback could worsen hunger and inequality
    3. Export vulnerability: Without SDT, India’s MSMEs and farmers face tougher competition in global markets.
    4. US/EU pushback: Developed nations already accuse India of trade distortion, citing examples like MSP and high farm subsidies.

    What options does India have?

    1. Recalibrate subsidies: Shift from price support to income support (direct cash transfers), reducing WTO disputes.
    2. Promote Green Box subsidies: Focus on R&D, extension services, and sustainability programs which are WTO-compliant.
    3. Negotiate transitional safeguards: Demand longer compliance windows to cushion the shift.
    4. Defend digital/data sovereignty: Push for data localisation rights and tiered tariff structures in new trade deals.

    What should India’s strategic plan look like?

    1. Phased tariff liberalisation: Gradually reduce non-essential SDT protections while safeguarding food security.
    2. Boost MSME competitiveness: Use the ONDC (Open Network for Digital Commerce) to integrate small businesses into global e-commerce.
    3. Intellectual property balance: Protect generic drug exports while resisting pressure for stronger IP regimes.
    4. Coalition building: Revive alliances like the G33 to collectively defend agricultural and food security concerns.
    5. Domestic reforms: Enhance farm productivity and diversify exports to reduce dependence on SDT shield.

    Conclusion

    China’s withdrawal from SDT marks a turning point in global trade politics. India now faces mounting pressure to reform its subsidy structure, align with WTO disciplines, and balance food security with competitiveness. The way forward lies not in clinging to outdated protections but in crafting innovative, WTO-compliant support systems that secure farmer welfare while projecting India as a responsible global player. Strategic coalition-building, calibrated reforms, and smart diplomacy will decide whether India emerges weakened or empowered in the new trade order.

    PYQ Relevance

    [UPSC 2018] What are the key areas of reform if the WTO has to survive in the present context of ‘Trade War’, especially keeping in mind the interest of India?

    Linkage: China stepping back from SDT intensifies calls for WTO reforms in subsidy rules, dispute settlement, and fair treatment of developing nations, directly testing India’s ability to safeguard food security and farmer support while pushing for a more equitable trade order.

    Value Addition

    WTO Agreement on Agriculture (AoA) – Article 6.2 Exemptions

    • Provision: Allows developing countries to provide investment subsidies and input subsidies to low-income or resource-poor farmers without it being counted under the AMS cap.
    • India’s Use: India justifies its fertilizer, electricity, and irrigation subsidies under this clause to protect small farmers who form nearly 85% of the farming community.
    • Relevance: Central to defending India’s MSP and food security programs in global negotiations.

    Aggregate Measurement of Support (AMS)

    • Definition: WTO’s metric for calculating trade-distorting farm subsidies (amber box), capped at 10% of the value of production for developing countries.
    • India’s Issue: With large MSP and food procurement under NFSA, India is often accused of breaching this cap. Example – Rice subsidies have repeatedly attracted scrutiny in WTO disputes.
    • Relevance: Reform of AMS rules is India’s key demand in WTO negotiations, arguing current methodology undervalues developing nations’ needs.

    Green Box vs Amber Box Subsidies

    • Amber Box: Trade-distorting subsidies (e.g., MSP, procurement at administered prices).
    • Green Box: Non-trade distorting subsidies like agricultural R&D, extension services, crop insurance, and environmental protection.
    • India’s Position: Heavy reliance on amber box through MSP and PDS; however, India is now trying to expand its green box spending on crop diversification, climate-resilient agriculture, and digital extension services.
    • Relevance: Diversifying support to green box can shield India from WTO disputes while modernising agriculture.

    G33 Coalition

    • About: A group of 47 developing countries led by India, China, and Indonesia, advocating flexibility in agriculture negotiations.
    • India’s Role: Spearheads demands for a ‘Special Safeguard Mechanism’ (SSM) and permanent solution for public stockholding (PSH) of food grains.
    • Relevance: Strengthens India’s negotiating leverage by projecting its subsidy and food stockholding as a collective developing-world concern, not just a national exception.

    National Food Security Act (2013) (NFSA)

    • Provision: Legally entitles 75% of rural and 50% of urban population to subsidised food grains through PDS.
    • Conflict with WTO: Heavy procurement at MSP and distribution under NFSA is seen as trade-distorting. Critics argue this exceeds the 10% AMS cap.
    • Relevance: WTO restrictions on subsidies could directly affect India’s food security safety net covering over 800 million people.

    ONDC (Open Network for Digital Commerce)

    • Concept: A government-backed initiative to democratise e-commerce by creating an open-source, interoperable digital network for buyers and sellers.
    • Trade Defence: Seen as India’s strategic response to global e-commerce giants (Amazon, Walmart-Flipkart), ensuring fair competition for MSMEs.
    • Relevance: In WTO’s ongoing e-commerce negotiations, ONDC is a shield for India to resist pressure for blanket liberalisation of digital trade and data flows, while protecting domestic digital sovereignty.