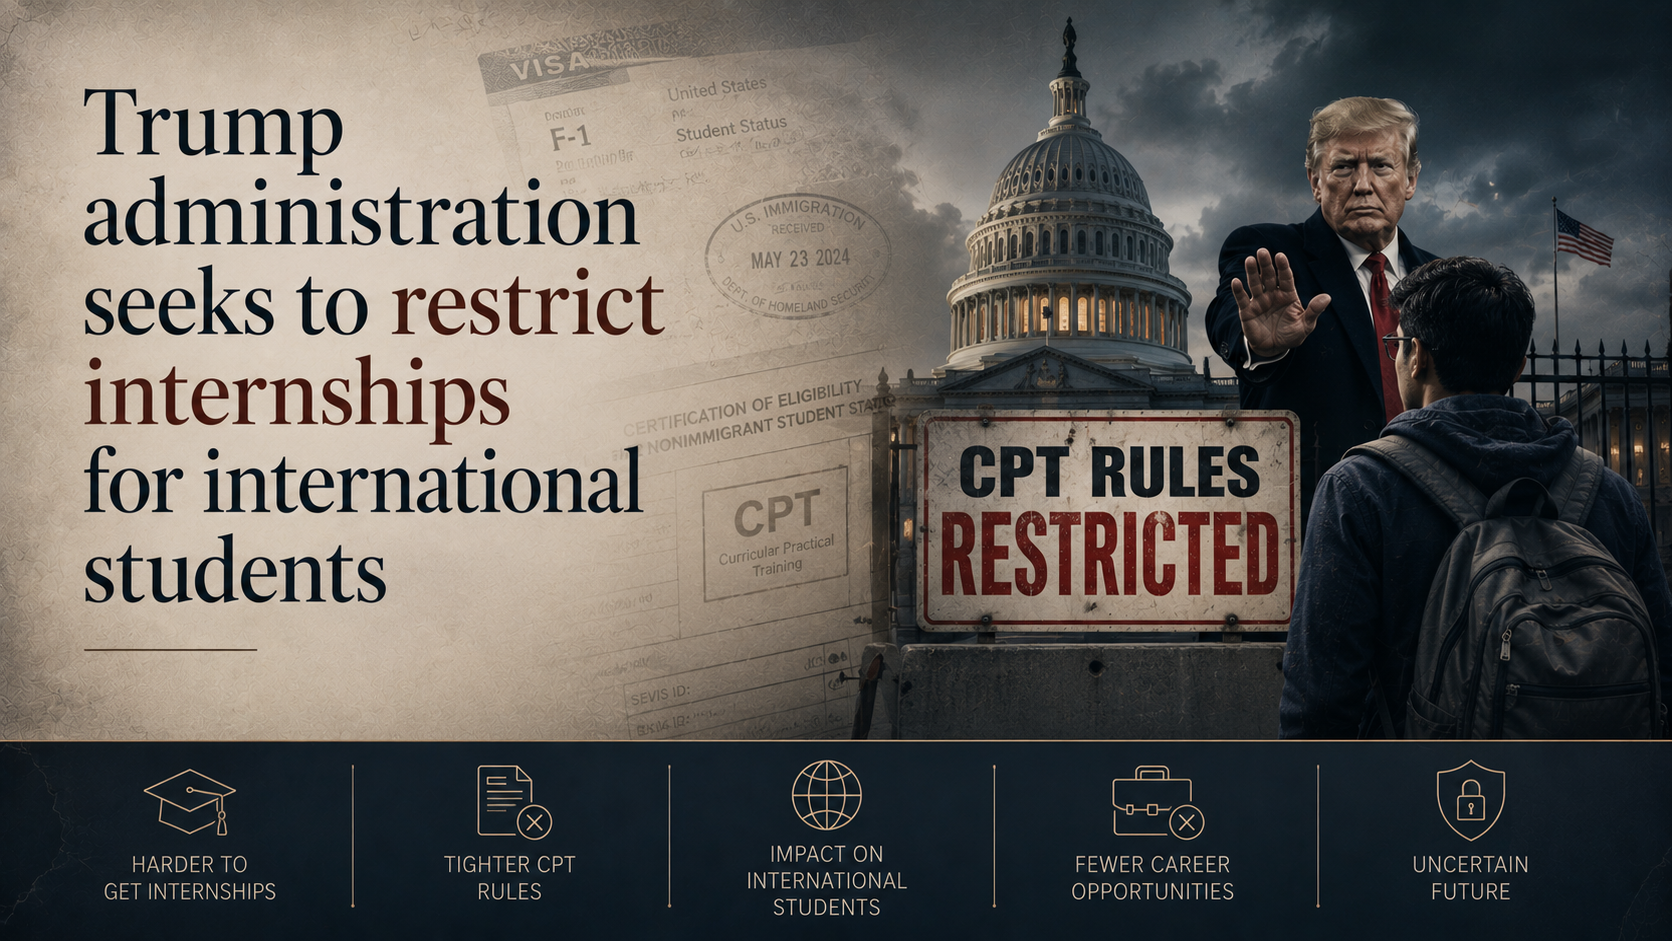
The Trump administration issued a memo, dated August 24, directing US universities to restrict Curricular Practical Training (CPT) work authorisations for international students. The Student and Exchange Visitor Program (SEVP), part of US Immigration and Customs Enforcement, said it had observed a rise in CPT authorisations that appear to violate the rule permitting CPT only where the training is an integral, curriculum-linked requirement. The memo warned that non-compliant institutions could lose certification to enrol foreign students, prompting the University of California, Los Angeles and the University of California, Berkeley to pause certain CPT applications.
Why does the CPT restriction matter for Indian students?
Indian students form a large share of the affected pool: Indian nationals are among the largest cohorts of international students in the United States, concentrated in graduate programmes in science, technology, engineering and business where CPT and its post-study counterpart, Optional Practical Training, are commonly used to gain early work experience.
CPT often bridges study and full-time employment: Many international students use CPT internships to secure the practical experience and employer relationships that later translate into full-time job offers and sponsored work visas, so tighter CPT rules narrow that pathway at its earliest stage.
Institutional caution creates immediate uncertainty: Universities such as UCLA and UC Berkeley pausing CPT applications while they review the guidance leaves currently enrolled students without a clear timeline for authorisations they may need for the coming term.
Challenges the CPT tightening creates
Ambiguity in what counts as curriculum-integral training: The memo does not precisely define the line between legitimate curriculum-linked internships and authorisations SEVP considers a violation, leaving universities to interpret the standard conservatively. Eg. UC Berkeley’s international office described the August 24 memo as “more narrow in focus” and “more restrictive in nature” than earlier guidance, without full clarity on the new threshold. Fix. SEVP could issue detailed, program-specific criteria for curriculum integration, developed in consultation with universities, rather than a general compliance warning.
Institutional risk pushes universities toward blanket caution: Because non-compliance risks an institution’s certification to enrol any foreign student, universities have an incentive to pause CPT broadly rather than assess applications individually, even where most are legitimate. Eg. UCLA paused certain CPT authorisations altogether while it determines next steps, affecting students beyond those the memo specifically targets.
What is Curricular Practical Training (CPT)?
Work authorisation tied to the curriculum: Curricular Practical Training is a work authorisation available to international students on an F-1 visa that allows off-campus employment or internships considered an integral part of an established academic curriculum, distinct from Optional Practical Training, which applies mainly after a course of study is completed.
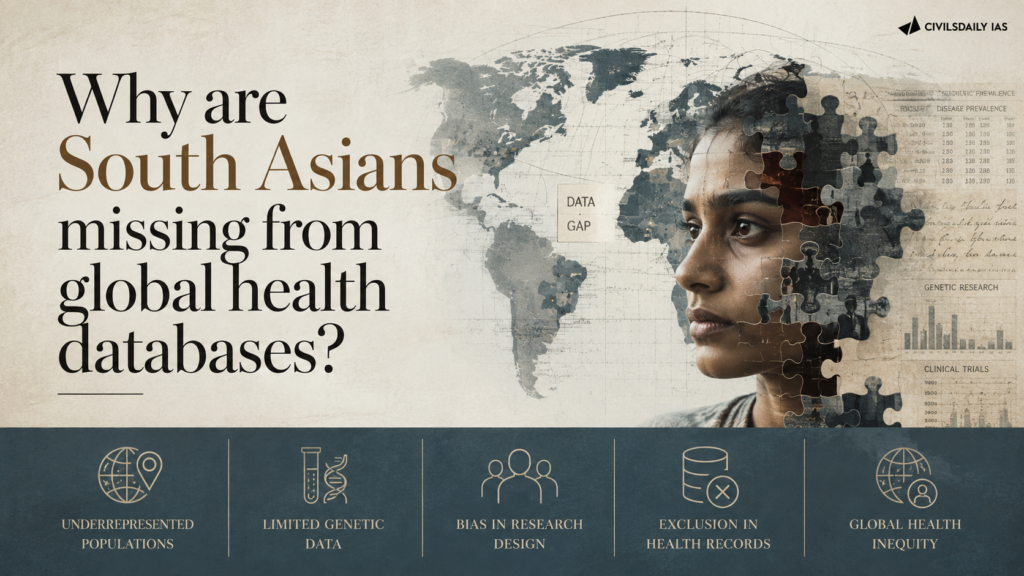
Genome wide association studies between 2005 and 2025 drew more than 86 per cent of their participants from European ancestry populations, while South Asians accounted for less than 1 per cent. That skew is now being carried into the reference atlases used to train artificial intelligence models in medicine, which converts a historical sampling gap into a bias that reproduces itself at clinical scale across South Asia and the wider low and middle income world.
What is an integrated biobank?
Definition: An integrated biobank is a large repository that stores biological samples from consenting participants alongside linked data about them, and makes both available to researchers.
What it integrates: It combines participants’ genomic information with electronic health records, environmental exposures and lifestyle data, so that genetic variation can be read against real health outcomes.
What is a genome wide association study?
Definition: A genome wide association study (GWAS) scans the genomes of many individuals to find genetic variants that occur more often in people with a particular disease than in people without it.
What it produces: It yields a list of variants statistically associated with a trait or disease, which is the raw material for downstream risk prediction tools.
What is a polygenic risk score?
Definition: A polygenic risk score combines the effects of many genetic variants associated with a disease to estimate a person’s overall genetic risk for it.
Why ancestry matters to it: The score’s weights are derived from the population it was built in, so applying it to a population with a different variant frequency structure changes its accuracy.
What is a single cell atlas?
Definition: A single cell atlas is a reference map that catalogues the gene activity of individual cells across tissues and organs, rather than of a tissue sample as a whole.
What is a low and middle income country?
Definition: Low and middle income countries are the economies classified by the World Bank below the high income threshold on gross national income per capita, a grouping used in global health to identify where disease burden and research funding diverge.
Why the category is used here: The under representation problem is stated at the level of this group, with India, Pakistan, Bangladesh and Sri Lanka as instances inside it rather than as separate cases.
What are potential years of life lost?
Definition: Potential years of life lost is a measure of premature mortality that counts the years a person would have lived had they reached a reference life expectancy.
What it captures that a death count does not: It weights a death at a young age more heavily than a death in old age, which is why it shifts burden sharply towards countries with high early mortality.
What is G6PD deficiency?
Definition: Glucose-6-phosphate dehydrogenase (G6PD) deficiency is an inherited enzyme disorder that can cause a form of anaemia when red blood cells break down under oxidative stress from certain drugs, infections or foods.
What is metabolic syndrome?
Definition: Metabolic syndrome is a clustering of obesity, raised blood sugar, abnormal cholesterol and high blood pressure that together raise the risk of cardiovascular disease and type 2 diabetes.
How large is the ancestry gap in global genomic databases?
The genome wide association study record: The GWAS Catalogue is maintained by the National Human Genome Research Institute (NHGRI) and the European Bioinformatics Institute (EBI). It records that more than 86 per cent of participants in these studies between 2005 and 2025 were of European ancestry.
The South Asian share: South Asians accounted for less than 1 per cent of participants over that same twenty year period.
The gap at the country income level: Over 90 per cent of the world’s potential years of life lost occurred in low and middle income countries. About 10 per cent of global health research funding addressed the health needs of those countries.
The share of humanity excluded: More than 20 per cent of the world is being neglected in multi modal data integration, and the exclusion denies those populations the opportunity to attain the maximal possible health.
The pattern repeats in newer tools: A study published in Cell Genomics reviewed more than 13,500 samples across three major single cell resources and found a striking and pervasive European over representation alongside under representation of Asian and Latino individuals.
The three resources reviewed: The study covered the Human Cell Atlas, the Human Tumour Atlas Network and the PsychAD Consortium.
South Asians absent from the biobanks too: South Asians remain largely absent from integrated biobanks such as the U.K. Biobank, which are the repositories that transformed biomedical research.
Why does a European skewed dataset produce worse clinical tools for South Asians?
The burden runs the other way: South Asians face higher rates of type 2 diabetes, cardiovascular disease and asthma than people of European ancestry, so the tools built on European heavy data are least accurate for the population that needs them most.
The diabetes case: More than one in ten adults globally now live with diabetes, the risk is higher for people of South Asian ancestry and it appears earlier than in many other populations.
India’s projected burden: The number of people with diabetes in India alone is projected to reach 125 million by 2045.
Risk scores lose accuracy across ancestry: A 2023 study found that polygenic risk scores for multiple sclerosis were less accurate when applied to South Asian populations.
Functional predictions are untested: Most predictions about how variants affect gene expression or cell function are inferred from European datasets, and it is not known which of those predictions hold in South Asians.
The consequence for drug discovery: This limits the ability to understand disease mechanisms and to identify drug targets relevant to South Asian populations.
Thresholds themselves need recalibration: Diagnostic thresholds, risk scores and prediction models developed predominantly from European populations require validation and, where necessary, recalibration using South Asian data.
Why can South Asia not be treated as a single genetic block?
One of the most diverse populations on earth: South Asia constitutes one of the most diverse human populations in the world, shaped by thousands of years of migration, cultural diversity, endogamy and consanguineous marriages.
Lumping erases the differences: Much existing research groups South Asians, Southeast Asians, West Asians and other Asian populations together, obscuring important differences between them.
Variation within the region: G6PD deficiency varies considerably across South Asia, with some ethnic groups in Pakistan and Afghanistan carrying the trait at much higher rates than others.
Variation within a single population: A study from Sri Lanka found that cardiometabolic risk did not fit into a single metabolic syndrome profile, and within the same population men and women showed distinct patterns of obesity, blood sugar, cholesterol and blood pressure.
The scale of Indian variation: The GenomeIndia Project has already identified more than 40 million genetic variants unique to the Indian population.
Who must be sampled: India cannot realistically be treated as one genetic block, and inclusion must extend to distinct endogamous and tribal groups rather than a few urban cohorts, since many of the harmful variants found there are not seen anywhere else.
Why is the data missing in the first place?
Infrastructure followed the money: Research funding, institutions, registries, biobanks and large population cohorts have historically been built and sustained where the money already was.
What that left behind: Low and middle income countries were left with inadequate laboratory infrastructure, inadequate biobanking facilities and too few trained personnel to run comparable studies at scale.
The imbalance is not only financial: It shapes whose problems are studied, whose questions are prioritised and whose evidence informs health policy and practice.
Ancestry classification practice: Where non European participants are recruited, they are frequently pooled into broad continental categories, which means the data collected does not resolve the differences it was collected to capture.
Why is genomic research hard for South Asian countries to prioritise?
Competing immediate needs: For most South Asian countries genomic research is difficult to prioritise against more immediate and pressing public health demands.
Infectious disease: Communicable disease control absorbs public health budgets and personnel that a genomics programme would otherwise draw on.
Maternal and child health: Maternal and child health programmes command prior claim because their outcomes are measurable within a single planning cycle.
Non communicable diseases: Treatment and screening for non communicable diseases compete for the same budget line that genomic infrastructure would need.
The mismatch in horizons: Genomic infrastructure returns value over a decade or more, while the health systems being asked to fund it are assessed on annual outcome indicators.
Why deferring is costly: Every year the region defers, the reference atlases and the models trained on them are built further without it, which raises the cost of correction later.
What genomic cohorts already exist in South Asia and why do they not add up?
GenomeIndia: India’s national population reference cohort.
Phenome India: An Indian longitudinal cohort linking health, lifestyle and clinical measurements across participants.
Longevity India: An Indian cohort focused on ageing and the biological determinants of long life.
Sri Lankan Twin Registry Biobank: A Sri Lankan registry and biobank built around twin pairs, which permits separation of genetic and environmental effects.
Pakistan Genome Resource: A Pakistani national genomic resource built on population sampling.
Why they do not combine: These independent cohorts and biobanks are mostly focused on individual diseases or specific populations, and often use different systems for collecting and storing data, which makes it difficult to bring them together for large genetic studies.
The Indian case specifically: India has several sizeable cohorts, but no harmonised system yet exists that lets researchers within and across borders work across them easily.
What does the U.K. Biobank model demonstrate that South Asian cohorts currently cannot?
United Kingdom, the integrated design: The U.K. Biobank links each participant’s genomic information to electronic health records, environmental exposure data and lifestyle data in a single resource, which is the feature that allows genotype to be read against outcome.
What that integration produced: Repositories of this design accelerated drug development, informed clinical guidelines and shaped public health policy across multiple countries, not only in the country that built them.
The contrast with South Asia: South Asian cohorts are disease specific or population specific and are stored on divergent systems, so no equivalent linkage across genomics, clinical records and exposure exists in the region.
The limit of this comparison: The U.K. Biobank is the single substantive institutional model in the evidence here, so it establishes what an integrated design makes possible, not a ranked set of alternative national models to choose between.
What does the regional proposal recommend?
The authorship: A perspective in the Lancet Regional Health – Southeast Asia, written by scientists across India, Pakistan, Bangladesh and Sri Lanka, sets out the regional response.
The core warning: The region risks being excluded from the genomic revolution unless it builds the infrastructure itself, rather than waiting for inclusion in datasets built elsewhere.
Regional collaboration between existing assets: The proposal is to build greater collaboration between existing biobanks and cohorts, rather than to construct a new central repository from scratch.
Interoperability: The aim is a system in which existing datasets can speak to each other, which is the specific technical gap that keeps Indian cohorts from being analysed together.
Inclusion of overlooked populations: Populations that have historically been overlooked, including distinct endogamous and tribal groups, are to be brought into the sampling frame.
Retained control over data use: South Asian researchers and institutions are to retain a meaningful role in how their data are used.
Benefit sharing: The researchers generating the data are to share in the scientific benefits, which addresses the extraction pattern rather than only the data gap.
Why does the gap compound rather than stay constant?
The atlases became reference maps: Single cell atlases are now the reference maps for biology and medicine, so an error in the map propagates into everything read against it.
They are now training data: Those same atlases are increasingly used to train the artificial intelligence models that will shape future research and care.
Scale changes the nature of the problem: If the underlying data continues to be skewed, the artificial intelligence models and clinical tools built on top of it will reproduce and repeat those biases at a much larger scale.
From a research gap to a clinical one: A skewed research dataset produced inaccurate studies, a skewed training dataset produces inaccurate bedside tools deployed on populations that were never in the data.
The window is closing but not shut: It is late for the region to build its own infrastructure, and it is still not too late.
Challenges to building a South Asian genomic data infrastructure
Non interoperable data standards: Existing cohorts use different collection, phenotyping and storage systems, so pooling requires retrospective harmonisation that the original consent may not permit. Eg. India’s several sizeable cohorts have no harmonised system that lets researchers work across them.
Consent and benefit sharing for community level data: Genomic data from an endogamous or tribal group carries group level implications that individual consent does not cover. Eg. The Biological Diversity Act, 2002 governs access and benefit sharing for biological resources, and its application to human genomic data drawn from identified communities is unsettled.
Sustained financing beyond donor cycles: Climate and health workforce experience across the region shows that capacity built on project funding disappears when the project ends. Eg. Genomic surveillance capacity expanded rapidly during the pandemic and contracted once the emergency funding lapsed.
Cross border data transfer rules: Regional pooling requires moving identifiable health data across national jurisdictions with differing data protection regimes. Eg. The Digital Personal Data Protection Act, 2023 permits the Central Government to restrict transfer of personal data to notified countries.
Shortage of trained personnel: Bioinformatics, genetic counselling and biobank management skills are scarce relative to the sequencing capacity being installed. Eg. Genetic counsellors in India number in the low hundreds against a population carrying a large inherited disease burden.
Risk of genetic discrimination: Widening genomic data collection without a statutory bar exposes participants to insurance and employment consequences. Eg. The Delhi High Court in United India Insurance vs Jai Parkash Tayal, 2018 held the exclusion of genetic disorders from health insurance cover unconstitutional, in the absence of any general anti discrimination statute.
Sampling reaching only urban cohorts: Recruitment gravitates to tertiary hospitals and metropolitan volunteers, reproducing inside India the same skew the region objects to globally. Eg. Inclusion of distinct endogamous and tribal groups has been identified as the specific gap in Indian sampling, not the overall sample size.
Conclusion
The under representation of South Asians in global genomic databases is no longer only an equity problem in research, it is becoming an engineering problem in clinical artificial intelligence. With more than 86 per cent of genome wide association study participants of European ancestry and South Asians below 1 per cent, the reference atlases now being used as training data carry that skew forward at scale. The response has shifted from asking for inclusion in datasets built elsewhere to building interoperable regional infrastructure that keeps control and benefit with the researchers generating the data. What remains unresolved is financing, since the region must fund a decade long investment against infectious disease, maternal and child health and non communicable disease needs that compete for the same budget.
“[2026] Which of the following statements with regard to Genome India Project is/are correct?
1. It is a part of the Human Genome Project.
2. The project is funded by the Department of Biotechnology (DBT), Government of India.
3. Its primary aim is to build a catalogue of genetic diversity of the Indian population.
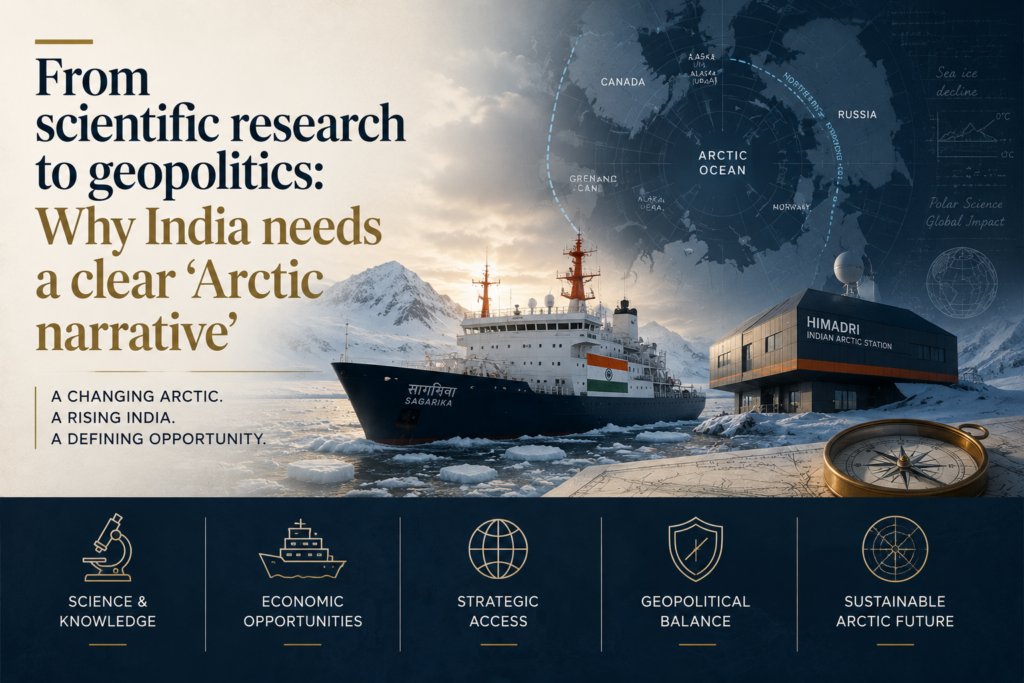
A report of the Parliamentary Standing Committee on External Affairs, titled “India’s Role and Presence in the Arctic and Antarctic Regions”, asks what India’s narrative on the Arctic actually is. The tension it exposes is that India holds a 1920 treaty entitlement, a permanent research station and a national Arctic Policy, yet funds Arctic activity at a level that contradicts every one of those claims.
What is the Svalbard Treaty of 1920 and what does it give India?
The instrument: The Svalbard Treaty of 1920 recognises Norwegian sovereignty over the Svalbard archipelago while granting all signatory states equal rights of access and economic activity there.
India’s standing: India, then part of the British Dominion, was among the original 14 signatories of the Treaty.
The practical entitlement: The Treaty entitles an Indian to visit Svalbard, an archipelago located between mainland Norway and the North Pole, without a visa and to engage in commercial ventures.
What India built on it: India remains one of only two developing countries with a permanent scientific presence in the region, through the Himadri research station at Ny-Alesund in Svalbard.
What is India’s Arctic Policy of 2022?
The framework: India notified an Arctic Policy in 2022, setting out its objectives across science, climate and environmental protection, economic and human development, transportation and connectivity, governance and international cooperation, and capacity building.
The gap it left: The Policy provided the framework but India still lacks a dedicated senior official responsible for Arctic affairs.
What is the Arctic and Indian monsoon teleconnection?
The mechanism: Rapid Arctic warming and declining sea ice alter atmospheric circulation patterns, and those altered patterns influence monsoon behaviour across South Asia.
What it affects: The chain runs from Arctic ice loss to rainfall patterns, agricultural productivity, food security and economic growth in India.
Why does the Arctic matter to India’s climate security?
Monsoon dependence is structural: India’s dependence on the monsoon remains profound, with nearly 70 percent of India’s annual rainfall coming from the southwest monsoon.
The economic base at risk: Agriculture still accounts for roughly 18 percent of India’s gross domestic product and supports more than half of its population.
The scientific link is now established: Scientific studies increasingly point to an Arctic and Indian monsoon teleconnection, so Arctic ice loss is a direct input into Indian rainfall variability.
Sea-level rise is the second pillar: The Arctic is a major contributor to global sea-level rise, and on current trends entire low-lying island states such as the Maldives face existential threats.
The regional exposure: Large parts of Bangladesh and significant stretches of India’s coastline could experience recurrent flooding and displacement, with more than 250 million people in vulnerable coastal regions of South Asia affected by mid-century.
The security consequence: Large-scale climate-induced migration from neighbouring regions would create humanitarian, social and security challenges of an unprecedented order, which moves the Arctic out of the environmental file and into the security file.
Why has the Arctic become a geopolitical arena rather than only a scientific one?
India’s partners are Arctic states: Two of India’s closest strategic partners, the United States and Russia, are Arctic nations, so Arctic policy is inseparable from India’s core bilateral relationships.
The adversary is already inside: China, described as India’s principal long-term adversary, has invested heavily in Arctic infrastructure, research and shipping despite being an extra-regional state.
The convergence of stakes: The Arctic is emerging as a battleground for major powers, with maritime access, energy security and critical mineral supply chains intersecting in the same space.
India’s existing goodwill: India maintains friendly relations with other Arctic nations, evident in the recent India-Nordic Summit.
The unanswered question: The open issue is whether India is prepared to engage at a scale commensurate with the interests it has declared.
What does China’s polar build-up show about the scale India is not matching?
China, acquisition then indigenisation: China acquired a second-hand icebreaker from Ukraine and then developed indigenous icebreaker building capability from it.
China, current fleet: China today operates several polar-capable vessels, giving it access to the wider Arctic Ocean that India lacks.
China, the next tier: China is the second country after Russia to be building a nuclear icebreaker, which is the class of asset that permits sustained independent high-latitude operations.
China, non-vessel presence: China has invested heavily in Arctic infrastructure, research and shipping despite having no Arctic coastline of its own.
Russia and the United States, incumbency: Both are Arctic littoral states and therefore hold rights in the region by geography rather than by treaty accession, which is the position India can never occupy.
What structural gaps does the Committee identify in India’s Arctic engagement?
Fragmented ownership: Responsibility for Arctic affairs is fragmented across multiple divisions of the Ministry of External Affairs, with Arctic states and Arctic Council matters handled by four different territorial and functional divisions.
No single point of accountability: The fragmentation makes a coherent whole-of-government Arctic engagement difficult, and India still lacks a dedicated senior official responsible for Arctic affairs despite having had an Arctic Policy since 2022.
No ice-class vessel: Without an ice-class research vessel, India’s scientific footprint in the Arctic remains largely confined to Svalbard.
Dependence on others for access: Access to the wider Arctic Ocean depends on collaboration with foreign partners and on the availability of chartered vessels.
The vessel that never arrived: An indigenous Polar Research Vessel (PRV), a dedicated ice-capable ship required for meaningful pan-Arctic research, was sanctioned in 2014 and is expected to be delivered only towards the end of this decade.
Why does the funding figure undercut the stated policy?
The headline number: India spent just Rs 17.53 crore on Arctic activities in 2024-25.
The internal comparison: That is less than one-tenth of India’s expenditure on Antarctica, despite the Arctic carrying the monsoon and sea-level linkages.
The external comparison: It is less than the cost of building a single kilometre of a flyover.
The exposure it is set against: The same region affects sea-level rise along India’s 11,098 km coastline and is simultaneously a climate and a geopolitical hotspot.
The contradiction stated: If the Arctic warrants a national policy, a dedicated parliamentary study and repeated diplomatic engagement with Arctic states, the budgetary commitment suggests the opposite conclusion.
Conclusion
India’s Arctic problem is not an absence of standing but an absence of capability matched to that standing. A 1920 treaty entitlement, a permanent station at Ny-Alesund and a 2022 Arctic Policy establish the claim, while four scattered ministry divisions, no dedicated official, no ice-class vessel and Rs 17.53 crore a year establish the limit. The Parliamentary panel has identified the gaps, and the outstanding task is the conversion of policy into capability.
“[2018, GS1, 10 marks] Why is India taking keen interest in resources of Arctic Region?”
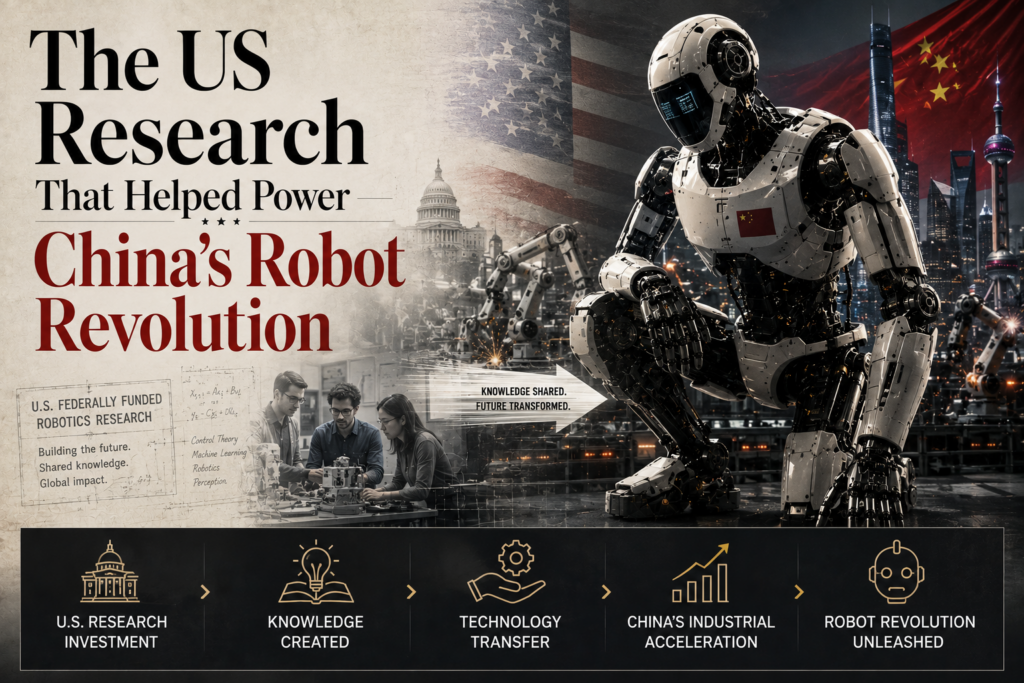
China’s Unitree Robotics based the designs of its most successful quadruped robots on breakthroughs financed by the United States Army Research Laboratory, according to a former United States defence technology official and three researchers involved in the programme. The findings were published openly to advance the field, and the country that funded them has no mass producer of such robots, while the company that scaled them is now on the Pentagon’s list of Chinese military companies.
What is the Robotics Collaborative Technology Alliance?
What it was: The Robotics Collaborative Technology Alliance (RCTA) was a United States Army funded research consortium that ran from 2010 to 2020.
Funding body: It was financed by the DEVCOM Army Research Laboratory (ARL) alongside other military programmes.
Participants: It gathered government, academic and industry researchers from the University of Pennsylvania, the Massachusetts Institute of Technology (MIT), Boston Dynamics and NASA’s Jet Propulsion Laboratory, among other research institutions.
Lead commercial partner:General Dynamics Land Systems, the Michigan based defence manufacturer that builds Abrams M1 tanks.
Publication practice: The programme’s findings were published openly to stimulate progress in the field, which is common practice in publicly funded research.
What is an actuator?
Definition: An actuator is the component that converts electrical power into the movement of a robot’s joint, combining a motor, a gearbox and control electronics.
Why it decides the design: Actuator torque, weight and cost set what a legged robot can do and what it costs, which is why an actuator design published in detail is effectively a manufacturing blueprint.
What is DARPA?
Definition: The Defense Advanced Research Projects Agency (DARPA) is the United States Department of Defense agency that funds high risk, early stage technology research with potential military application.
Role here: DARPA financed the MIT laboratory work on which the later Army funded University of Pennsylvania advances were built.
How did Army funded research travel from the laboratory to a Chinese manufacturer?
2016, motors moved into the legs: University of Pennsylvania researchers eliminated heavy central gearboxes and placed motors in the robots’ legs, which improved the machine’s ability to sense and respond to terrain.
Built on DARPA funded work: That advance built on the MIT laboratory’s earlier work financed by DARPA.
2019, the Mini Cheetah: The MIT laboratory presented the Mini Cheetah, adding strength and the ability to perform backflips to the University of Pennsylvania features.
The thesis that carried the design: Months earlier, an MIT researcher published a master’s thesis detailing the Mini Cheetah’s actuators.
Copies within six months: Chinese firms were manufacturing actuator copies purchasable on the online retailer AliExpress within six months of that publication.
Dimensional match: The dimensions of Unitree’s popular Go series were almost identical to the millimetre to the Mini Cheetah, per the MIT researcher involved in developing it.
The scale product: The Army funded project became the first Unitree robot that had any kind of scale, per a former University of Pennsylvania researcher on the programme.
2023, the price point: Unitree’s $1,600 Go2 model, launched in 2023, let the company rapidly dominate the global quadruped robot market. Unitree was founded in 2016, three years before the Mini Cheetah was presented.
What does the scale gap look like in numbers?
Unitree’s volumes: The company sold more than 5,500 humanoids and 18,000 quadrupeds last year, per company filings.
Valuation: Unitree is valued at about $9 billion ahead of its stock market debut, and its Shanghai initial public offering drew frenzied demand.
United States output: No United States company has mass produced such robots, including Tesla, which has displayed prototypes of its Optimus humanoid for years.
A different technology base: Boston Dynamics’ 2019 canine robot Spot used different technology from the Army funded line.
The domestic commercialiser:Ghost Robotics commercialised the United States breakthroughs and supplies United States special forces with ruggedised robots, but its production is small and costly compared with Unitree’s.
Why did the United States not capture the market it created?
Capital preference: United States venture capital prefers high return software startups, which a robotics analyst described as a dropped ball on commercialising domestic research.
Missing industrial inputs: The United States excels in innovation and software development but needs the capital, industrial base, highly skilled workforce and parts supply chains to scale up breakthroughs, per the dean of Penn Engineering.
No production support after the research ended: The Army funded project kick-started the United States quadruped industry, but without support for large scale production Unitree consumed that space, per the former Army Research Laboratory director who oversaw it.
Price competition threatens incumbents: Boston Dynamics argued in a Congressional hearing that China’s low pricing would drive United States firms out of the market.
Asymmetry of actors: The contest is between private United States companies and a coordinated Chinese national strategy, per the founder of Ghost Robotics.
What structural advantages does China’s manufacturing model carry?
A stated ten year industrial plan: In 2015, China’s leadership set out a ten year plan to lead industries including green energy, electric vehicles and robotics.
Tolerance for losses: Capital has since been channelled into risky bets on low margin advanced manufacturing.
Critical minerals dominance: Rapid reverse engineering draws on China’s dominance in refining the critical minerals needed for magnets in robotics applications.
Supplier density: Motors, gears and the artificial muscles known as actuators are supplied by a dense cluster of firms near Unitree’s base in Hangzhou.
The pattern is not new: Backed by subsidies and component factory clusters, Chinese firms have already seized market share in solar panels, drones, electric vehicles and quantum communications, many of them first developed in the United States with government or military backing.
How have United States authorities responded?
June, Pentagon listing: The Pentagon added Unitree to its list of Chinese military companies, calling it a contributor to the Chinese defence industrial base.
Effect of the listing: The designation falls short of a sanction but limits the United States military’s future use of Unitree technology.
July, import ban: The Federal Communications Commission (FCC) banned imports of future models of foreign made humanoid and quadruped robots, including those from Unitree.
Chinese response: China has threatened to retaliate against the FCC ban, and its Washington embassy accused the United States of abusing administrative power and of market distortion and unilateral bullying.
Company position: Unitree has said its robots are for civilian use, and one Unitree robot has been shown on Chinese state television armed and accompanying People’s Liberation Army troops on an exercise.
Should publicly funded research be published openly when a rival scales it faster?
Nothing was taken improperly: Unitree did nothing underhanded in using the Army research, since the programme’s findings were published openly by design.
The funder’s own defence: The Army Research Laboratory stated the research strengthened the broader United States robotics ecosystem and informed subsequent work across government and the private sector.
Researchers reject secrecy: None of the United States robotics researchers involved advocated keeping such government financed research secret, arguing publication is important to scientific and technological advancement.
Their alternative prescription: Policymakers should focus on enabling companies to commercialise such advances quickly enough to compete.
Trade barriers are insufficient: Most experts supported the import ban but said the policy alone cannot build an industry capable of catching up, since it would take more than trade barriers to boost robotics manufacturing.
Challenges to commercialising publicly funded robotics research
Open publication transfers advantage immediately: A detailed design published for scientific benefit is also a manufacturing specification, e.g. actuator copies drawn from the Mini Cheetah thesis were on sale within six months.
Hardware startups cannot match software returns: Venture funding avoids capital heavy, low margin manufacturing, e.g. Ghost Robotics supplies United States special forces but produces at small volume and high cost.
No domestic component cluster: Motors, gears and actuators must be sourced abroad when no local supplier base exists, e.g. the supplier density around Hangzhou has no United States equivalent.
Critical mineral chokepoint: Magnet grade rare earths are refined almost entirely in one country, e.g. China’s April 2025 export controls on rare earth magnets disrupted automotive and electronics production worldwide.
Trade restrictions do not create capacity: A ban removes a supplier without creating a substitute, e.g. the FCC July ban covers future imported models while no United States firm mass produces quadrupeds.
Dual use ambiguity complicates policy: A civilian product can appear in a military role without the manufacturer changing its position, e.g. an armed Unitree robot appeared with People’s Liberation Army troops on state television while the company maintains its robots are civilian.
Price competition ends domestic production: Cheaper imports remove the volume a domestic manufacturer needs to survive, e.g. Boston Dynamics warned a Congressional hearing that China’s pricing would drive United States firms out.
Conclusion
Publicly funded, openly published United States military robotics research became the design basis for the world’s largest quadruped robot manufacturer, based in China. The failure was not in the research or in its disclosure but in the absence of capital, supplier depth and skilled manufacturing capacity to commercialise it domestically. Export bans and military company listings restrict a competitor’s access without supplying any of those three, so the structural gap remains open.
Question (2024, GS2): “The West is fostering India as an alternative to reduce dependence on China’s supply chain and as a strategic ally to counter China’s political and economic dominance. Explain this statement with examples.
Linkage: This touches upon the global strategic response to China’s “revolution” in manufacturing and technology, highlighting the shift to move away from Chinese-dominated supply chains.
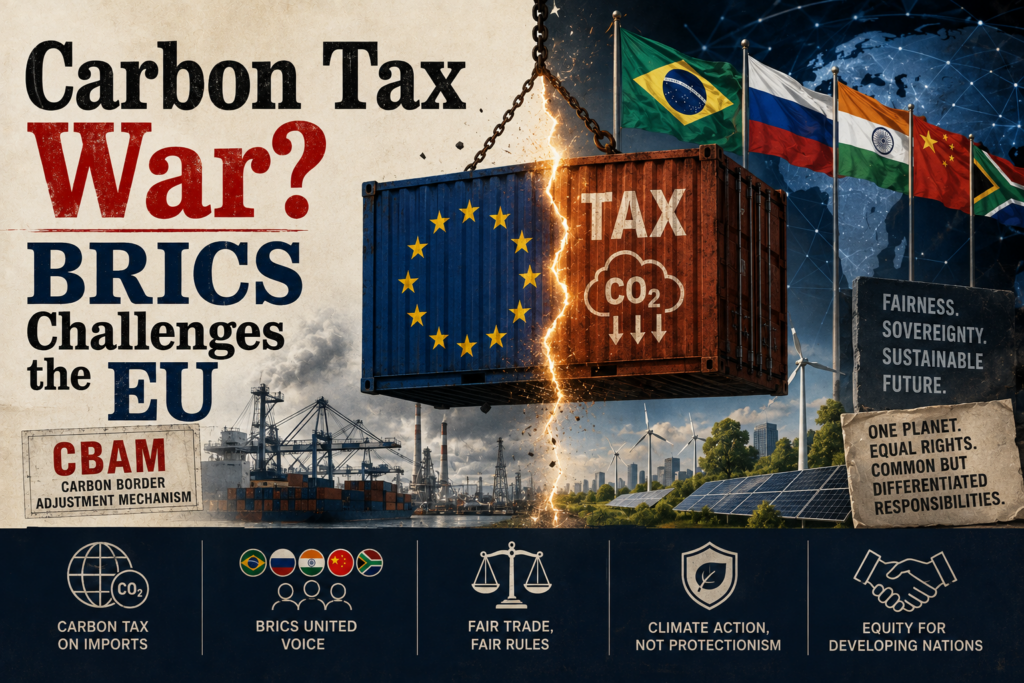
Environment and climate Ministers of the BRICS grouping adopted a joint statement opposing “unilateral, punitive, discriminatory and protectionist” climate measures, naming the European Union’s Carbon Border Adjustment Mechanism (CBAM) among them. The statement lands in the first year in which CBAM actually charges money at the border, which converts an internal European climate instrument into a live trade cost for developing country exporters. The same document demands that developed countries deliver the adaptation finance they have already promised, linking the objection on trade to a claim on money.
What is the Carbon Border Adjustment Mechanism (CBAM)?
Definition: CBAM is an import levy on carbon intensive goods entering the European Union, priced against the emissions embedded in their production. It makes an importer pay for the carbon released abroad at the same price a European producer pays at home.
Mechanism: Importers must purchase and surrender CBAM certificates matching the emissions embedded in each consignment. The certificate price is tied to the European carbon allowance price.
Covered sectors: The mechanism applies to importers of iron and steel, aluminium, cement, fertilizers, hydrogen and electricity, the six sectors treated as most exposed to carbon costs.
Timeline: CBAM was rolled out on 1 October 2023 with a reporting only phase, during which importers declared embedded emissions without paying. It entered its definitive phase from 1 January 2026, when the obligation to buy and surrender certificates began.
Stated purpose: The European Union presents the measure as a means of preventing carbon leakage and of ensuring that its own climate ambition does not simply displace production abroad.
What is carbon leakage?
Definition: Carbon leakage is the shifting of carbon intensive production outside a jurisdiction because that jurisdiction’s climate policy raises production costs there and not elsewhere. Global emissions do not fall, they relocate.
Why it drives border measures: A domestic carbon price without a border charge leaves domestic producers competing against untaxed imports. The border charge is the instrument used to close that gap.
What is common but differentiated responsibilities and respective capabilities (CBDR-RC)?
Definition: CBDR-RC is the founding principle of the international climate regime under which all countries share responsibility for the climate problem, but not equally. Obligations are calibrated to a country’s historical contribution to emissions and to its present capacity to act.
How it was invoked here: The joint declaration used CBDR-RC to argue that all cooperation commitments, from forest fire protocols to circular economy standards, remain voluntary and calibrated to each country’s national circumstances.
What is the New Collective Quantified Goal (NCQG)?
Definition: The New Collective Quantified Goal is the post 2025 climate finance target agreed under the climate convention, replacing the earlier annual finance commitment made to developing countries. It fixes how much money developed countries must mobilise, and for what.
The specific commitment at issue: The Ministers urged wealthy nations to deliver on the NCQG reached at the 30th Conference of the Parties (COP30) held at Belem, Brazil, including the commitment to triple adaptation finance to developing countries by 2035.
What did the 12th BRICS Environment Ministers’ Meeting actually decide?
Venue and chair: The 12th BRICS Environment Ministers’ Meeting was held in New Delhi under India’s chairship, and adopted its positions through a joint statement.
Participation: Environment and climate Ministers and senior officials from eleven countries took part: Brazil, Russia, India, China, South Africa, the United Arab Emirates, Indonesia, Iran, Saudi Arabia, Egypt and Ethiopia.
Position on border measures: Ministers recorded concern that carbon border measures such as CBAM “undermine developing countries’ efforts to address climate change and build resilience”, placing that language in the adaptation and climate resilience section of the statement.
Quality of finance demanded: Support from developed countries must be “new, additional, predictable, adequate and accessible”, delivered through grants and concessional finance and without adding to the financial vulnerabilities of developing countries.
Technical basis: The statement marked the culmination of a year of technical work by the BRICS Environment Working Group and its Contact Group on Climate Change and Sustainable Development.
Handover: India formally handed hosting duties for the 13th edition to China, which will lead the meeting in 2027.
Why does the definitive phase matter so much for India’s exports?
Concentrated exposure:Iron and steel account for about 90 percent of India’s exports to the European Union that fall within the CBAM framework, so a sectoral measure operates as a single sector measure for India.
Evidence of behavioural change already: A June 2026 analysis in Nature Climate Change, built on shipment level trade data and facility level emissions estimates, found that high emission Indian steel firms cut their export quantities and revenues to the European Union during the reporting phase, while lower emission firms held their export levels.
Cost now real, not notional: During the reporting phase the obligation was informational. From 1 January 2026 the exporter’s emissions intensity translates directly into a certificate purchase by the buyer.
Collision with the trade opening: The BRICS position arrives as India and the European Union move to implement a free trade agreement negotiated earlier this year, so tariff concessions on one track sit beside a new carbon related compliance cost on the other.
Adaptation finance is the counterweight: Adaptation finance is used to help countries and communities cope with climate impacts, including measures to strengthen water security, agriculture and infrastructure, which is the ground on which the bloc pressed its finance claim.
What do other jurisdictions’ carbon border and pricing measures show?
United Kingdom: A UK CBAM is legislated to begin on 1 January 2027, covering aluminium, cement, fertilisers, hydrogen and iron and steel. It uses a fixed sectoral levy rate linked to the UK carbon price rather than tradable certificates, and it excludes electricity.
European Union: The border charge is paired with the phase out of free allowances under the EU Emissions Trading System between 2026 and 2034. The design feature that matters is the pairing: the border cost rises as European industry loses its free permits.
China: The national Emissions Trading Scheme was expanded in 2025 from power generation to steel, cement and aluminium. A domestic carbon price gives exporters a payment that can be set off against a border charge, converting revenue that would otherwise leave the country.
Turkey: Legislation in 2025 created a national Emissions Trading System explicitly to retain carbon revenue domestically instead of surrendering it to the European border charge.
United States: There is no federal carbon price. Proposals such as the Foreign Pollution Fee Act would levy an import charge based on emissions intensity relative to United States producers, a border measure with no domestic carbon price behind it.
Where does the BRICS position pull against its members’ own choices?
Objection and integration run together: The bloc calls the measure protectionist while India simultaneously implements a free trade agreement with the same partner, so the objection is lodged inside a deepening trade relationship rather than outside it.
A domestic carbon price weakens the objection: Members building their own carbon markets, including India and China, gain a set off against CBAM only by adopting the very instrument they describe as an imposition.
The measure is producing decarbonisation, unevenly: Lower emission Indian steel firms held their European market share while high emission firms retreated, which is the outcome CBAM claims to seek and the outcome that concentrates the cost on the least prepared producers.
Voluntary cooperation limits the bloc’s own leverage: Insisting that every cooperation commitment stays voluntary and nationally calibrated protects policy space, and it also denies the bloc a collective standard it could offer as an alternative to CBAM.
Finance and trade are separate tracks: Tripling adaptation finance by 2035 does not compensate an exporter for a certificate cost paid in 2026, so the two demands in the statement address different constituencies.
Challenges to the Carbon Border Adjustment Mechanism
Extraterritorial reach without representation: The charge is designed by a regulator that exposed exporters have no vote over. e.g. iron and steel form about 90 percent of India’s CBAM covered exports to the European Union, so a single foreign rulebook governs the bulk of that trade.
Measurement and verification burden: Embedded emissions must be computed at installation level and verified, which small suppliers cannot do unaided. e.g. small Indian foundries and rolling mills supplying European buyers must commission third party verification that costs more than their margin on the consignment.
Carbon price divergence: A domestic carbon payment offsets the certificate cost only to the extent of its price. e.g. prices under India’s Carbon Credit Trading Scheme are expected well below the European allowance price, leaving a large residual charge.
Resource shuffling: A producer can reallocate output rather than cut emissions. e.g. a steelmaker can route its cleanest electric arc furnace line to the European Union and its blast furnace output to West Asia, lowering the reported figure without lowering total emissions.
Downstream coverage gap: The mechanism covers raw materials but not most finished goods made from them. e.g. imported cars and machinery containing steel escape the charge while imported steel does not, creating an incentive to relocate downstream manufacturing outside the bloc.
Trade law exposure: Developing countries argue the measure conflicts with the differentiation principle of the climate convention and with core trade disciplines. e.g. CBAM has been repeatedly contested in the World Trade Organization’s Committee on Trade and Environment by India, China, Brazil and South Africa.
Revenue destination: The proceeds accrue to the imposing jurisdiction, not to the exposed exporter’s transition. e.g. CBAM revenue flows to the European Union budget while the BRICS statement asks for grant based adaptation finance, so the money moves in the opposite direction to the demand.
Conclusion
The definitive phase has converted a European domestic carbon price into a border cost carried largely by developing country exporters, and the BRICS statement is the first collective effort to frame that as a breach of differentiated responsibility rather than a technical trade irritant. The demand for tripled adaptation finance by 2035 sits alongside the objection because the bloc treats the two as one bargain. What remains unresolved is that neither the objection nor the finance demand reduces the certificate cost an Indian steel exporter pays in 2026, and only a credible domestic carbon price and lower emissions intensity will do that.
Question (2025, GS3): “What are the challenges before the Indian economy when the world is moving away from free trade and multilateralism to protectionism and bilateralism? How can these challenges be met?” Linkage: The BRICS statement explicitly labels CBAM as a “protectionist” measure that converts a climate instrument into a trade cost, directly illustrating the challenge of rising protectionism.
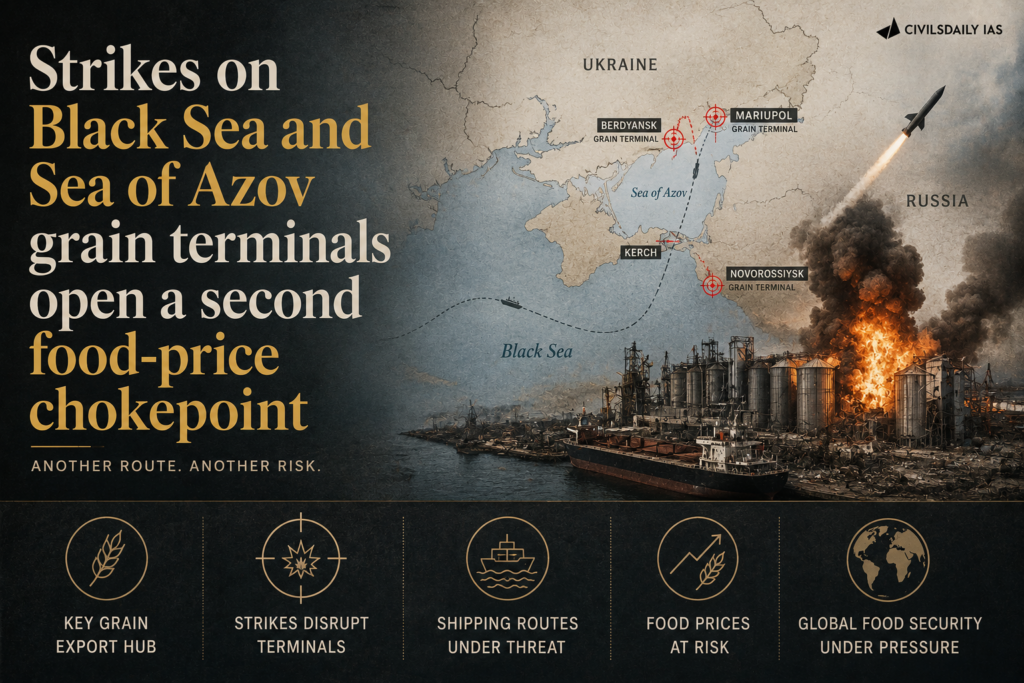
A Ukrainian drone strike on 11 August destroyed two major grain export terminals at Russia’s Novorossiysk port, removing 15.6 million tonnes (mt) of annual export capacity. This opens a second global trade chokepoint alongside the Strait of Hormuz, shifting the food security crisis from a production problem to a shipping/transit blockade.
Key Geography & Infrastructure
Black Sea & Sea of Azov Grain Corridor: Primary maritime route for Russian and Ukrainian agricultural exports via the Kerch Strait and Turkish Straits.
Novorossiysk: Major Russian Black Sea port handling bulk grain shipments.
Kerch Strait: The sole, narrow maritime outlet connecting the Sea of Azov to the Black Sea (a classic single point of failure).
Greater Odesa Port Complex: Ukraine’s main shipping hub (Odesa, Chornomorsk, Pivdennyi), handling ~90% of its agricultural exports.
Izmail: Ukraine’s primary Danube River port, serving as an alternative inland waterway route.
Regional Dependence & Export Weight
Russian Routing: Over 80% of Russian grain exports move through Sea of Azov and Black Sea ports.
Ukrainian Routing: The Greater Odesa complex handles about 90% of Ukraine’s agricultural exports.
Global Wheat Share:Russia and Ukraine combined account for 27.4% of global wheat exports.
Global Sunflower Oil Share: Russia and Ukraine combined supply 61.5% of global sunflower oil shipments, the highest concentration of any commodity.
Other Staples: Together they control 15.8% of global barley and 12.5% of global corn shipments.
Causes of the Global Price Shock
Shipping Bottleneck, Not Output Deficit:Granaries are full in Russia and Ukraine, but cross-border strikes have created severe risk, stopping safe physical transport.
Soaring Insurance Premiums:War risk cover on hulls and cargo acts as a hidden tariff, driving up freight costs and pricing out smaller buyers.
Compounding EU Crop Yield Reductions (USDA Data):
Wheat: Projected to drop 7.5% (down to 134.2 mt).
Corn: Expected to drop to 50.2 mt (a nearly two-decade low).
Cause:Record summer heatwaves and prolonged drought cut yields across Europe.
Global Repricing:CBOT wheat and corn futures rose 4–5% following the strikes. Major alternative exporters (US, Canada, Australia) saw prices surge simultaneously.
Impact on India & Domestic Policy Measures
Key Exposures
Edible Oil Risk: India is the world’s largest vegetable oil importer and heavily relies on Black Sea sunflower oil.
Dual Chokepoint Strain: Simultaneous disruptions in the Strait of Hormuz (energy/fertilizers) and Black Sea/Kerch Strait (food/edible oils).
Statutory & Policy Framework
Essential Commodities Act, 1955: Regulates production, stock limits, and distribution of foodstuffs and edible oils.
National Food Security Act (NFSA), 2013: Guarantees subsidized foodgrains to ~two-thirds of India’s population.
Foreign Trade (D&R) Act, 1992: Legal framework for export bans, quotas, and Minimum Export Prices (MEP).
Customs Tariff Act, 1975: Regulates import duty structures on crude and refined edible oils.
Key Interventions:Open Market Sale Scheme (OMSS), Price Stabilisation Fund (PSF), Pradhan Mantri Garib Kalyan Anna Yojana (PMGKAY), and the National Mission on Edible Oils – Oil Palm (NMEO-OP).
Key Institutional Concepts
FAO Food Price Index: A monthly index tracking international market prices of five commodity groups (Cereals, Vegetable Oils, Dairy, Meat, Sugar), weighted by export shares. Hosted by the Food and Agriculture Organization (HQ: Rome, established 1945).
Chicago Board of Trade (CBOT): Premier futures exchange establishing global benchmark prices for wheat, corn, and soybeans.
USDA WASDE Report:World Agricultural Supply and Demand Estimates; the primary global benchmark for crop yields and trade shares.
Maritime Chokepoint: A narrow, strategic passage (e.g., Turkish Straits, Kerch Strait, Strait of Hormuz, Bab el-Mandeb) where high volumes of global trade pass, creating high geographical vulnerability.
“[2024, GS3, 15 marks] Elucidate the importance of buffer stocks for stabilizing agricultural prices in India. What are the challenges associated with the storage of buffer stock? Discuss.”
A US presidential memorandum allows vetted private companies to participate in government-authorised offensive cyber operations against overseas transnational criminal organisations (TCOs).
Note: Vetted private firms are privately owned companies that have passed thorough background checks by a client, usually a government agency, to prove they are safe, reliable, and qualified to do sensitive work
What does the memorandum allow?
Private participation: Selected firms can conduct hacking operations under government supervision.
Permitted actions: Operations may include entering, disabling or destroying criminal networks’ systems.
Oversight: Firms require government contracts, security vetting and supervision.
Targets: Criminal organisations attacking US persons or interests, excluding entities formally controlled by foreign governments.
Key Concepts
TCO: Criminal network operating across national borders.
Offensive cyber operation: Entering, disrupting or destroying another computer system.
Attribution: Identifying the actor responsible for a cyberattack.
Hacktivist: Non-state actor conducting cyber operations for political or ideological purposes.
Why is it controversial?
Misattribution: Attacks may hit innocent third-party systems.
Collateral damage: Destructive operations can affect infrastructure in other countries.
Escalation: Private hacking can trigger cross-border conflicts.
Accountability: Commercial actors may have weaker accountability than state agencies.
Proxy problem: It resembles the private or proxy cyber models the US has criticised in China and Russia.
Implications for India
India has no publicly declared offensive cyber doctrine.
Sections 43 and 66 of the IT Act, 2000 criminalise unauthorised access and damage.
Compromised Indian servers could become staging infrastructure for foreign cyber operations.
India continues to advocate state responsibility and opposition to cyber proxies at the UN.
Prelims Pointers
CERT-In: National agency for cyber incident response.
NCIIPC: Protects Critical Information Infrastructure.
I4C: Coordinates India’s response to cybercrime.
Defence Cyber Agency: Handles cyber operations for the armed forces.
Section 70B, IT Act: Provides the statutory basis for CERT-In.
[2022, GS3, 10 marks] What are the different elements of cyber security? Keeping in view the challenges in cyber security, examine the extent to which India has successfully developed a comprehensive National Cyber Security Strategy.”
[2017] In India, it is legally mandatory for which of the following to report on cyber security incidents? 1.Service providers 2.Intermediaries 3.Corporate bodies Select the correct answer using the code given below:
PYQ Relevance[UPSC 2017] The question of India’s Energy Security constitutes the most important part of India’s economic progress. Analyse India’s energy policy cooperation with West Asian countries Linkage: The PYQ directly examines the linkage between India’s energy security, economic growth and energy cooperation with West Asian countries. The article shows how sustained diplomatic engagement with West Asian partners, diversification of energy suppliers and strategic preparedness enabled India to maintain energy supplies and limit the economic impact of the West Asia crisis.
Mentor’s Comment
India’s fuel and LPG prices rose only marginally during the recent West Asia crisis even though the country imports nearly 90% of its crude oil through routes exposed to the Strait of Hormuz. This price resilience concealed a ₹74,781 crore loss absorbed by state-run Oil Marketing Companies, exposing the fiscal cost hidden behind India’s energy security architecture.
Why did India appear structurally vulnerable to the West Asia energy shock?
Import dependence: India imports almost 90% of its crude oil and is heavily dependent on the Gulf for oil, gas, and fertilizers.
Third-largest oil importer: India ranks as the world’s third-largest oil importer, making it directly exposed to any disruption at the Strait of Hormuz.
Historical precedent of instability: Sharp oil price increases have historically been a major source of macroeconomic instability for India, as seen in the 1973 oil shock and the 1991 balance-of-payments crisis.
Sharp initial price signals: The Indian crude basket crossed $120 per barrel within weeks of the crisis. The import-linked cost of a domestic LPG cylinder rose above ₹1,600. War-risk premiums on shipping escalated sharply.
Compounding risk factors: Rising freight costs and maritime risk combined with crude dependence to create the conditions for a severe external shock.
How resilient was India’s fuel pricing compared to global peers?
Petrol price comparison: Petrol prices in India rose by only 7.5% during the crisis. Germany saw a rise of nearly 14%, the U.K. 19%, the U.S. 45%, Pakistan and the Philippines over 50%, and Myanmar almost 90%.
Diesel price comparison: India limited diesel price increases to just 8%. The UAE, a crude-producing country, saw diesel prices surge by about 85%.
LPG affordability: A domestic LPG cylinder in India cost ₹942, and ₹642 for Ujjwala beneficiaries, despite India importing nearly 60% of its LPG requirement.
Regional LPG comparison: India’s LPG price remained cheaper than in Pakistan, Nepal, and Sri Lanka, and dramatically lower than in the U.S., Australia, and Canada.
Did India’s price stability represent genuine resilience or a deferred fiscal cost?
Scale of losses: State-run Oil Marketing Companies incurred ₹74,781 crore in losses on petrol, diesel, and LPG sales up to June 30 as global crude prices surged.
Absorption over pass-through: The government and public-sector OMCs chose to absorb the price shock rather than pass it fully to consumers.
Trade-off exposed: Consumer price stability was protected at the direct cost of OMC balance sheets, converting a market shock into a fiscal one.
Limits of the model: This absorption capacity depends on OMC financial health and government fiscal space. A prolonged or repeated shock would test the sustainability of this approach.
What structural preparations enabled India to absorb the shock?
Diplomatic relationships as energy security: Decades of engagement with Iran and Gulf partners kept communication channels open during peak tensions. Iran facilitated the movement of Indian ships and Gulf producers continued energy supplies.
Supplier diversification: Energy partnerships with Russia, the U.S., Africa, and Latin America gave India flexibility to withstand disruption that was unavailable in earlier crises.
A decade of energy planning: Higher ethanol blending, an expanding renewable energy base, larger strategic reserves, and stronger refining capacity built layered resilience over time.
Whole-of-government coordination: The Ministries of External Affairs, Petroleum and Natural Gas, and Ports, Shipping and Waterways, along with the Indian Navy and the National Security Council Secretariat, coordinated to monitor risk, manage logistics, and protect supply.
What does this episode signal for India’s future energy security strategy?
Preparation precedes crisis: Resilience was the product of choices made years before the crisis, not of measures adopted during it.
Foreign policy as an energy security tool: Diplomatic outreach functioned as a substitute for physical reserves during the acute phase of the crisis.
Unresolved fiscal question: The crisis did not resolve the tension between consumer price protection and OMC financial sustainability. It only deferred that cost.
Framing for national strategy: The episode is positioned as a template for future energy resilience under the government’s ‘Viksit Bharat’ framing.
Conclusion
India’s resilience during the West Asia crisis was not accidental. It was the outcome of a decade of supplier diversification, sustained diplomatic engagement with Iran and Gulf producers, strategic reserve-building, and whole-of-government coordination. This resilience, however, was purchased through a ₹74,781 crore fiscal absorption by public-sector Oil Marketing Companies rather than a costless outcome. The crisis therefore validates India’s energy security architecture while leaving open the question of how long consumer price insulation can be sustained through OMC losses if shocks recur or persist.
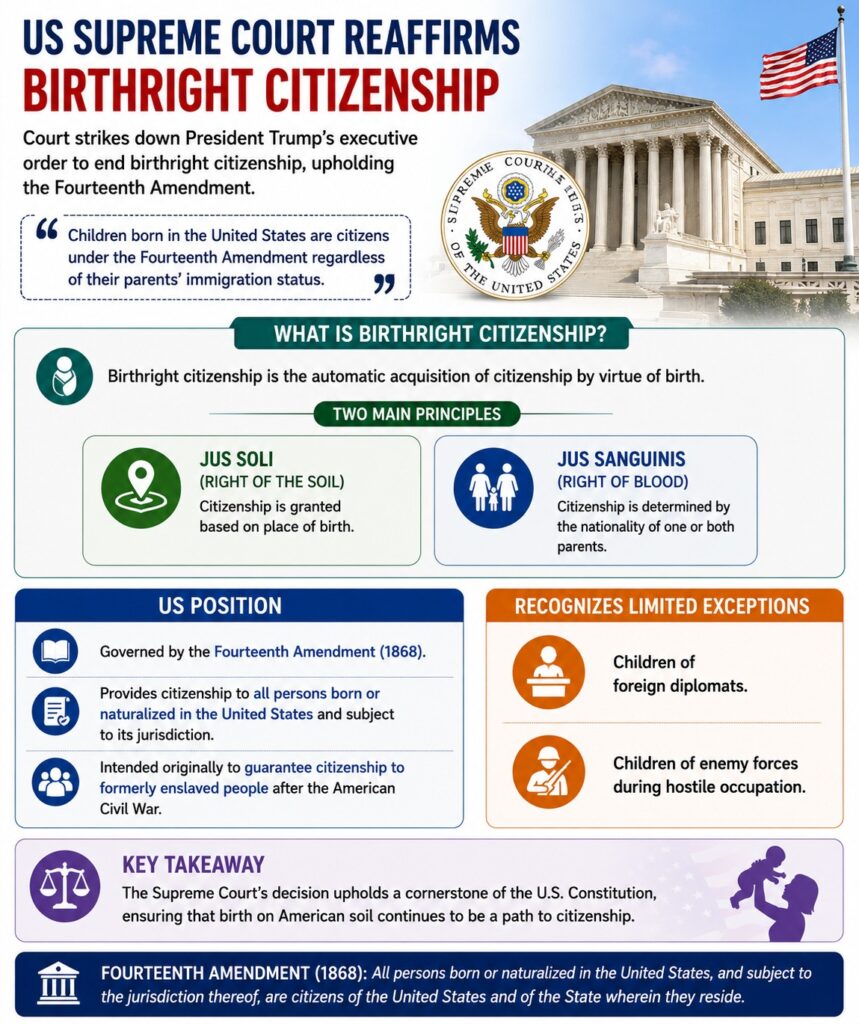
The US Supreme Court struck down President Donald Trump’s executive order seeking to end birthright citizenship, reaffirming that children born in the United States are citizens under the Fourteenth Amendment regardless of their parents’ immigration status.
What is Birthright Citizenship?
Birthright citizenship is the automatic acquisition of citizenship by virtue of birth. There are two main principles:
Jus Soli (Right of the Soil): Citizenship is granted based on place of birth.
Jus Sanguinis (Right of Blood): Citizenship is determined by the nationality of one or both parents.
US Position
Governed by the Fourteenth Amendment (1868).
Provides citizenship to all persons born or naturalized in the United States and subject to its jurisdiction.
Intended originally to guarantee citizenship to formerly enslaved people after the American Civil War.
Recognizes limited exceptions: Children of foreign diplomats. Children of enemy forces during hostile occupation.
[2021] With reference to India, consider the following statements: 1. There is only one citizenship and one domicile. 2. A Citizen by birth only can become the Head of State. 3. A foreigner once granted the citizenship cannot be deprived of it under any circumstance. Which of the statements given above is/are correct?
At the Bonn climate talks, Turkey proposed raising the global electrification target to 35% by 2035, ahead of hosting COP31 in Antalya with Australia in November. Electricity meets only a small fraction of the world’s energy needs, and most of that electricity is itself generated from fossil fuels. This exposes a gap between rising clean electricity generation and the much slower pace at which economies actually switch their energy consumption to electricity.
Where does electrification fit among existing global climate goals?
Paris Agreement temperature targets: The 2015 Paris Agreement commits the world to limiting the rise in global temperatures within 2 degrees Celsius, preferably 1.5 degrees Celsius, from pre-industrial times.
Renewable capacity target: Annual COP meetings have produced the goal of increasing the installed capacity of renewable energy.
Net-zero target: COP meetings have also produced the goal of achieving a global net-zero emissions target.
Climate finance target: Mobilising climate finance is a further goal that has emerged from COP meetings.
Electrification as a new addition: The 35% electrification target, if agreed upon, would be one more addition to this existing set of climate-related global goals, all aimed at reducing the world’s dependence on fossil fuels and speeding up the energy transition.
How is the progress of the energy transition measured?
Total Primary Energy Supply (TPES): A measure of all energy available for use in an economy, including energy consumed in producing, transforming and transporting energy itself.
Final Energy Consumption (FEC): A measure of energy ultimately used by end-consumers. It excludes energy burnt to produce electricity, energy used in refining petroleum, diesel burnt in transporting fuel, and transmission and distribution losses.
Structural difference between fossil fuels and renewables: Fossil fuels are direct sources of energy and only require to be burnt to produce energy, whereas renewable sources such as solar, wind, nuclear or hydropower have to be converted into electricity before they can be put to use.
Why electrification rate is the relevant metric: Because renewable sources require conversion into electricity before use, every final use of energy would have to be electrified for a complete transition away from fossil fuels to be possible.
Why does electrification remain limited despite rising electricity demand?
Slow movement in FEC share: Electricity’s share in FEC rose only from 17.7% in 2015 to 21% in 2025, a modest increase over a decade.
Global electricity share in FEC: Electricity accounted for only 21% of total final energy consumption (TFEC) in 2025, according to the IEA.
India’s electricity share in FEC: The corresponding figure for India is about 23%, according to government data.
Rising generation volumes: Global electricity generation increased from about 24 terawatt-hours (TWh) in 2015 to over 32 TWh in 2025, a rise of nearly 33%.
Generation growth has outpaced consumption-side electrification: Electricity output rose by a third over the decade while its share of final consumption rose by only about 3 percentage points.
Hard-to-electrify sectors persist: Shipping, aviation, heavy-duty and long-haul trucks, high-temperature industrial processes in iron, steel, cement and ceramics, and many residential needs like heating remain largely unelectrified and cannot run on renewables.
Which sectors remain difficult to electrify?
Aviation: Long-distance air travel lacks commercially viable large-scale electric alternatives.
Shipping: Heavy maritime transport depends on high-energy-density fuels.
Heavy Industry: Steel, cement and chemicals require high-temperature industrial processes.
Long-Haul Freight: Heavy trucks face battery and charging limitations.
Energy-Intensive Manufacturing: Several production processes remain dependent on fossil fuels.
Why does renewable energy success not automatically translate into climate success?
Steady rise in clean generation share: The share of non-fossil sources (renewables, hydro and nuclear) in electricity generation rose from 33.6% in 2015 to 42.6% in 2025, according to the IEA.
Electricity itself is still the majority fossil: In 2025, only about 42% of all electricity generated worldwide came from non-fossil sources, meaning most electricity generated is still fossil-based.
Compounding effect on total energy use: Only 21% of total final energy consumption is met through electricity, and only about 42% of that electricity is clean.
The reality-check figure: This means just over 8% of total energy consumed in the world is currently clean.
Three decades of policy effort, limited consumption-side result: Nearly three decades of favourable policies, financial incentives and technology innovation to promote cleaner fuels have left more than 90% of current global energy use still dependent on fossil fuels.
How ambitious is the proposed 35% electrification target?
IRENA’s threshold for 1.5°C: The International Renewable Energy Agency states that a 35% electrification rate by 2035 is the minimum needed to keep any realistic hope of staying on the 1.5-degrees Celsius pathway.
Investment requirement: Achieving that level of electrification requires about $1.2 trillion to be pumped into electricity systems every year.
Accompanying requirements: Rapid expansion in renewables and battery storage systems must also happen alongside this investment.
Scale of the gap from current trajectory: The IEA projects electricity’s share of global FEC will rise to only about 24% by 2030, against a target of 35% by 2035, even as non-fossil sources (renewables plus hydro and nuclear) are projected to supply nearly half of global electricity by 2030.
What risks could derail even this limited trajectory?
Geopolitical uncertainty: It is unclear how wars and geopolitical tensions will affect the pace of energy transition.
Two opposing pressures: Greater uncertainty in fossil fuel supplies and rising oil prices may push some countries toward renewables, while the economic fallout of conflicts may squeeze budgets available for new technologies and infrastructure.
Risk of reverting to convenient fuels: Countries may be tempted to use whatever energy source is easily available, regardless of its climate impact.
What do international targets indicate about the future direction of climate policy?
COP28 Consensus: Countries agreed to accelerate the global energy transition.
IRENA Roadmap: The agency proposes raising electrification to 35% by 2035.
Net-Zero Pathways: Most credible decarbonisation scenarios require major electrification gains.
Renewables-Electrification Link: Renewable expansion and electrification must progress together.
Long-Term Transition: Climate targets increasingly depend on transforming energy consumption patterns, not merely energy production.
Conclusion
Clean electricity generation has scaled steadily, but the constraint on climate targets has shifted to how much of total energy consumption is electrified, not how clean the electricity supply is. Only about 8% of global energy consumption is currently clean, and electricity’s FEC share is projected to reach just 24% by 2030 against a 35% by 2035 target. Hence, climate progress will remain limited unless transport, industry and buildings convert their direct fossil-fuel use to electricity at a much faster pace.
PYQ Relevance
[UPSC 2022] Do you think India will meet 50 per cent of its energy needs from renewable energy by 2030? Justify your answer.
Linkage: The question examines India’s renewable energy transition and the feasibility of achieving climate commitments. The article argues that renewable energy expansion alone is insufficient; achieving climate goals also requires rapid electrification of final energy consumption.