Mains Ready By December. Smash Mains & Smash PYQ Admissions Open

Type: Explained

These Newscards correspond to the explained section of various newspapers. They become immensely important for both prelims and mains and special attention needs to be paid to them

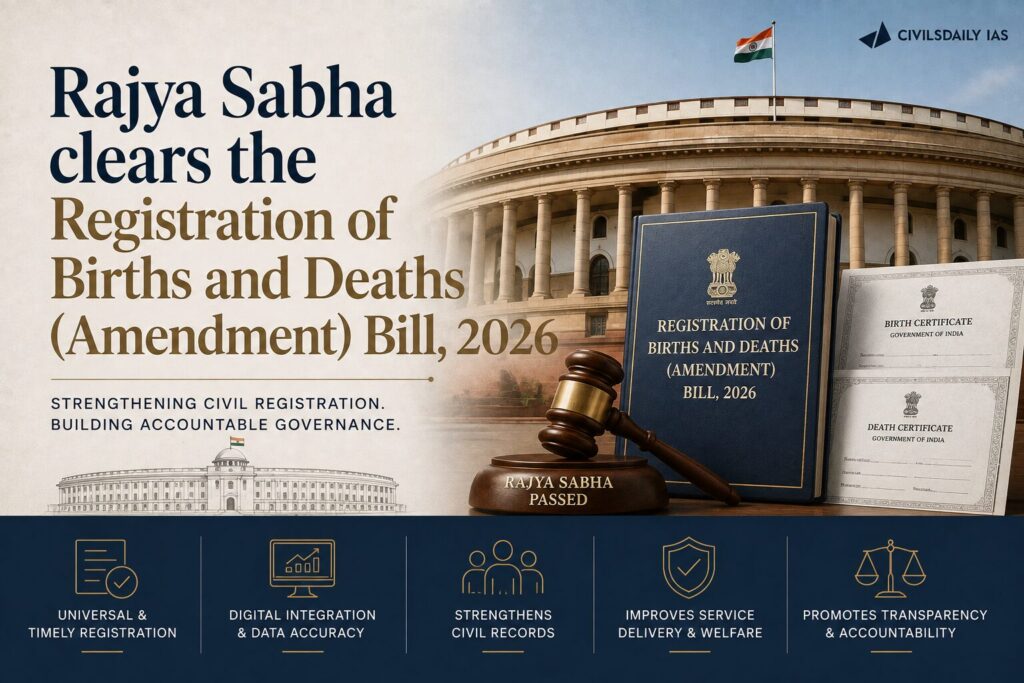
  • Rajya Sabha clears the Registration of Births and Deaths (Amendment) Bill, 2026

    Why in the News

    The Rajya Sabha passed the Registration of Births and Deaths (Amendment) Bill, 2026, after the Lok Sabha cleared it earlier. The amendment requires an order from a Judicial Magistrate First Class for any birth or death registered more than two years after the event, tightening the civil registration system toward universal registration.

    What is the Registration of Births and Deaths Act, 1969?

    1. Legal basis: The Registration of Births and Deaths Act, 1969 makes recording of every birth and death compulsory and lays down the machinery of registrars for the Civil Registration System.
    2. Vital statistics: Registration data feeds official birth and death rates and underpins the issue of legal identity documents.

    What does the amendment change?

    1. Stricter delayed registration: It amends sub section (3) of Section 13 so that registrations delayed beyond two years need an order from a Judicial Magistrate First Class.
    2. Existing tier retained: Delays of up to two years will continue to require an order from a district, sub divisional or authorised executive magistrate.

    Why tighten delayed registration?

    1. Curbing misuse: The government stated that late registration beyond two years was being misused to create fraudulent records.
    2. Guarding the rolls: Ministers argued the change stops fictitious entries from becoming voters and prevents registration of persons born elsewhere.
    3. Universal registration: The stated aim is that every child born is registered and every death recorded, encouraging timely reporting.

    What concerns were raised?

    1. Overburdened magistrates: Members warned that judicial magistrates are already overburdened, so the requirement could delay genuine registrations.
    2. Uneven capacity: The number of judicial magistrates varies sharply across states, creating disparity in access.
    3. Ease of registration: Some urged easier registration through camps and door to door drives and removal of penalties rather than added judicial steps.

    What are the challenges to universal civil registration?

    1. Rural and remote reach: Home births and deaths in remote areas often go unreported because families lack awareness of the reporting window.
    2. Migrant populations: Mobile and migrant families struggle to register events at their place of residence, producing gaps and duplicate records.
    3. Institutional coordination: Registration depends on hospitals, panchayats and municipal registrars whose reporting discipline varies widely.
    4. Cause of death recording: Medical certification of cause of death remains weak outside large hospitals, limiting the quality of vital statistics.
    5. Added judicial load: Routing older registrations through magistrates can create backlogs where courts are already understaffed.

    Conclusion

    The amendment tightens the civil registration system by making very late registration a judicial act rather than an administrative one. It now proceeds to receive the President’s assent, after which state rules and registrar capacity will determine whether it improves accuracy without excluding the genuinely late.

    Back2Basics:

    Registration of Births and Deaths Act, 1969

    1. Central legislation administered through the Registrar General of India and state Chief Registrars.
    2. Makes registration of births, deaths and stillbirths compulsory across the country.
    3. Provides for the Civil Registration System that generates continuous vital statistics.
    4. Amended in 2023 to enable a national database and use of birth certificates as a single document for various services.

    The Registrar General and Census Commissioner of India (RGI)

    1. It is the top government authority under the Ministry of Home Affairs responsible for conducting the country’s decennial Census, managing demographic surveys, and overseeing civil registration.

    Key Functions and Responsibilities

    1. Census Operations: Plans, conducts, and analyzes India’s large-scale population censuses.
    2. Civil Registration: Implements the Registration of Births and Deaths Act (1969), maintaining national vital statistics via the Civil Registration System.
    3. Linguistic & Demographic Surveys: Conducts linguistic surveys and tracks socio-economic and population indicators

    What are the benefits of registration of birth and death?
    The birth certificate is the first right of the child and it is the first
    step towards establishing its identity. The following compulsory
    uses
    of birth and death certificates are emerged:

    1. For admission to schools
    2. As proof of age for employment.
    3. For proof of age at marriage.
    4. To establish parentage.
    5. To establish age for purpose of enrollment in Electoral
      Rolls.
    6. To establish age for insurance purposes.
    7. For registering in National Population Register (NPR).
    8. Production of Production of death certificate for the purpose of inheritance of property and for claiming dues from insurance companies and other companies.

  • AI and cyber, the double helix of today’s security threats

    Why in the News?

    Artificial Intelligence (AI) and cyber threats have merged into a single, compounding security risk that traditional defences cannot contain. AI-powered malware now adapts on its own, autonomous agents undermine established protocols, and the newest models can find and exploit vulnerabilities faster than humans. The deeper conflict is that the technology capable of defending systems is the same technology enabling attacks, while the rules to govern it remain undeveloped.

    What is Agentic AI?

    1. Definition: Agentic AI refers to systems that act autonomously to pursue goals, taking sequential actions with minimal human prompting. It differs from Generative AI, which produces content in response to a user request.
    2. Significance: Autonomous agents can perform complex tasks once reserved for people. As agentic operations grow more sophisticated, threat levels rise further.

    Working

    1. Perception: Gathers real-time data from tools, screens, or sensors.
    2. Reasoning: Uses large models to break a big goal into small steps.
    3. Action: Uses external software or APIs to complete the work.
    4. Learning: Adapts its future choices based on past results

    What is Zero Trust?

    1. Definition: Zero Trust is a security model that assumes no user or device is trustworthy by default, verifying every access request continuously. It replaces the older assumption that anything inside a network is safe.
    2. Erosion: Malicious autonomous agents are positioned to undermine Zero Trust protocols. This aggravates insider threat vectors within organisations.

    How is AI transforming cyber threats?

    1. Adaptive malware: AI-powered malware can adapt and evolve in response to its environment. This makes it harder for traditional anti-virus software to detect. Example: Self-Modifying Code: Rewrites internal structures or instructions continuously to change file fingerprints
    2. Vulnerability discovery: The latest AI systems can detect zero-day vulnerabilities across major operating systems. A zero-day is a software flaw unknown to the vendor and unpatched at the time of attack.
    3. Capability transfer: Newer AI machines let rogue groups demonstrate capabilities once limited to nation states. This lowers the barrier to sophisticated attacks.
    4. Dual-use warning: The World Economic Forum warns AI will strengthen cyber defences while also enabling more sophisticated automated attacks. The same model can render current Zero Trust protocols ineffective.

    How is AI reshaping warfare?

    1. Precision targeting: AI-powered smart systems detect, track and predict missile trajectories with high accuracy. This was demonstrated in recent conflicts.
    2. Autonomous munitions: Systems can independently identify and strike targets. This shifts elements of the kill decision away from human operators.
    3. Multi-source intelligence: AI can fuse intelligence from photos, text, radio and electromagnetic signals. This denies adversaries a tactical advantage.
    4. Cognitive core: Automated analytics platforms (such as Palantir Technologies or military software like Ukraine’s Delta) manage vast data inputs to recommend strikes and run logistics.
    5. Drone accuracy: Software upgrades have pushed first-person view drone hit rates from roughly 30–50% up to 80%.

    Where does the deeper tension lie?

    1. Concentrated power: A handful of Western firms hold the most advanced models and behave as owners of future technology. Control over the mightiest technology is concentrating in a few private hands.
    2. Governance vacuum: AI has the potential to become the dominant source of military and economic power. The rules to govern it remain in a fledgling state.
    3. Escalating rivalry: The United States has accused China of stealing from its most advanced language model to build a rival. This reflects the intensity of the US-China technology competition.

    What are the challenges to safe AI and cyber governance?

    1. Hallucinations: Advanced models produce distortions and misleading outputs. Judgments built on them become unreliable and subjective.
    2. Algorithmic bias: Biases creep into AI-driven decisions, including a bias towards national security framing. Unrestricted reliance on such outputs magnifies risk.
    3. Algorithmic radicalisation: AI platforms can push opinion makers towards extreme views. Guarding against this requires active oversight.
    4. Warning-understanding gap: In defence sensing, AI-dictated warnings can outrun proper understanding of reality. Acting on premature warnings carries strategic danger.
    5. Loss of human control: Increasingly capable models and robots are replacing human roles in critical decisions. Keeping machines under human oversight is becoming harder.

    Conclusion

    The convergence of AI and cyber capability creates a civilisation-scale threat because the technology that defends systems is the same one that attacks them, and no adequate governance exists. The single most important precondition, human oversight backed by enforceable rules, is missing, and altruism from AI firms is not a substitute for it.

    Back2Basics

    CERT-In:

    1. Indian Computer Emergency Response Team is the national nodal agency for cyber security incidents under the Ministry of Electronics and Information Technology.
    2. Statutory basis: Operates under the Information Technology Act, 2000.

    Generative vs Agentic AI

    Generative AIAgentic AI
    Creates content (text, images, code, audio) from user prompts.Performs tasks autonomously to achieve a goal.
    Responds to instructions but does not independently plan actions.Plans, reasons, makes decisions, and executes multi-step workflows.
    Output-focused.Outcome-focused.
    Requires frequent human prompts for each step.Needs minimal human intervention after receiving the objective.
    Limited memory and action capability.Can use memory, APIs, tools, and feedback to adapt actions.
    Example: ChatGPT writing an essay or generating code.Example: An AI assistant that books travel, compares prices, sends emails, and updates the calendar automatically.

    PYQ Relevance

    [UPSC 2022] What are the different elements of cyber security? Keeping in view the challenges in cyber security, examine the extent to which India has successfully developed a comprehensive National Cyber Security Strategy.

    Linkage: UPSC has examined India’s cyber security architecture and the challenges in developing a comprehensive cyber security strategy. The article shows how AI-powered cyber threats and autonomous agents demand an AI-enabled, adaptive cyber security framework beyond traditional defences.

  • The problem with India’s free trade agreement strategy

    India has embraced trade diplomacy, signing Free Trade Agreements with the UAE, Australia, Oman, the United Kingdom, the European Union and New Zealand, with more under negotiation. The record with Asian partners undercuts the assumption that these agreements automatically boost exports and integrate India into regional production networks. Trade with partners such as ASEAN has become import-driven, with deficits widening even as export shares erode.

    What is a Free Trade Agreement and Global Value Chain integration?

    1. Free Trade Agreement (FTA): An FTA is a pact between two or more countries that reduces or removes tariffs and other barriers on goods and services traded between them. It is meant to expand market access on both sides.
    2. Global Value Chain (GVC) integration: A Global Value Chain is a production network where different stages of making a product occur in different countries. Integration means a country supplies or assembles components within these cross-border networks rather than trading only finished goods.

    How has India’s trade balance shifted under Asian FTAs?

    1. Widening deficit with ASEAN: India’s trade deficit with the Association of Southeast Asian Nations (ASEAN) rose sharply from USD 10.4 billion in 2012 to USD 51.2 billion in 2025, driven by rapidly rising imports.
    2. Faster imports with Japan and South Korea: Imports grew much faster than exports with Japan and South Korea over the same period, deepening the imbalance.
    3. Surplus turned to deficit with Singapore: India’s trade surplus with Singapore turned into a deficit after the trade agreement, signalling weakening export competitiveness.
    4. Import-driven pattern: Trade with key FTA partners has become increasingly import-driven rather than export-led.

    Why have export shares eroded despite tariff preferences?

    1. Declining share in partners’ import baskets: India’s share of ASEAN’s import basket dropped from 3.42% to 1.71% between 2012 and 2025, and its share of Singapore’s imports fell from 2.27% to 1.71%.
    2. Losses in Korea and mixed Japan trend: India’s share in South Korea’s import basket declined from 1.33% to 1.02%, while its share in Japan’s imports showed mixed trends.
    3. Tariff cuts cannot offset weak capability: The inability to use tariff preferences shows that market access based on tariff elimination alone cannot compensate for weak domestic industrial capabilities, logistical inefficiencies and infrastructure constraints.

    Why does the case that FTAs drive GVC integration break down?

    1. GVC trade share has fallen: India’s GVC-related trade as a share of gross trade declined from 37.13% to 34.38%, showing weakening integration rather than deepening.
    2. Decline across most partners: GVC trade as a share of gross trade fell with South Korea, Japan, Indonesia, Thailand, Vietnam and Cambodia, rising only with Malaysia, Singapore and the Philippines.
    3. Access is not participation: FTAs may raise market access in some product categories, but their ability to build productive capabilities remains contested.

    What must change beyond signing more FTAs?

    1. Fix domestic capacity first: India’s trade challenge is not negotiating more FTAs but strengthening domestic productive capabilities and removing associated impediments.
    2. Link trade to industrial policy: FTA strategy should connect to an industrial-policy framework emphasising technological upgrading, strategic investment, supply-chain realignment and domestic value addition.
    3. Avoid asymmetric outcomes: Without industrial transformation, FTAs increase import penetration faster than export competitiveness, widening asymmetrical trade outcomes and structural vulnerabilities.

    Conclusion

    The core problem is that India’s FTAs have become instruments of import penetration rather than drivers of export growth or GVC integration, because tariff access cannot substitute for weak industrial capacity. The strategy must move beyond market access toward domestic industrial transformation, technological upgrading and value addition. Until domestic productive capabilities strengthen, additional agreements will deepen deficits rather than reverse them.

    Back2Basics

    1. Free Trade Agreement: A treaty that reduces or eliminates tariffs and trade barriers between member countries.
    2. ASEAN: Association of Southeast Asian Nations, a regional grouping of ten Southeast Asian countries; India signed an FTA in goods with ASEAN in 2009.
    3. Global Value Chain: A cross-border network in which successive stages of production are spread across multiple countries.
    4. Types of trade pacts: Preferential Trade Agreement, Free Trade Agreement, Comprehensive Economic Partnership Agreement and Comprehensive Economic Cooperation Agreement, differing by depth of liberalisation.
    5. Trade deficit: The amount by which a country’s imports exceed its exports.

    PYQ Relevance

    [UPSC 2018] Consider the following countries: 1. Australia 2. Canada 3. China 4. India 5. Japan 6. USA

    Which of the above are among the ‘free-trade partners’ of ASEAN?

    (a) 1, 2, 4 and 5 (b) 3, 4, 5 and 6 (c) 1, 3, 4 and 5 (d) 2, 3, 4 and 6

    Answer: (c)

  • Why the Iran war didn’t cause a fertiliser crisis

    Why in the News?

    The United States-Israel versus Iran war and the effective closure of the Strait of Hormuz triggered a severe global energy supply shock, yet India’s urea supply held up. Government-pushed diversification of liquefied natural gas (LNG) sourcing lifted urea output to 71.5 lakh tonnes in April-June 2026, up 5.4% year-on-year. The contrast is that the same proactiveness was not replicated for phosphatic fertilisers, leaving di-ammonium phosphate and complex fertilisers exposed.

    What are the main fertiliser nutrients?

    1. Nutrient roles: Urea supplies nitrogen (N); di-ammonium phosphate (DAP) supplies phosphorus (P); muriate of potash (MOP) supplies potassium (K). Complex fertilisers blend N, P, K and sulphur (S).
    2. Feedstock links: Urea depends on natural gas as feedstock. DAP and complex fertilisers depend on phosphoric acid, sulphur and ammonia.

    What kept urea supply stable through the shock?

    1. Feedstock disruption: Before the war, 53-54% of India’s LNG imports came from Qatar and the United Arab Emirates. Shipping blockades and strikes on liquefaction infrastructure broke these contracts.
    2. Sourcing pivot: The government pushed public firms to diversify LNG sourcing, buying more from the United States, Oman, Nigeria, Angola and others. This pivot to the spot market meant higher prices but secured supply.
    3. Output recovery: Urea production fell to 17.5 lakh tonnes in March 2026 from 24.7 lakh tonnes a year earlier, then recovered to 25.4 lakh tonnes by June. Cumulative April-June output of 71.5 lakh tonnes exceeded the previous year.
    4. Import surge: India imported 25.1 lakh tonnes of urea in April-June 2026, up from 8.4 lakh tonnes a year earlier. Higher import costs were not passed on to farmers.

    Why did DAP and complex fertilisers stay tight?

    1. Sulphur bottleneck: Sulphur is needed to make sulphuric acid, which breaks down rock phosphate into phosphoric acid. Without both acids, there can be no DAP, single super phosphate or complex fertilisers.
    2. Price spike: Sulphur landed prices reached about $1,100 per tonne against a normal $150-250 range. The spike predated the war, worsened by Ukrainian drone strikes on Russian refineries.
    3. Phosphoric acid costs: Imported phosphoric acid prices rose from $1,055 per tonne in early 2025 to $1,700 for the July-September 2026 quarter. This steady climb squeezed domestic manufacturers.
    4. No diversification: Unlike urea, phosphatic fertiliser sourcing was not widened. Reduced domestic output was combined with lower imports.

    What is the El Nino monsoon factor?

    1. Rainfall deficit: El Nino-induced monsoon deficiency left June-July all-India rainfall 12.6% below normal. Kharif sowing area fell 2.9% from last year.
    2. Subdued demand: Weak rainfall reduced fertiliser offtake, easing pressure on supply. This contrasts with the surplus monsoon scrambles of 2024 and 2025.

    What are the challenges to fertiliser security?

    1. Import dependence: India depends heavily on imports for sulphur, phosphoric acid and ammonia. Concentrated West Asian sources leave it exposed to conflict.
    2. Subsidy pressure: Shielding farmers from higher costs inflates the fertiliser subsidy bill beyond budget estimates. Sustaining it requires additional provisions for DAP and complex fertilisers.
    3. Single-choke geography: Much feedstock still transits the Strait of Hormuz. A single choke point can disrupt multiple nutrients at once.
    4. Phosphate concentration: Few global suppliers dominate phosphoric acid and sulphur. Price-setting power rests with them during shortages.
    5. Election-linked stocking: Upcoming State elections raise pressure to guarantee rabi-season supply. Political timelines complicate purely economic supply planning.

    Conclusion

    Proactive supply-side management, chiefly LNG diversification and pre-emptive urea imports, insulated India’s nitrogen supply from the worst energy shock in decades. The unresolved vulnerability is phosphatic and complex fertilisers, where sulphur and phosphoric acid sourcing was not diversified and prices continue to climb.

    Back2Basics

    1. Urea: Nitrogen fertiliser made from natural gas; the most consumed fertiliser in India and heavily subsidised.
    2. DAP: Di-ammonium phosphate, a phosphorus source dependent on imported phosphoric acid.
    3. Nutrient Based Subsidy: Regime under which non-urea fertilisers (DAP, MOP, complex) receive a fixed per-nutrient subsidy.
    4. Urea pricing: Sold at a statutory notified price with the gap met by subsidy under the Department of Fertilizers.
    5. Key choke point: Strait of Hormuz, the transit route for much of India’s LNG and fertiliser feedstock.

    The New Urea Policy 2015:

    1. It aims to maximize domestic production, promote energy efficiency in manufacturing units, and rationalize government subsidy burdens.

    Core Objectives

    1. Boost Domestic Output: Increase indigenous manufacturing capacity to reduce reliance on foreign imports.
    2. Energy Conservation: Set strict specific energy consumption targets for production units to lower carbon footprints.
    3. Subsidy Rationalization: Streamline financial support and cut down government expenditure on the sector.

    Key Measures

    1. Neem Coating: Mandated all domestic producers to coat 100% of subsidized urea with neem oil, stopping illegal diversion to non-agricultural sectors.
    2. Energy Grouping: Categorized gas-based plants into distinct groups to fix realistic and progressive energy efficiency norms.
    3. Protected Pricing: Ensured continuous and timely supply of fertilizer to farmers without increasing the retail price

    PYQ Relevance

    [UPSC 2023] What are the direct and indirect subsidies provided to farm sector in India? Discuss the issues raised by the World Trade Organization (WTO) in relation to agricultural subsidies.

    Linkage: UPSC has consistently examined agricultural subsidies, their fiscal implications, and India’s compliance with WTO rules. The article shows how rising global fertiliser and LNG prices increase India’s subsidy burden while the government continues to shield farmers through subsidised urea and nutrient-based support for non-urea fertilisers

  • Why has Pakistan-occupied Kashmir erupted in protests?

    Why in the News?

    Simmering discontent over inflation and opaque governance in Pakistan-occupied Kashmir (PoK) has escalated into a violent security crackdown. The Jammu Kashmir Joint Awami Action Committee (JKJAAC) is leading opposition to a three-phase election and to 12 seats reserved for refugees in the 53-seat legislature. The unrest exposes the gap between an establishment-backed electoral process and a local demand for genuine political representation.

    Who are the Jammu Kashmir Joint Awami Action Committee (JKJAAC)?

    1. The JKJAAC is an alliance of civil society groups leading the protest movement in PoK. It has been protesting in Rawalakot, Muzaffarabad, and other locations.
    2. Demand: It seeks a more representative political system and removal of the reserved seats. It alleges the current election process is rigged.

    What is Pakistan-occupied Kashmir (PoK)?

    1. Definition: PoK is the part of the former princely State of Jammu and Kashmir under Pakistan’s control since 1947. India regards it as territory under illegal occupation.
    2. Two Regions: Pakistan administers the area as Azad Jammu and Kashmir (AJK) and Gilgit-Baltistan.
    3. India’s position: The Ministry of External Affairs maintains that the Union Territories of Jammu and Kashmir and Ladakh are integral and inalienable parts of India. It asserts Pakistan is in illegal and forcible occupation and considers local laws or elections void.

    How did a price protest become a movement for representation?

    1. Origins: The movement emerged after the COVID-19 pandemic to curb the prices of essential items. It evolved over the years into a protest against the lack of local political representation.
    2. Legislature structure: The PoK legislature has 53 seats, of which 45 are elected and 8 are nominated. Of the 45 elected seats, 12 are reserved for refugees of Indian Jammu and Kashmir who migrated after 1947.
    3. Grievance over reserved seats: Voters for these 12 seats cast ballots from outside PoK. Locals claim the reserved seats reduce regional representation and let Islamabad override local concerns.
    4. Escalation: The JKJAAC called a “long march” after authorities proceeded with the election without addressing the demand. The protest gained momentum after a PhD scholar was reportedly killed in police firing in Rawalakot.

    Why is Islamabad’s relationship with PoK strained?

    1. Developmental neglect: Mainstream parties have not met the region’s developmental aspirations. Locals allege long-standing neglect by Islamabad.
    2. Inflammatory rhetoric: The Pakistan Defence Minister called the protesters “enemies just like Indians”. The remark inflamed public sentiment.
    3. Parallel with other regions: The complaints echo those long voiced in Khyber Pakhtunkhwa and Balochistan. Both regions have seen protests and insurgencies for decades.
    4. Rigging allegations: The second phase of polling drew allegations of irregularities. The Pakistan Muslim League-Nawaz swept the phase, enabling it to form the regional government.

    How have India and international actors responded?

    1. India’s condemnation: The Ministry of External Affairs blamed the Pakistani establishment for the deaths of over 40 civilians. It called the ongoing polls a cosmetic exercise to camouflage illegal occupation.
    2. JKJAAC’s distancing: The committee rejected any Indian attempt to appropriate the movement. It stated the civil rights movement is neither a proxy nor an extension of interstate rivalries.
    3. Amnesty International: Amnesty urged Pakistan to restore communications access and allow media and independent observers. It responded to a communication blackout in PoK.
    4. United Kingdom diaspora: Non-resident Mirpuri Kashmiris with a strong presence in the UK began an online campaign. It urges restraint on Pakistan’s security establishment.

    Conclusion

    The unrest reflects a contest between an establishment-managed election and a local movement rejecting its political basis. The current status is a continuing three-phase poll amid a deadly crackdown and a communication blackout. Whether the protests subside depends on whether Islamabad addresses the demand over reserved seats, which it has so far refused.

    Back2Basics

    1. PoK: Pakistan-occupied Kashmir, part of the former princely State of Jammu and Kashmir under Pakistan’s control since 1947; India treats it as illegally occupied territory.
    2. Legislature: The PoK assembly has 53 seats, 45 elected and 8 nominated, with 12 elected seats reserved for post-1947 refugees.
    3. Line of Control: The military control line dividing Indian and Pakistani-administered Kashmir, formalised after the Shimla Agreement of 1972.
    4. India’s stance: The Union Territories of Jammu and Kashmir and Ladakh are integral parts of India, with Pakistan in illegal and forcible occupation of parts of them.

  • India cushions energy security against the Strait of Hormuz disruption

    Why in the News?

    India’s Liquefied Natural Gas (LNG) imports rose despite disruption to shipping through the Strait of Hormuz during the West Asia conflict. Imports were diversified to the United States, Nigeria, Oman, and Angola as supply from Qatar collapsed. The Oil and Natural Gas Corporation (ONGC) will also reserve half its Mangaluru facility as a strategic petroleum reserve, exposing the link between supply diversification and physical storage in energy security.

    What is the Strait of Hormuz?

    1. The Strait of Hormuz is the narrow waterway between Iran and Oman connecting the Persian Gulf with the Gulf of Oman and the Arabian Sea. It is a critical energy chokepoint.
    2. Strategic weight: The strait usually carries about a fifth of global oil and LNG shipments. Its disruption during the conflict threatened a large share of India’s gas supply.

    What is Liquefied Natural Gas (LNG)?

    1. Definition: LNG is natural gas cooled to liquid form for transport by ship over long distances. It is regasified at import terminals for use.
    2. India’s dependence: LNG imports meet about half of India’s natural gas requirement. Around 60% of those imports came through the Strait of Hormuz, mainly from Qatar and the UAE.

    How did India cushion the disruption?

    1. Higher overall imports: LNG imports in May-July rose 15.4% year-on-year to 7.08 million tonnes. This followed a near 13% dip in March-April, the first two months of the war.
    2. Supplier diversification: The United States supplied 2.19 million tonnes, up sharply year-on-year. Oman, Nigeria and Angola also rose steeply.
    3. Russian Crude: Russia increased its share to supply roughly 40% of India’s crude imports, bypassing the Hormuz chokepoint entirely.
    4. Collapse of traditional sources: Supply from Qatar plunged 91.3% to 0.23 million tonnes, against a monthly average of 1 million tonnes in 2025. UAE fell 34.4% to 0.55 million tonnes.
    5. Supply over price: India prioritised securing volumes over price to meet demand from city gas, fertiliser, power, and ceramics. LNG prices are expected to stay high, near 19 to 20 dollars per million British thermal units.
    6. Infrastructure Adaptability: West coast terminals like Mundra handled very large crude carriers (VLCCs) from non-Middle Eastern channels.
    7. Ethanol Blending: E20 petrol implementation reduced overall crude import demand by substituting 20% of domestic petrol with local ethanol.

    What is a Strategic Petroleum Reserve?

    1. Definition: A strategic petroleum reserve is a stockpile of crude oil held to cushion supply shocks and price spikes. It is drawn down during import disruptions.
    2. ONGC facility: ONGC is developing a 1.75 million metric tonne facility at Mangaluru. Half of this storage will be reserved as strategic storage, with the rest for commercial operations.
    3. Current buffer: India’s existing crude and petroleum product storage can meet about 74 days of net crude import requirements. The government plans an additional 6.5 million metric tonnes, including at Chandikhol in Odisha and Padur in Karnataka.

    What are the challenges to India’s energy security buffer?

    1. Chokepoint concentration: A single waterway still carries most of India’s Gulf LNG. Any renewed closure of the strait re-exposes this dependence.
    2. Price-driven demand loss: High LNG prices push price-sensitive sectors like industry and power to alternative fuels. This demand destruction undercuts LNG’s role in the energy mix.
    3. Storage gap: A 74-day buffer sits below the 90-day cover the International Energy Agency recommends. Planned reserves are years from completion.
    4. Import dependence: India imports the bulk of its crude and much of its gas. Diversification reduces but does not remove the exposure to external shocks.
    5. Transit workarounds: Some suppliers exported by switching off tanker transponders to evade detection. Such tactics reflect the fragility of normal shipping through the region.

    Conclusion

    India managed the Hormuz disruption by rapidly re-routing LNG procurement to unaffected suppliers rather than cutting imports. The current status is a diversified supplier mix dominated by the United States and Oman, with strategic storage being expanded at Mangaluru and new sites. The next milestone is commissioning the additional 6.5 million tonnes of reserve capacity to lift the buffer toward international norms.

    Back2Basics

    Strategic Petroleum Reserve (SPR)

    1. Definition: A Strategic Petroleum Reserve (SPR) is an emergency crude oil stockpile to protect against supply and price shocks.
    2. Manager: India’s SPR programme is run by Indian Strategic Petroleum Reserves Limited (ISPRL) under the Ministry of Petroleum and Natural Gas.
    3. Phase I sites: Visakhapatnam, Mangaluru, and Padur, with a combined capacity of about 5.33 million metric tonnes.
    4. Global benchmark: The International Energy Agency recommends reserves covering 90 days of net oil imports.
    5. Hormuz significance: The Strait of Hormuz handles roughly a fifth of global oil and LNG trade, making it the world’s most critical oil chokepoint.

    PYQ Relevance

    [UPSC 2025] ‘Energy security constitutes the dominant kingpin of India’s foreign policy, and is linked with India’s overarching influence in Middle Eastern countries.’ How would you integrate energy security with India’s foreign policy trajectories in the coming years?

    Linkage: UPSC recognises energy security as a key determinant of India’s foreign policy and strategic engagement with West Asia. The article shows how supplier diversification, strategic petroleum reserves, and secure maritime supply routes strengthen India’s energy security amid geopolitical disruptions.

  • [4th August 2026] The Hindu OpED: Critical minerals, the foundation of strategic power

    Mentor’s Comment

    Critical minerals have moved from the margins of resource policy to the centre of industrial strategy and national security. China’s dominance in refining, sharpened by rare-earth export controls announced in 2025, has exposed how concentrated the global supply chain is and how vulnerable importing economies remain. India holds domestic reserves but lacks the processing and refining capacity that decides who actually controls supply.

    What are critical minerals?

    1. Definition: Critical minerals are metals and elements that are essential to modern technology and defence but face a high risk of supply disruption due to concentrated production. Lithium, cobalt, nickel, graphite, copper and rare earth elements are the core group.
    2. Why they matter now: They are foundational to electric vehicles, battery storage, renewable power, semiconductors, defence systems and advanced manufacturing. As decarbonisation and digitalisation accelerate, mineral security is becoming as strategically important as oil once was.

    Why is the global supply picture a strategic risk, not a commercial one?

    1. Refining is concentrated in a few countries: For copper, lithium, nickel, cobalt, graphite and rare earths, the average market share of the top three refining countries rose to 86% in 2024 from around 82% in 2020. Supply now depends on a handful of nodes.
    2. China leads across nearly all strategic minerals: China is the leading refiner in 19 of 20 strategic minerals, with an average market share of about 70%. This concentration turns minerals into geopolitical leverage rather than ordinary traded commodities.
    3. Processing is the true chokepoint: In 2024, China accounted for over 90% of rare earths and graphite processing, nearly 75% of cobalt and 70% of lithium chemicals. Control of the midstream, not the mine, confers power.
    4. Export controls have weaponised supply: China’s rare-earth export controls announced in 2025 raised alarm across energy, automotive, defence, aerospace, Artificial Intelligence and semiconductor sectors. A single supplier’s policy decision can now disrupt entire industries.

    What do foreign responses show about the value of processing capacity?

    1. European Union, mandated benchmarks: The Critical Raw Materials Act sets 2030 targets of 10% domestic extraction, 40% processing and 25% recycling, with no more than 65% of any strategic mineral sourced from a single country. It builds integrated supply chains through binding mandates.
    2. United States, mine-waste refining and defence dependence: Firms such as Phoenix Tailings use electrolysis to extract rare earths from mine tailings, backed by a USD 500 million Pentagon loan to expand separation and metallization, the weakest stage of the mines-to-magnets chain. Weapons such as Tomahawk cruise missiles, THAAD interceptors and F-35 jets fail without these inputs.
    3. United States, samarium bottleneck: The defence sector needs 50 to 100 tonnes of samarium each year, yet domestic capacity is tiny, forcing reliance on revived European sites. Solvay restarted separating rare earths at La Rochelle in France after China choked processed-material outflows in April 2025.
    4. United States, tungsten deadline: The Pentagon has set a January 2027 cut-off for China-sourced tungsten, but China controls roughly 80% of global mine supply and a larger share of downstream processing. Building domestic capacity will take years, forcing reliance on existing inventories.

    How is India positioned, and where is the gap?

    1. Reserves exist but supply security does not: India holds reserves of cobalt, copper, graphite and nickel, plus monazite deposits containing rare-earth oxides. It still imports lithium, cobalt and nickel.
    2. The critical gap is processing and refining: India has bulk-mineral experience but relies on imports for high-purity critical mineral products. Capacity and high-purity production remain constrained.
    3. Structural constraints slow progress: Exploration is shallow, regulatory clearances are time-consuming, private participation is limited and remote-region project economics are weak. Recycling cannot substitute for primary supply in the near term.
    4. Rising demand widens the exposure: Under a net-zero scenario, cumulative demand for critical energy-transition minerals could reach roughly 169 million tonnes by 2070, well above a current-policy pathway.

    What is India’s policy response since 2023?

    1. National Critical Mineral Mission: The government has identified 30 critical minerals and launched the Mission to support the value chain, targeting 1,200 domestic exploration projects by 2030-31, production of at least 15 critical minerals, and acquisition of 50 overseas mining assets.
    2. MMDR Act Amendment (2023): Amended the Mines and Minerals (Development and Regulation) Act to empower the central government to auction mining leases and composite licenses for 24 critical and strategic minerals (like lithium and cobalt).
    3. Overseas acquisition through KABIL: Khanij Bidesh India Limited (KABIL), a joint venture of state-owned firms for overseas mineral assets, has secured acreage in Argentina’s Catamarca province for lithium exploration.
    4. Domestic rare-earth corridors: The 2026-27 Budget proposed rare-earth corridors in Odisha, Kerala, Andhra Pradesh and Tamil Nadu.
    5. Diplomatic diversification: The India-United States critical minerals and rare earths framework signed in May 2026 provides an additional lever to diversify supply away from a single source.

    What are the challenges to India’s critical mineral security?

    1. Midstream absence: Without high-purity refining, India cannot participate meaningfully in supply-chain realignment even where it mines the raw ore.
    2. Import dependence for battery metals: Continued reliance on imported lithium, cobalt and nickel leaves electric-vehicle and storage ambitions exposed to external disruption. India imports more than 70% of its lithium-ion battery requirements from China and Hong Kong.
    3. Long lead times: Exploration, clearances and processing plants take years, so near-term vulnerability persists regardless of policy intent.
    4. Recycling feedstock is thin: Collection systems, feedstock volumes and technology remain limited, so recycling cannot yet offset primary shortfalls. Only 5% to 10% of digital waste in India is being systematically recycled, the rest is being wasted.
    5. No strategic stockpile in place: India has not yet operationalised buffer stocks for critical minerals, leaving it without a cushion against sudden export controls abroad.

    Conclusion

    Mineral security now defines India’s industrial and strategic trajectory, and the decisive gap is not reserves but processing and refining capacity. Individual measures are necessary but insufficient without a comprehensive strategy that sets mineral-specific risk thresholds, integrates recycling, builds strategic stockpiles and creates a coordinated institutional framework. The priority is to convert domestic potential into refining capability and reduce strategic vulnerability through sustained execution.

    Back2Basics

    National Critical Mineral Mission:

    1. Launched by the Union government to secure the critical mineral value chain, from exploration to recycling.
    2. Nodal ministry: Ministry of Mines.
    3. Minerals identified: 30 critical minerals notified for India.
    4. Key targets: 1,200 domestic exploration projects by 2030-31, production of at least 15 critical minerals, and acquisition of 50 overseas mining assets.
    5. KABIL: Khanij Bidesh India Limited, a joint venture of NALCO, Hindustan Copper and Mineral Exploration Corporation, tasked with acquiring strategic mineral assets abroad.
    6. Legal backing: The Mines and Minerals (Development and Regulation) Act, 1957 was amended in 2023 to empower the Central Government to auction leases for specified critical minerals.

    Strategic Critical Minerals Cooperation Framework (India and USA)

    1. India and the United States signed the Strategic Critical Minerals Cooperation Framework on May 26, 2026, in New Delhi.
    2. The agreement was finalized to secure supply chains, boost clean energy manufacturing, and reduce reliance on single-source monopolies like China.

    Key Goals of the Partnership

    1. Supply Chain Security: Protects sensitive mineral and rare earth networks from coercive market practices.
    2. Collaboration Areas: Focuses heavily on joint mining, advanced processing, recycling, and scrap management.
    3. Broader Alignment: Coordinates with plurilateral efforts like the Quad Critical Minerals Initiative and the Forum on Resource Geostrategic Engagement (FORGE).

    PYQ Relevance

    [UPSC 2025] Consider the following statements:

    I. India has joined the Minerals Security Partnership as a member. II. India is a resource-rich country in all the 30 critical minerals that it has identified. III. The Parliament in 2023 has amended the Mines and Minerals (Development and Regulation) Act, 1957 empowering the Central Government to exclusively auction mining lease and composite license for certain critical minerals.

    Which of the statements given above are correct? (a) I and II only (b) II and III only (c) I and III only (d) I, II and III

    Answer: (c)

  • Mounting rupee pressure weighs on India’s external trade

    Why in the News

    The rupee has depreciated about 9% against the US dollar over a year, moving from around Rs 87.5 to Rs 95.4 to the dollar. The fall exposes how far India’s trade balance now depends on external shocks it does not control, rather than on domestic competitiveness.

    What is the Real Effective Exchange Rate (REER)?

    1. Meaning: The Real Effective Exchange Rate (REER) is the value of the rupee against a trade weighted basket of partner currencies, adjusted for inflation differences between the countries.
    2. What it signals: A falling REER means Indian goods are becoming cheaper abroad in real terms, which should aid exports but also signals weakening currency strength.
    3. Recent movement: The REER fell between 9% and 11.7% over the period, tracking the nominal depreciation of the rupee.

    What is driving the rupee’s depreciation?

    1. US tariff action: US tariffs on Indian goods rose as high as 50% from August 2025, before being reduced to 10% from February 2026, disrupting export earnings.
    2. Portfolio outflows: Foreign Portfolio Investors (FPI) pulled capital out of Indian markets, reducing dollar inflows and pressuring the currency.
    3. West Asia conflict: The conflict around the Strait of Hormuz raised crude oil prices, widening the oil import bill.
    4. Structural import dependence: India remains dependent on imports for electronics, Active Pharmaceutical Ingredients (API) and critical minerals, keeping import demand high regardless of the rupee’s level.

    Why does the depreciation worsen rather than correct the trade gap?

    1. Widening deficit: The trade deficit widened to $333.6 billion in 2025-26, showing that a cheaper rupee has not narrowed the import bill.
    2. Inelastic imports: Import dependence on energy and critical inputs means volumes do not fall much when the rupee weakens, so the import bill rises in rupee terms.
    3. Export limits: Tariff barriers in key markets cap the export gains a weaker rupee would normally deliver.

    What are the challenges to stabilizing the rupee and the trade balance

    1. Import concentration: Heavy reliance on a few import categories, energy, electronics and critical minerals, leaves the deficit exposed to global price swings.
    2. Reserve drawdown: Defending the rupee through Reserve Bank of India (RBI) dollar sales draws down foreign exchange reserves and cannot continue indefinitely.
    3. Imported inflation: A weaker rupee raises the cost of imported fuel and inputs, feeding into domestic inflation.
    4. Capital flow volatility: FPI flows can reverse quickly with shifts in US interest rates, making the rupee vulnerable to sudden outflows.
    5. Manufacturing gap: Without deeper domestic manufacturing of electronics and pharmaceutical inputs, the structural import bill stays high across cycles.

    Conclusion

    The rupee’s slide is driven mainly by external forces, US tariffs, portfolio outflows and oil prices, not by weaker domestic fundamentals alone. A cheaper currency has failed to correct the trade deficit because import demand is inelastic and export gains are capped by tariffs. Reducing import dependence in energy, electronics and critical minerals is the only durable route to a stronger external position.

    PYQ Relevance

    [UPSC 2020] With reference to the international trade of India at present, which of the following statements is/are correct?

    1. India’s merchandise exports are less than its merchandise imports. 2. India’s imports of iron and steel, chemicals, fertilisers and machinery have decreased in recent years. 3. India’s exports of services are more than its imports of services. 4. India suffers from an overall trade/current account deficit.

    Select the correct answer using the code given below: (a) 1 and 2 only (b) 2 and 4 only (c) 3 only (d) 1, 3 and 4 only

    Answer: (d)

  • Why Kerala is particularly vulnerable to landslides

    Why in the News?

    Fresh landslides in Kerala, following the earlier Wayanad disaster, have renewed attention on why the state is so slide-prone. The explanation separates the terrain and soil conditions that make slopes unstable from the rainfall events that actually trigger a slide.

    What is the difference between conditioning and triggering factors?

    1. Conditioning factors: These are the standing features that make a slope prone to failure, such as steep gradients, weathered soil and geology. A steep gradient is a slope angle that has a high incline or is very vertical, making the ground less stable and more likely to slide or fall down.
    2. Triggering factors: These are the immediate events that set off a slide, above all intense or prolonged rainfall.
    3. Combined effect: A slope must be both predisposed by conditioning factors and hit by a trigger for a landslide to occur.

    Why is Kerala especially vulnerable?

    1. Western Ghats terrain: Steep slopes of the Western Ghats provide the gradient that makes failure possible.
    2. Weathered soil: Deeply weathered, loose soil on these slopes loses cohesion when saturated.
    3. Extreme rainfall: Short bursts of very heavy rain, worsened by climate change, act as frequent triggers.

    How is landslide risk being mapped?

    1. Landslide Atlas: The ISRO National Remote Sensing Centre’s Landslide Atlas (1998-2022) maps slide-prone zones across India.
    2. Hazard zonation: Such mapping identifies high-risk areas for planning and early warning.
    3. Planning use: Zonation data can guide construction limits and evacuation planning in vulnerable districts.

    Conclusion

    Kerala’s landslides result from predisposing terrain and soil combined with increasingly extreme rainfall triggers. Distinguishing conditioning from triggering factors clarifies where and when slides occur. Hazard zonation using the ISRO Landslide Atlas is the basis for prevention and early warning.

    Back2Basics

    National Landslide Risk Management Strategy (NLRMS), 2019 (NDMA)

    The National Landslide Risk Management Strategy (2019), prepared by the National Disaster Management Authority (NDMA), is India’s first comprehensive framework for reducing landslide risk through prevention, preparedness, mitigation, and capacity building.

    Key Pillars

    1. Hazard Mapping: Prepare national and state-level Landslide Hazard Zonation (LHZ) maps; Identify and monitor vulnerable slopes.
    2. Monitoring & Early Warning: Install rainfall- and ground movement-based monitoring systems; Develop Landslide Early Warning Systems (LEWS).
    3. Mitigation Measure: Slope stabilization, retaining walls, rock bolting, drainage improvement, and bio-engineering; Afforestation and regulated hill cutting.
    4. Land-use Planning: Restrict construction, quarrying, and infrastructure projects in high-risk zones; Integrate hazard maps into master plans.
    5. Capacity Building: Train local authorities, engineers, and communities; Conduct awareness campaigns and mock drills.
    6. Emergency Response: Strengthen search-and-rescue, evacuation plans, and post-landslide recovery.
    7. Research & Technology: Use GIS, Remote Sensing, LiDAR, drones, and satellite monitoring for landslide assessment; Promote research on landslide prediction and climate impacts.

    PYQ Relevance

    [UPSC 2021] Differentiate the causes of landslides in the Himalayan region and Western Ghats.

    Linkage: The PYQ focuses on the causes and mitigation of landslides and slope instability. It explains how steep gradients increase slope failure risk and the need for scientific slope management.

  • Tariff-free Scottish salmon under UK-India CETA

    Why in the News

    The first tariff free shipment of Scottish salmon reached Bengaluru on July 31 under the UK India Comprehensive Economic and Trade Agreement (CETA), eliminating India’s earlier 33 percent import tariff on the product. A single consignment marks the transition of a trade agreement from signed text into commercial reality, with industry estimating up to £130 million in additional export opportunity for Scotland’s salmon sector over the next decade.

    What is the UK India CETA?

    1. Comprehensive Economic and Trade Agreement (CETA): CETA is the bilateral free trade agreement between the United Kingdom and India that eliminates or reduces tariffs across a wide range of goods and services traded between the two countries, recently operationalised as part of the broader India-UK Comprehensive Strategic Partnership.

    Why does the tariff removal matter?

    1. Immediate price effect: Removing the 33 percent import tariff makes Scottish salmon significantly cheaper for Indian importers and retailers, directly affecting shelf pricing for consumers.
    2. Early proof of implementation: A commercial shipment moving within months of the agreement taking effect signals that CETA’s tariff schedules are being implemented on the ground, not just agreed on paper.
    3. Export opportunity for Scotland: Industry estimates suggest the tariff elimination could unlock up to £130 million in additional export opportunities for Scotland’s salmon sector over the next decade.

    What are the challenges to realising CETA’s full trade potential?

    1. Cold chain and logistics: Perishable goods such as fresh salmon require reliable cold chain logistics from the United Kingdom to Indian cities, infrastructure that must scale alongside tariff-driven demand growth.
    2. Domestic industry exposure: Cheaper imported salmon could pressure India’s own aquaculture and seafood sector as volumes scale beyond this early shipment.
    3. Uneven sector by sector implementation: Tariff elimination for individual products such as salmon does not guarantee equally smooth implementation across CETA’s other covered sectors, some of which involve more complex regulatory alignment.
    4. Consumer market development: Realising the full projected export opportunity depends on Indian consumer demand for premium imported seafood growing at the pace industry estimates assume.

    Conclusion

    The Scottish salmon shipment is an early, narrow proof point for CETA’s tariff provisions rather than evidence of the agreement’s full commercial impact. Subsequent months will show whether tariff elimination translates into sustained trade volumes across the agreement’s broader list of covered goods.