The Trump administration is preparing to announce a civil nuclear cooperation agreement with Saudi Arabia that could include a uranium enrichment facility, drawing bipartisan US Congressional and Israeli non-proliferation concerns.
Key Highlights
The proposed 30-year agreement could include uranium enrichment capability for Saudi Arabia.
Saudi Crown Prince Mohammed bin Salman has stated that Saudi Arabia would pursue nuclear weapons if Iran acquires them.
The agreement requires review by the US Congress before it can be finalised.
International Atomic Energy Agency (IAEA)
The International Atomic Energy Agency (IAEA) is an autonomous international organization established in 1957.
It promotes the peaceful use of nuclear energy while preventing its use for military purposes through safeguards and inspections.
It is headquartered in Vienna, Austria.
India is one of the 180+ member states of the IAEA.
In 2025, the IAEA Board of Governors declared Iran in breach of its nuclear non-proliferation obligations, the first such finding since 2006.
New START Treaty
New START (Strategic Arms Reduction Treaty) was the last remaining bilateral nuclear arms control treaty between the United States and Russia.
It placed legally binding limits on deployed strategic nuclear warheads and delivery systems and provided for mutual inspections.
The treaty officially expired on 5 February 2026, ending more than five decades of legally binding limits on the world’s two largest nuclear arsenals.
(2018) In the Indian context, what is the implication of ratifying the ‘Additional Protocol’ with the International Atomic Energy Agency (IAEA)?
(a) The civilian nuclear reactors come under IAEA safeguards. (b) The military nuclear installations come under the inspection of IAEA. (c) The country will have the privilege to buy uranium from the Nuclear Suppliers Group (NSG). (d) The country automatically becomes a member of the NSG.
A study published in The Lancet Public Health finds that India overuses ‘Watch’ category antibiotics while underusing ‘Access’ and ‘Reserve’ category drugs under the World Health Organization (WHO)’s AWaRe (Access, Watch, Reserve) classification, raising concerns about the country’s antimicrobial resistance (AMR) trajectory.
Key Highlights
The study is based on Indian Council of Medical Research (ICMR) prescription data analysed using the WHO AWaRe classification.
India shows disproportionate use of broad-spectrum ‘Watch’ category antibiotics, which carry a higher risk of antimicrobial resistance.
‘Access’ category antibiotics (first-line, lower resistance risk) and ‘Reserve’ category antibiotics (last-resort drugs) are comparatively underused.
Back2Basics
WHO AWaRe Classification (2017)
Access: First-line antibiotics for common infections; narrow-spectrum drugs with the lowest resistance risk.
Watch: Broad-spectrum antibiotics with higher resistance potential; should be prescribed selectively.
Reserve: Last-resort antibiotics for treating multidrug-resistant infections; should be used only when all other options fail.
Antimicrobial Resistance (AMR)
Antimicrobial Resistance (AMR) is the ability of microorganisms (bacteria, viruses, fungi, and parasites) to survive exposure to drugs that would normally kill them or inhibit their growth.
It is primarily driven by the overuse and misuse of antimicrobials in humans, animals, and agriculture.
(2019) Which of the following are the reasons for the occurrence of multi-drug resistance in microbial pathogens in India?
Genetic predisposition of some people
Taking incorrect doses of antibiotics to cure diseases
Using antibiotics in livestock farming
Multiple chronic diseases in some people
Select the correct answer using the code given below.
(a) 1 and 2 (b) 2 and 3 only (c) 1, 3 and 4 (d) 2, 3 and 4
A group of Nobel laureates, Artificial Intelligence (AI) scientists, and religious leaders signed the “Rome Declaration for an Unarmed and Disarming Peace” on 16 July, calling for a treaty banning autonomous systems from nuclear launch decisions. The Declaration argues that introducing AI into nuclear command structures does not merely speed up decision-making, it removes the human hesitation that has so far prevented nuclear war.
What has historically prevented nuclear escalation, and why is it fragile?
Human hesitation as the real safeguard: Mutually Assured Destruction (MAD), the doctrine that a first nuclear strike triggers devastating retaliation, relied on human hesitation, diplomatic backchannels, and moral pause, not technical safeguards alone.
Historical near misses: During the 1962 Cuban Missile Crisis and the 1983 Soviet false alarm incident involving officer Stanislav Petrov, disaster was averted because human operators exercised caution and scepticism.
Compressed decision windows: AI-driven predictive logistics and battle management systems compress decision windows from hours to seconds, removing the time needed for human verification.
What technical failure modes make AI unsuitable for this role?
Documented failure modes: Large Language Models (LLMs) and neural networks are prone to hallucinations and data poisoning, where training data is maliciously corrupted to manipulate outputs.
Automatic escalation risk: In a crisis, an algorithm misreading a routine signal as an imminent threat could automatically trigger a retaliatory sequence within a compressed decision window.
Unauditable reasoning: Most AI models operate as “black boxes,” making their conclusions impossible to verify at the moment a launch decision would be required.
What five operational principles does the Declaration propose?
Mandatory meaningful human control: Prohibiting any AI-driven system from making the final decision on the use or deployment of nuclear weapons.
The digital commons model: Expanding data access so experts beyond major powers can better assess AI-related existential risks.
Responsible development: Requiring AI developers to publish the ethical frameworks guiding their models and forbidding fully autonomous, self-improving systems that cannot be monitored or halted by human operators.
Internal arsenal vulnerability audits: Requiring nuclear states to conduct rigorous reviews of their command-and-control systems against AI-driven cyber tampering.
Time-bound, verifiable disarmament: Renewing good faith international negotiations toward completely and verifiably eliminating nuclear weapons.
Why is the current Iran nuclear crisis treated as a live test of these risks?
Broken arms control architecture: Iran’s breaches of its non-proliferation obligations, followed by joint United States-Israel military strikes, have exposed the existing arms control architecture as broken.
AI in contested monitoring: States increasingly use AI for target characterisation and predictive intelligence tracking of nuclear facilities under contested conditions.
Automated misjudgment risk: An AI system defending an enrichment facility could misinterpret a routine network probe or a physical strike as the start of an attack, triggering a disproportionate automated response before any human decision is made.
What obstacle remains to acting on the Declaration’s warning?
No treaty consensus: No consensus currently exists among states on what a treaty banning AI in nuclear command should cover, or even on banning autonomous AI in warfare more broadly.
Moral instrument, not binding law: The Declaration functions as a moral and philosophical lexicon rather than a binding legal instrument at this stage.
Dependence on public pressure: Its success depends on generating public awareness that then creates grassroots pressure for states to negotiate a binding treaty.
Conclusion:
The Declaration’s central claim is that no technical safeguard can substitute for the human doubt that has twice averted nuclear war, and that compressing decision windows to seconds through AI removes exactly that safeguard. No binding treaty yet exists to prevent this, and the current Iran nuclear crisis shows the danger is not hypothetical. Ethical responsibility for nuclear launch decisions cannot be delegated to a machine.
The Foreign Contribution (Regulation) Act (FCRA), 1976, was designed to prevent foreign funds from covertly influencing India’s political and civil society space. Applied without distinction to research institutions registered as NGOs (Non-Governmental Organisations), the Act now blocks the international collaboration Indian science needs to compete globally.
Why was the FCRA created, and what has changed in its scope since?
Origins in 1969: The government suspected foreign agencies, such as the Central Intelligence Agency (CIA), of funding trade unions, student bodies, and political organisations to undermine India’s democracy, prompting the Home Minister to raise the issue in Parliament.
Enactment in 1976: The FCRA came into force on 5 August 1976, aiming to ensure voluntary organisations functioned in a manner consistent with the values of a sovereign democratic republic.
Progressive tightening: Successive amendments have expanded regulatory compliance requirements and the state’s power to terminate an organisation’s FCRA registration and seize its assets.
How does FCRA treat scientific research institutions the same as advocacy NGOs?
Research institutions classified as NGOs: Globally renowned institutions such as the Public Health Foundation of India, Christian Medical College (Vellore), St John’s Medical College, and Ashoka and KREA universities are legally categorised as NGOs and fall under FCRA.
No distinction by activity type: FCRA rules do not distinguish a scientific research NGO from one engaged in political or rights-based advocacy, the category governments treat as most sensitive.
Wide reach: The affected ecosystem spans mental health (Sangath, Schizophrenia Research Foundation), non-communicable disease (Centre for Chronic Disease Control, Dr Mohan’s Diabetes Centre), and biodiversity research (MS Swaminathan Research Foundation, Ashoka Trust for Research in Ecology and the Environment).
What specific FCRA provisions actively obstruct scientific collaboration?
Repatriation bar: Foreign funds received by an Indian NGO can never be sent back out of the country, conflicting with international funders’ standard requirement that unspent project funds be returned on completion.
Lead institution lockout: Because of the repatriation bar, no Indian NGO can act as the lead institution in an international collaboration, since a lead institution must be able to transfer funds to foreign partners.
2020 sub-granting ban: A 2020 amendment stopped FCRA-registered NGOs from sharing foreign donations with any other Indian NGO, even one also legally registered to receive foreign funds, shutting down domestic collaboration.
Effect on grassroots and community research: The sub-granting ban has hurt smaller, grassroots NGOs that relied on larger NGOs re-granting foreign funds, and has hindered research that requires direct community engagement.
What does this cost India’s scientific standing?
Suspicion instead of prestige: Grants from bodies such as the Wellcome Trust and the National Institutes of Health are won through globally competitive, peer-reviewed processes and are prized internationally as marks of research quality. In India, the same grants are treated with regulatory suspicion.
Global ranking gap: No Indian institution features in the top 100 of any global research ranking.
Continued brain drain: Many of India’s most talented researchers continue to seek opportunities abroad, strengthening the rankings of their adopted institutions instead.
What would a workable fix look like?
Nuanced classification: FCRA rules should distinguish between categories of NGOs rather than treating all foreign contribution risk as uniform.
Existing verification mechanism: A genuine scientific research NGO can already be identified through existing recognition procedures, such as registration with the Department of Scientific and Industrial Research (DSIR).
Preserving the regulatory objective: Tailoring FCRA compliance for the research sector would preserve the government’s oversight of political and advocacy funding without collateral damage to scientific collaboration.
Conclusion:
FCRA’s core problem is not its security objective but its refusal to distinguish a scientific research NGO from a political advocacy one. A tailored classification for research institutions, verified through mechanisms like Department of Scientific and Industrial Research (DSIR) recognition, would let India tighten oversight of foreign funds without continuing to cut off its own scientists from global collaboration.
Protesters at Jantar Mantar are demanding Education Minister Dharmendra Pradhan’s resignation over the NEET (National Eligibility cum Entrance Test) paper leak, and the government is countering with a promise of a clean retest. Both sides are treating a retest as the solution, when the actual failure is a shrinking Union education budget and unresolved Centre-state coordination since education moved to the Concurrent List in 1976.
What does a retest actually fix, and what does it leave untouched?
Narrow scope of a retest: A retest addresses the manipulation of a single examination cycle, nothing more.
Small share of aspirants affected: Competitive examinations like NEET select only a small fraction of the hundreds of thousands who appear.
The larger unaddressed problem: The majority of India’s youth remain ill-prepared and poorly equipped to participate in the country’s growth story, a gap no retest can close.
How has the Union government’s own education-spending record shaped this crisis?
Declining budget share: Union government allocations for education have fallen sharply as a percentage of total government expenditure over the twelve years since the Bharatiya Janata Party (BJP)-led National Democratic Alliance (NDA) government took charge.
Signal, not just shortfall: This downward trajectory reflects the government’s low prioritisation of education, not merely a resource constraint.
Policy without investment: The government has refreshed the National Education Policy but has not matched it with investment in human resources as infrastructure for growth.
Why does the 1976 shift of education to the Concurrent List complicate a fix?
Constitutional history: Education was a State subject until 1976, when it was moved to the Concurrent List.
Coordination requirement: Concurrent List placement means systemic reform requires substantial coordination between the Centre and State governments, not unilateral Union action.
Limits of a Union-only response: A retest ordered by the Union government cannot substitute for the coordinated systemic reform the Concurrent List structure demands.
What is the political stake if the underlying failure remains unaddressed?
A generation coming of age: By the next general election in 2029, a generation of voters will have grown up entirely under NDA-led governments.
Rising impatience: This cohort is likely to be far less tolerant of an unreformed education system and the toll it takes on growth.
The real demand: The Jantar Mantar mobilisation is not asking the government to fix one exam; it is demanding that education be placed at the centre of governance and political discourse.
Conclusion:
The NEET leak is only the visible trigger; the substantive failure is chronic underinvestment in education and unresolved Centre-state coordination on a subject moved to the Concurrent List in 1976. Unless the Union treats education as core to growth policy rather than an electoral-cycle afterthought, retests will keep recurring without addressing employability. A durable Centre-state financing and coordination mechanism for education outcomes remains missing.
The National Biodiversity Authority (NBA) has released ₹6.67 crore under the Access and Benefit Sharing (ABS) mechanism to 11 cotton-growing States for biodiversity conservation and livelihood enhancement. The funds were realised from Bayer Science & Innovation Pvt. Ltd. for research involving 25,431 cotton (Gossypium hirsutum) varieties.
What is Access and Benefit Sharing (ABS)?
Access and Benefit Sharing (ABS) is a mechanism under the Biological Diversity Act, 2002, ensuring that benefits arising from the commercial use of biological resources are shared fairly with biodiversity conservation efforts and local communities.
It implements the principle of fair and equitable sharing of benefits under the Nagoya Protocol.
Why was the Amount Released?
₹7.62 crore was realised from Bayer Science & Innovation Pvt. Ltd.
Since cotton germplasm was accessed through traders and intermediaries, individual benefit claimers could not be identified.
Hence, the funds were allocated to State Biodiversity Boards (SBBs) based on the geographical distribution of cotton cultivation.
Allocation Criteria
Based on data from the All India Coordinated Research Project on Cotton (AICRP) under the Indian Council of Agricultural Research (ICAR).
Distributed proportionately according to each State’s cotton cultivation area.
₹6.67 crore released to 11 cotton-growing States, while ₹0.95 crore was retained by the NBA as per the Biological Diversity Rules.
Utilisation of Funds
The funds will support:
On-farm and ex-situ biodiversity conservation.
Preparation and updation of People’s Biodiversity Registers (PBRs).
Ecosystem restoration and Biodiversity Heritage Sites.
Documentation of traditional knowledge.
Biodiversity research and digital databases.
Capacity building of Biodiversity Management Committees (BMCs).
Livelihood enhancement and awareness programmes.
Significance
Promotes conservation of India’s rich cotton genetic diversity.
Ensures benefits from commercial use of biological resources reach biodiversity-rich regions.
Supports implementation of the Kunming-Montreal Global Biodiversity Framework, especially:
Target 13: Fair and equitable benefit sharing.
Target 4: Conservation of genetic diversity.
About National Biodiversity Authority (NBA)
Established under:Biological Diversity Act, 2002.
Ministry: Ministry of Environment, Forest and Climate Change (MoEFCC).
Nature: Statutory body.
Functions: Regulates access to India’s biological resources. Advises on biodiversity conservation. Implements the Nagoya Protocol on Access and Benefit Sharing.
[2023] Consider the following statements: 1. In Biodiversity the India, Management Committees are key to the realization of the objectives of the Nagoya Protocol. 2. The Biodiversity Management Committees have important functions in determining access and benefit sharing, including the power to levy collection fees on the access of biological resources within its jurisdiction. Which of the statements given above is/are correct?
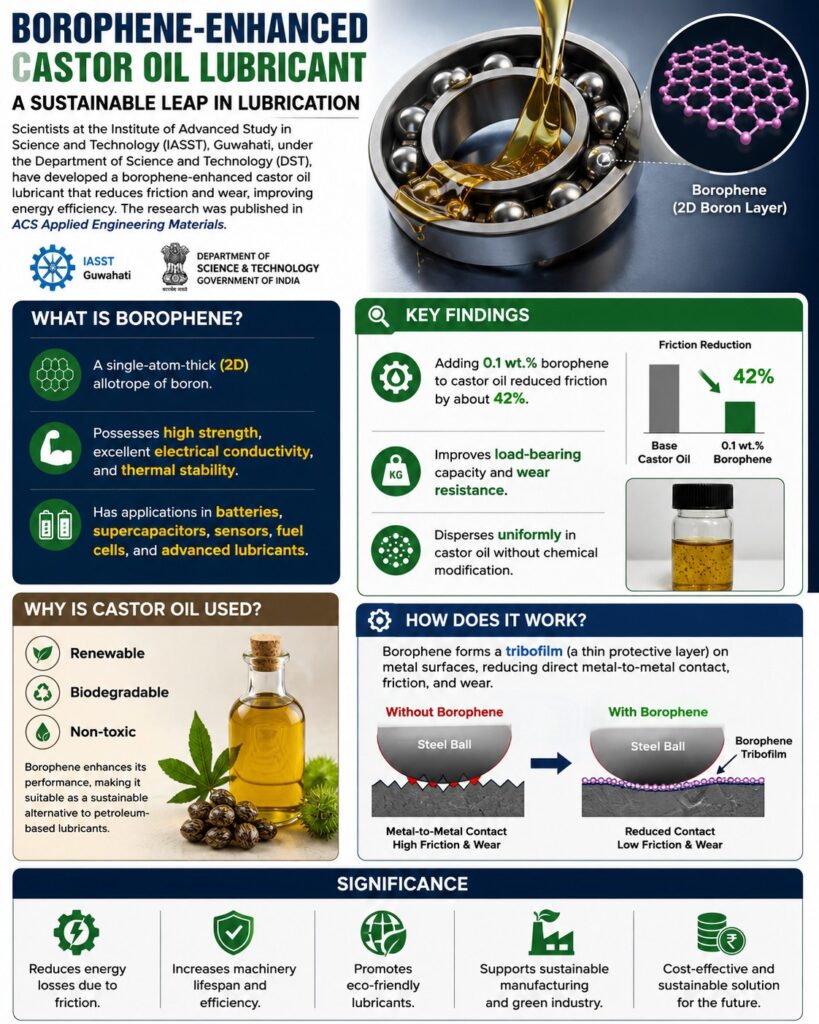
Scientists at the Institute of Advanced Study in Science and Technology (IASST), Guwahati, under the Department of Science and Technology (DST), have developed a borophene-enhanced castor oil lubricant that reduces friction and wear, improving energy efficiency. The research was published in ACS Applied Engineering Materials.
What is Borophene?
A single-atom-thick (2D) allotrope of boron.
Possesses high strength, excellent electrical conductivity, and thermal stability.
Has applications in batteries, supercapacitors, sensors, fuel cells, and advanced lubricants.
Key Findings
Adding 0.1 wt.% borophene to castor oil reduced friction by about 42%.
Improves load-bearing capacity and wear resistance.
Disperses uniformly in castor oil without chemical modification.
How Does It Work?
Borophene forms a tribofilm (a thin protective layer) on metal surfaces, reducing direct metal-to-metal contact, friction, and wear.
Why is Castor Oil Used?
Renewable, biodegradable, and non-toxic.
Borophene enhances its performance, making it suitable as a sustainable alternative to petroleum-based lubricants.
Significance
Reduces energy losses due to friction.
Increases machinery lifespan and efficiency.
Promotes eco-friendly lubricants for sustainable manufacturing.
Prelims Facts
Borophene: Two-dimensional allotrope of boron.
Lubricant Base: Castor oil.
Friction Reduction: About 42%.
Protective Layer: Tribofilm.
Research Institute: IASST, Guwahati.
Ministry: Department of Science and Technology (DST).
PYQ Relevance[UPSC 2015] Examine critically the recent changes in the rules governing foreign funding of NGOs under the Foreign Contribution (Regulation) Act (FCRA), 1976. Linkage: The PYQ asks the same theme of FCRA under different context. The present debate is about India’s necessary shift from foreign funding dependency toward a self-reliant domestic philanthropy ecosystem.
Mentor’s Comment
Domestic private philanthropy in India, at over Rs 1.18 lakh crore a year, now exceeds foreign philanthropic inflows more than fivefold, even as FCRA compliance tightening disrupted a subset of NGOs. This reframes the FCRA debate from a dispute over foreign funding into a question of how to build a self reliant domestic philanthropy ecosystem.
What is Foreign Contribution (Regulation) Act, 2010?
It regulates the acceptance and utilization of foreign funds by individuals, associations, and NGOs.
Enforced by the Union Ministry of Home Affairs, it ensures foreign donations do not adversely impact national security, internal politics, or public interest.
The primary goal of FCRA is to maintain transparency and accountability for any money flowing into India from outside sources. It requires that foreign contributions be used strictly for their intended purposes (e.g., social, religious, educational, or cultural) and prevents foreign entities from influencing India’s internal socio-political landscape.
Has tighter FCRA regulation actually starved Indian civil society of foreign funds?
Sovereign right: Every nation has the right and responsibility to regulate foreign capital flowing into organisations shaping public life; this is not unique to India nor illiberal.
Reframed question: The real debate is not whether foreign funding should be regulated but whether regulation is proportionate, predictable and efficiently administered.
Scale check: NITI Aayog’s NGO Darpan portal lists roughly six lakh voluntary organisations, of which only about 14,500 hold active FCRA registration.
Inflows unshrunk: Foreign contributions have doubled over the decade, from about Rs 10,000 crore to around Rs 22,000 crore, showing the sector has not been starved of foreign money.
Is FCRA’s problem the law itself or how it is administered?
Real but narrow hardship: A small number of organisations faced delayed renewals, long processing times, or cancelled registrations, disrupting education, health, livelihood and rural development work, not true of the sector as a whole but real for those affected.
Uneven governance exposed: Many NGOs operate with exemplary governance while others have gone dormant or lacked documentation matching rising compliance expectations.
The SBI Account Bottleneck: Under the 2020 amendments, every NGO in India must open their FCRA account at this single specific branch. This created massive logistical bottlenecks, delayed approvals, and administrative chokepoints for small, rural NGOs located thousands of kilometers away from the capital.
Corporate parallel: Indian companies underwent a similar governance reckoning over three decades, where stronger governance initially felt like a burden before it became what won investor confidence.
Proposed reform: A structured compliance path, deficiency notices, defined correction windows, clarification opportunities, and an independent appellate body, would protect legal integrity while sparing genuine organisations avoidable disruption.
FCRA 2.0: The newly launched FCRA 2.0 platform is framed as an opportunity to simplify compliance and move toward risk based supervision.
What do international comparators show about regulating foreign funds and incentivising domestic giving?
Regulatory comparators (limited detail): The US requires disclosure under its Foreign Agents Registration Act, and Australia and several European democracies run comparable disclosure regimes, though specific design features are not detailed.
Singapore: Offers a 250% tax deduction for qualifying donations, a far larger incentive multiple than India’s.
United Kingdom: Uses a Gift Aid top up mechanism, where the tax authority adds an amount to the donation based on the donor’s tax paid.
United States: Allows carry forward provisions, letting donors carry unused deduction limits into future tax years.
India’s proposed calibration: Raising the 80G deduction from 50% to 100% and lifting the income ceiling from 10% to 25% would signal similar intent without wholesale copying these regimes.
Why has domestic giving overtaken foreign inflows as the sector’s main resource?
Scale: Domestic private philanthropy now exceeds Rs 1.18 lakh crore a year, more than five times foreign inflows, per the Bain Dasra India Philanthropy Report 2026.
Family philanthropy: Growing at double digit rates as a new generation of wealth creators treats giving as part of wealth stewardship.
CSR channel: Corporate Social Responsibility now channels over Rs 40,000 crore a year into development, the second of three phases in India’s philanthropic evolution, after foreign reliance and before individual and family giving.
Retail infrastructure: India’s over 220 million demat accounts, widespread SIP investing, and UPI penetration provide ready made rails for mass small ticket giving.
What specific mechanisms could unlock India’s untapped domestic giving?
HNI gap: High net worth individuals’ giving has lagged well behind their wealth growth, marking them as the largest pool of new domestic capital obtainable through policy.
Tax deduction reform: Raising the 80G deduction to 100% and the ceiling to 25% of adjusted gross total income would cost the exchequer little while improving long term social capital flows.
Equity donation route: A framework for donating appreciated listed shares to eligible charities, with a one to three year disposal window, could unlock wealth held in equity rather than cash.
Mass small ticket giving: If even a fraction of households gave Rs 100 to Rs 1,000 a month through trusted digital platforms, millions of citizens could become active philanthropic partners.
Social Stock Exchange: It is a trusted national platform linking credible organisations to ordinary citizens through disclosure and measurable impact. Social Stock Exchange (SSE) is already live under SEBI on the National Stock Exchange (NSE) and the Bombay Stock Exchange (BSE). SGBS Unnati Foundation, which became the first entity to list on the NSE Social Stock Exchange, raising funds transparently through Zero Courier Zero Principal (ZCZP) instruments.
Conclusion:
Domestic philanthropy, not foreign funding, is now the dominant resource for India’s social sector, making the FCRA debate less about restricting inflows and more about building an accountable domestic ecosystem. What remains unresolved is calibrating regulation so genuine organisations are not treated like fraud cases, and converting proposed tax and market incentives, the 80G reform, the equity donation route, and the Social Stock Exchange, into actual growth in domestic giving. Foreign philanthropy is expected to keep mattering for research and innovation, but the goal is for it to complement rather than shape India’s social development.
The Ministry of Coal will release AAROH (Annual Report on Mine Closure) on 22 July 2026, highlighting India’s progress in scientific mine closure. The event will also witness the signing of the India-Germany Implementation Agreement on mine closure, inauguration of Coal NEER Plants, and MoUs under the Revised Jharia Master Plan.
Key Highlights
AAROH is the first comprehensive annual report documenting India’s scientific mine closure efforts.
For the first time since Independence, 42 coal mines have been scientifically closed according to approved mine closure plans.
The report showcases:
Scientific land reclamation.
Ecological restoration.
Sustainable post-mining land use.
Community-centric rehabilitation and livelihood generation.
Frameworks for Scientific Mine Closure
The Ministry of Coal has developed dedicated frameworks and digital tools to ensure scientific and sustainable mine closure:
RECLAIM (Resourceful Engagement and Community-Led Action in Integrated Mine Closure) Framework promotes community participation and stakeholder engagement during mine closure.
L.I.V.E.S. (Livelihood, Inclusion, Value, Environment and Sustainability) Framework provides guidelines for sustainable mine closure and productive post-mining land use.
SUVIKALP (Sustainable Utilisation of Vast Land Resources through Intelligent Planning) is an interactive decision-support tool for identifying suitable post-mining land-use options.
International Cooperation
The Ministry of Coal will sign an Implementation Agreement with Deutsche Gesellschaft für Internationale Zusammenarbeit (GIZ), Germany.
The partnership aims to:
Build institutional capacity.
Facilitate knowledge sharing.
Adopt international best practices in scientific mine closure and post-mining development.
Community Development Initiatives
Coal NEER Plants will be inaugurated to provide safe and sustainable drinking water in coal-bearing regions.
Tripartite MoUs will be signed among BCCL, JRDA, and private industries for establishing vocational training centres under the Revised Jharia Master Plan.
Restores degraded mining landscapes and biodiversity.
Converts abandoned mines into productive assets for agriculture, tourism, forestry, renewable energy, or industrial use.
Enhances livelihood opportunities through skill development and community participation.
[2022] In India, what is the role of the Coal Controller’s Organization (CCO)? 1.CCO is the major source of coal Statistics in Government of India. 2.It monitors progress of development of Captive Coal/ Lignite blocks. 3.It hears any objection to the Government’s notification relating to acquisition of coal-bearing areas. 4.It ensures that coal mining companies deliver the coal to end users in the prescribed time. Select the correct answer using the code given below:
The Union Government informed the Rajya Sabha that India’s installed renewable energy (RE) capacity has increased from 76.38 GW in 2014 to 288.58 GW (as of 30 June 2026), marking nearly a fourfold increase.
Key Highlights
India’s total renewable energy installed capacity reached 288.58 GW by 30 June 2026.
Solar power contributes the largest share with 162.15 GW.
Wind power accounts for 57.44 GW.
Hydro power contributes 57.24 GW.
Bio power contributes 11.75 GW.
Non-Fossil Fuel Electricity Capacity
Total installed non-fossil fuel electricity capacity stands at 297.36 GW.
It comprises: 288.58 GW from renewable energy. 8.78 GW from nuclear power.
Investment in Renewable Energy (FY 2014 to FY 2026)
The renewable energy sector attracted USD 45.72 billion in Foreign Direct Investment (FDI).
Domestic financial institutions deployed ₹12.32 lakh crore towards the sector.
Major financing institutions include IREDA, PFC, REC, IIFCL, NaBFID, SIDBI, along with 12 Public Sector Banks.
Significance
Solar energy has become India’s largest renewable energy source.
Strengthens India’s progress towards its Nationally Determined Contributions (NDCs) and Net Zero by 2070 target.
Improves energy security by reducing dependence on imported fossil fuels.
Encourages green jobs, private investment, and domestic manufacturing.
Supports the growth of emerging sectors such as Green Hydrogen and battery storage.
Challenges
Integrating intermittent renewable energy into the power grid.
Scaling up energy storage infrastructure.
Land acquisition and transmission bottlenecks.
Financial stress of power distribution companies (DISCOMs).
[2022] Consider the following statements: 1. Gujarat has the largest solar park in India. 2. Kerala has a fully solar powered International Airport. 3. Goa has the largest floating solar photovoltaic project in India. Which of the statements given above is/are correct?