💥Join UPSC 2027,2028 Mentorship (August Batch) + XFactor Notes & Microthemes PDF

Distribution: weekly

  • Investment question has a political answer

    Investment question has a political answer

    Why in the News

    Private corporate investment in India remains considerably lower than the peak seen in the mid 2000s, even as large corporates hold substantial cash. Firms are deploying funds in financial assets rather than building physical assets such as factories, and are taking money out of the country rather than investing it here. The standard explanations offered for this are subdued domestic demand and global uncertainty. A political economy explanation is now advanced instead, locating the cause in how political power structures affect investment decisions. Centralisation of political power has been unmistakable after 2014, accompanied by fiscal centralisation and a reconfiguration of federal structures. The contested claim is that market concentration around a handful of “national champions” is not an accident of policy but is politically useful, which would make an investment revival costly to the current political settlement.

    What are “national champions”?

    • Definition: A national champion is a large domestic business group that a government treats as the preferred vehicle for building strategic capacity, and that is favoured in policy design as a result.
    • How the status is conferred: Preference operates through the terms of auctions, tariffs, incentive eligibility, clearances and access to public contracts rather than through an announced designation.
    • The economic consequence: A handful of such groups now command far greater sway over the economy than before, which raises the entry barrier facing any firm attempting to compete with them.

    What does the investment slowdown actually look like?

    • Cash-rich firms are not building: Large corporates hold funds but are not committing them to new capacity in India.
    • Capital is leaving: Companies are taking money out of the country rather than investing it domestically.
    • Investment is below its own peak: Private corporate investment remains considerably lower than the level reached in the mid 2000s.
    • Financial assets over physical assets: Corporate India is more keen to deploy funds in financial assets than to use them for factories and plant.
    • The standard explanations are incomplete: Subdued domestic demand and global uncertainty have been put forward, and neither accounts for why firms with the means to invest choose not to.

    Why does the concentration of political and market power deter private investment?

    • Political and fiscal centralisation: Centralisation of political power after 2014 has been accompanied by greater fiscal centralisation and a reconfiguration of federal structures, including attempts to restrict the powers of states and, as a consequence, of regional parties. Eg. The Mines and Minerals (Development and Regulation) Amendment Act, 2026, amending the 1957 law under which the State owns the mineral and signs the lease while the Centre sets the rules and the royalty rate.
    • Market concentration has moved in step: The rise of a handful of large companies, aided by policy, has given them far greater sway over the economy than ever before.
    • One, patronage for smaller firms has dried up: The concentration of political power and the decline in the relative power of regional parties has ended the patronage and protection that were afforded to smaller and regional firms, who could rise up and become national players.
    • Two, policy uncertainty and an uneven playing field: Higher barriers to entry and terms tilted towards larger corporates make it harder for new players to emerge, and firms will not invest if they fear the rules of the game can be arbitrarily changed or that they can be caught on the wrong side of policies. Policy credibility is what is at stake.
    • Three, the fear of being muscled out: Investors fear that business success will be met by a hostile takeover by a national champion, so the question is not whether they are allowed to operate but whether they can stay in business and remain competitive over the next 10 to 20 years.

    Why would dispersing economic power be politically costly?

    • Competition requires a rethink of the strategy: For the larger corporate sector to ramp up investment and for competition to emerge, the strategy of relying on a few national champions needs to be reconsidered.
    • Dispersed economic power funds political opposition: A larger number of big private players would disperse rather than concentrate economic power, which would in turn increase the funding avenues available to Opposition parties.
    • Economic competition feeds political competition: Weakening the concentration of economic power would possibly weaken the concentration of political power, so greater economic competition could lead to greater political competition.
    • The two open questions: It is unsettled whether the current political structure creates the space for new players to safely invest and emerge as competitors to the national champions, or whether market concentration is itself politically useful.

    Why do the ingredients of an investment boom not produce one?

    • The macroeconomic conditions are present: An undervalued exchange rate, depressed real wages and sustained public sector investment in infrastructure are all in place, alongside the demographic dividend.
    • The same mix powered East Asia: This combination powered the rise of countries such as China and South Korea, where firms responded to it with large capacity additions.
    • India’s firms are not responding: Firms are likely to remain hesitant and unsure about investing without a change in the approach, despite those conditions.
    • Confidence, not capability, is binding: Investment decisions are taken only when investors think they have a fair chance of benefiting from them.
    • The end state if nothing changes: The consequent absence of competition raises the possibility of an uncompetitive, high-cost economy.

    Challenges to the national champions strategy

    • Concentration raises consumer and input costs: Dominant firms in a sector face little pressure to hold prices down, which raises costs for every downstream user. Eg. Telecom tariffs rose sharply after the sector consolidated into three private operators. Fix. Use the deal value threshold introduced by the Competition (Amendment) Act, 2023 to review acquisitions that current turnover tests miss.
    • Policy-created advantage is hard to withdraw: Once a group builds capacity on the strength of an incentive, removing the incentive becomes a shock the government is reluctant to deliver. Eg. Most approved incentive under the Production Linked Incentive scheme for large-scale electronics manufacturing has flowed to a small group of mobile phone assemblers. Fix. Publish sunset dates and firm-level disbursement data with each incentive scheme so withdrawal is scheduled rather than negotiated.
    • Concentrated bank exposure transmits firm risk to the system: Lending concentrated in a few large groups converts a single group’s distress into a banking problem. Eg. The corporate loan losses that produced the non-performing asset build-up of the 2010s were concentrated in a handful of infrastructure and metals groups. Fix. Enforce large exposure limits at group rather than borrower level and publish group-wise banking exposure.
    • Bidding rules can favour incumbents: Net worth, prior experience and bank guarantee conditions in auctions and tenders can exclude new entrants before price is considered. Eg. Critical mineral block auctions have repeatedly failed for want of qualified bidders. Fix. Set qualification thresholds proportionate to block or contract size and allow consortium bidding for first-time entrants.
    • Competition enforcement is slow relative to market speed: Investigations concluded years after conduct occurs cannot restore a market that has already tipped. Eg. Appeals against Competition Commission of India orders routinely run for several years before finality. Fix. Fund a dedicated appellate bench for competition matters with statutory disposal timelines.

    Conclusion

    The reluctance of cash-rich Indian firms to invest is being read as a political economy problem rather than a demand or global uncertainty problem. Concentrated political power, an uneven playing field and the fear of being displaced by a national champion together deny new entrants confidence in a 10 to 20 year horizon. Reversing that requires dispersing economic power, which carries political costs the current settlement has no incentive to accept. What remains unresolved is whether market concentration will be treated as a cost to growth or retained as a political asset.

  • What young want, and why creating good jobs is no longer optional

    Why in the News

    Almost 70 per cent of urban job seekers surveyed in Delhi said they were looking for a job that would place them on their ideal career path from the start, instead of settling for any job. The survey covered over 3,000 randomly sampled men and women, 24 years of age on average, living in middle-class residential areas of the capital, and was conducted in the summer of 2023. Their stated career goal was predominantly salaried or formal-sector employment. The Periodic Labour Force Survey (PLFS) for the same year records an urban labour market that cannot supply that goal, with less than 50 per cent of the urban workforce in salaried jobs. A follow-up experiment then exposed a random subset of the same job seekers to real-world job openings and salaries, and re-surveyed them a year later. Correcting their information lowered their expectations and left their aspirations untouched, so the contest is over who adjusts, the young or the labour market.

    What is the Periodic Labour Force Survey (PLFS)?

    • Purpose: The PLFS is the official household survey that estimates how many people are working, seeking work or outside the labour force, and in what kind of work they are engaged.
    • Nodal body: The National Sample Survey Office under the Ministry of Statistics and Programme Implementation conducts it and is the principal source of employment estimates in India.
    • Activity status measures: Usual Status classifies a person by activity over the preceding 365 days, while Current Weekly Status treats a person as unemployed if they did not work even one hour in the reference week.

    What do young urban job seekers actually want from work?

    • A career path, not a job: Almost 70 per cent said they wanted an opening that put them on their ideal career path from the start rather than any available job, and more men said this than women.
    • Formal salaried work is the goal: The stated career goal was predominantly salaried or formal-sector employment rather than casual or own-account work.
    • Women lean harder towards salaried jobs: More women job seekers aspired to salaried positions than men did.
    • Only 14 per cent of women prefer self-employment: Just 14 per cent of the women interviewed said they would rather work for themselves.
    • A third of men want to run enterprises: More than a third of the men wanted to start their own businesses.
    • Public sector preference is a myth: A comparable share of these men and women were looking for private-sector salaried jobs, which cuts against the dominant narrative of a strong preference for government jobs.

    How far does the urban labour market fall short of those preferences?

    • Salaried work is a minority outcome: Less than 50 per cent of India’s urban workforce holds a salaried job.
    • It is scarcer still for the young: Merely one in every three employed 24-year-olds holds a salaried job, a lower share than for the workforce as a whole.
    • Government jobs are a tenth of the market: No more than 10 per cent of the urban workforce is in the public sector or government jobs.
    • The formal private sector is barely larger: Only about 15 per cent of the urban workforce is in the formal private sector.
    • Self-employment is the largest single category: Of those working, 40 per cent are self-employed.
    • Most self-employment is subsistence, not enterprise: An overwhelming majority of these businesses hire no worker at all and report an annual turnover of less than Rs 10 lakh, so the aspiration to build a firm meets a market of one-person shops.

    Why do salary expectations diverge from what these jobs actually pay?

    • The occupations tested: Respondents were asked what they expected to earn as an accounts keeper, a primary school teacher, a data entry operator, a hospital attendant and an electrician, and each expectation was measured against actual PLFS earnings for the same occupation.
    • Expectations run up to 40 per cent above reality: Job seekers expect up to 40 per cent higher salary than the earnings the PLFS records for the same work.
    • Men are the more over-optimistic: Male job seekers expect almost Rs 8,000 more per month than the actual average earnings for these jobs.
    • The gap widens for salaried work: For salaried jobs specifically, male job seekers expect Rs 8,500 more per month than actual earnings.
    • The aggregate divergence exceeds 30 per cent: Taken together, salary expectations sit more than 30 per cent above reality, and the skew is sharper still among job seekers below 25 years of age, especially young men.
    • Information and inexperience explain the gap: A lack of information or outright misinformation about openings and pay, combined with inexperience of the job market, are the two obvious sources of the misalignment.

    What did correcting job seekers’ information change, and what did it leave untouched?

    • The design: A random subset of the 3,000 job seekers was informed about real-world job opportunities and salaries, and both the informed and the non-informed groups were re-surveyed twelve months later.
    • Expectations fell: Accurate information significantly dampened labour-market expectations of landing the ideal job, relative to those who were not informed.
    • Men disengaged first: Men in particular became less likely to report that they were on their ideal career path.
    • Search effort fell with belief: That disillusionment was accompanied by a decline in men’s job-search intensity.
    • The two exits from a failed search: As preferred job offers fail to materialise, job seekers adjust expectations downwards and either remain in the same jobs or leave the labour market and enrol at educational institutions.
    • Aspirations did not move: The answer on whether aspirations changed is a clear no, since these men and women continued to aim for formal-sector jobs or dynamic entrepreneurship a year later, because aspirations are long-term goals and not easily malleable.
    • High education costs make the expectation rational: Good-quality education is increasingly bought from private institutions at rising cost, so a high expected salary is not only aspirational but necessary to recover that outlay.

    Challenges to the Periodic Labour Force Survey

    • Informal work is under-captured: Household surveys do not fully record home-based, gig and platform work in a workforce that is about 90 per cent informal. Eg. Delivery and ride-hailing riders working across two aggregators are frequently recorded as ordinary self-employed workers. Fix. Align the activity definitions with International Labour Organization and System of National Accounts practice so multi-job holders, freelancers and platform workers are counted separately.
    • No skill mapping against job requirements: The survey does not match worker skills to the requirements of available jobs, so structural unemployment cannot be measured from it. Eg. The India Skills Report finding that only about half of graduates are employable has no counterpart in official survey data. Fix. Add a skills and job-requirement module so mismatch is measured rather than inferred.
    • Rural data has been low frequency: Rural estimates were historically produced only once a year, so rural distress is visible with a long lag. Eg. A monsoon failure that pushes workers back into farm labour shows up only in the following annual round. Fix. Extend high-frequency quarterly or monthly rounds to rural areas rather than confining them to towns.
    • Urban bias in the high-frequency rounds: The quarterly bulletins have been confined to urban areas, which under-measures the larger rural workforce. Eg. Quarterly urban unemployment rates are debated publicly while comparable rural numbers are unavailable. Fix. Publish a single integrated quarterly series covering both sectors on the same reference period.
    • New job categories are missing: Gig, digital, start-up and green jobs are not adequately represented in the occupational classification the survey uses. Eg. Solar installation and battery recycling roles have no distinct occupational code. Fix. Integrate Employees’ Provident Fund Organisation, National Career Service and PLFS records so emerging job creation is tracked from administrative data as well.

    Conclusion

    Young urban job seekers want formal salaried careers and dynamic enterprise, and correcting their information about the market lowers what they expect to earn without changing what they want. That asymmetry places the burden of adjustment on the economy rather than on the young, and realising these aspirations requires a structural transformation that creates jobs with regular pay and benefits. The four Labour Codes are a step in that direction, and creating good jobs and genuine career paths, rather than jobs alone, is no longer optional. Failure carries a specific cost, which is the squandered potential of an entire generation.

  • [24th August 2026] The Hindu OpED: Core concerns

    [24th August 2026] The Hindu OpED: Core concerns

    Question (2017, GS3): ““Industrial growth rate has lagged behind in the overall growth of Gross-Domestic-Product (GDP) in the post-reform period” Give reasons. How far the recent changes is Industrial Policy are capable of increasing the industrial growth rate?
    Linkage: The easing of the Manufacturing PMI to its lowest level since August 2021 due to weak domestic demand is a classic real-time symptom of industrial growth lagging behind overall economic expansion. It forces candidates to examine why Indian manufacturing struggles to maintain sustained momentum.

    Mentor Comment

    Growth in the Index of Core Industries slowed to 5.4 per cent in July from 6 per cent in the previous month. The Manufacturing Purchasing Managers’ Index eased in the same month to its lowest level since August 2021, on weak domestic demand conditions. July’s core sector growth was still the second highest rate in the last seven months. The tension sits between that headline and its composition: a large part of the growth rests on a statistical low base effect, the two genuinely strong sectors are cement and electricity, and the domestic crude oil and natural gas sectors have contracted continuously for at least the last 14 months.

    What is the Index of Core Industries?

    • What it measures: The Index of Core Industries measures the combined production of the country’s core infrastructure industries, covering coal, crude oil, natural gas, refinery products, fertilisers, steel, cement and electricity.
    • Why it is watched: These industries carried a combined weight of about 40 per cent in the Index of Industrial Production, so the core index acts as an early read on industrial output before the fuller index is released.
    • Current series: The index is compiled on a revised new series, for which comparable data currently extends back only about 14 months.

    Why is the July core sector number weaker than it looks?

    • Growth rests on a low base: A large part of even this slower growth is based on a statistical low base effect, where a contraction in the corresponding month of the previous year makes the current month’s output look like expansion.
    • Coal illustrates the effect: The coal sector grew at an 11 month high of 7.6 per cent in July. That was measured against a contraction of 12.3 per cent in July of last year.
    • Refinery products repeat the pattern: The refinery products sector snapped a three month streak of contraction to grow at 2.7 per cent. This too was measured against a contraction in July 2025.
    • Iron ore’s strength is partly base driven: The iron ore sector grew at 29.5 per cent, slower than 44.5 per cent in June. Its comparison base is contractions of 16.4 per cent in June and 7.1 per cent in July of last year.
    • The headline flatters the trend: A rate that is second highest in seven months coexists with an easing demand signal, which means the ranking of the number matters less than what produced it.

    Which sectors are carrying the index and which are dragging it?

    • Steel has slowed sharply: The steel sector decelerated to 2.9 per cent in July from 5.6 per cent in June and 15.7 per cent in July of last year. This is a genuine slowdown rather than a base effect.
    • Hydrocarbons are a standing drag: The domestic crude oil and natural gas sectors have contracted continuously for at least the last 14 months for which the new series has data.
    • Electricity remains strong but is decelerating: The electricity sector grew at 9 per cent in July. That was slower than two consecutive months of double digit growth in May and June, which were lifted by prevalent heatwave conditions in many parts of the country.
    • Cement accelerated: The cement sector sped up to 13.1 per cent, the clearest genuine acceleration in the index.
    • The bright spots are only two: Within the core index, cement and electricity were the only two sectors reading as bright spots, and such positive trends were few and far between.

    Does the core sector number describe output or demand?

    • The two indicators point in opposite directions: The core index recorded its second highest growth in seven months in the same month that the Manufacturing Purchasing Managers’ Index fell to its lowest since August 2021.
    • They measure different things: The core index counts physical production in a set of infrastructure industries. The Manufacturing Purchasing Managers’ Index records what purchasing managers report about new orders and demand conditions.
    • A base effect can mask a contraction: A sector recovering from a deep fall registers a high growth rate at a low level of output, so a rate can rise even as demand conditions ease.
    • Weather and construction are not demand: The strongest readings came from electricity, lifted by heatwave conditions, and from cement, which tracks construction activity rather than broad consumer demand.
    • The forward reading is slack: Easing demand conditions were already being predicted by other indicators before the core sector data appeared, so the July slowdown was not a surprise.

    How is energy import dependence turning into a cost shock?

    • Import volumes are rising: India’s crude oil imports rose 13.3 per cent in volume terms in July. Liquefied Natural Gas (LNG) imports grew a more marginal 1.5 per cent.
    • Domestic supply is not filling the gap: Against the falling domestic base noted above, the economy’s appetite is being met from abroad rather than from home production.
    • The bill has jumped: High oil prices meant the crude oil import bill jumped 41 per cent in July, so a 13.3 per cent volume rise translated into a far larger payment outgo.
    • A tariff shock is queued behind it: The 100 per cent tariffs the United States is preparing to levy on countries such as India that import Russian oil will once again burden Indian exporters.
    • Blending has not yet displaced imports: Moving to 20 per cent ethanol blending has not yet impacted oil imports materially, so the substitution effect is not visible in the July numbers.

    Challenges to the Index of Core Industries as a growth signal

    • Base effects distort the headline rate: A contraction in the year ago month converts a modest recovery into a high growth print, which misleads on the level of output. Eg. Coal’s 11 month high of 7.6 per cent in July sat on a 12.3 per cent contraction in July of the previous year. Fix. Publish index levels and two year compound rates alongside the year on year rate in every release.
    • Coverage is narrow: The index tracks a small set of infrastructure industries and therefore misses most of the economy’s output. Eg. Services contribute over half of Gross Value Added and are entirely outside the core index. Fix. Publish the core index alongside a high frequency services activity indicator so the composite reading is visible.
    • Weights favour public sector heavy industries: The largest weights sit in sectors dominated by public enterprises and administered pricing, so the index responds to policy decisions as much as to market demand. Eg. Refinery products and electricity output move with administered allocation and tariff decisions. Fix. Rebase and reweight the index on a fixed cycle with published sensitivity of the headline to each sector’s weight.
    • Informal and small firm output is invisible: Production by micro and small enterprises is not captured, so a squeeze concentrated there does not register. Eg. Of about 64 million micro, small and medium enterprises, only around 14 per cent have access to formal credit and most stay outside statistical registers. Fix. Link the index to Goods and Services Tax e-way bill and electronic invoice data to capture small firm activity.
    • Provisional data is heavily revised: Early estimates are released on partial returns and are revised in later months, so a policy read taken on the first print can reverse. Eg. Iron ore’s July reading of 29.5 per cent followed a June figure of 44.5 per cent, a swing large enough to change the quarterly picture on revision. Fix. Publish a standing revision history for each sector so the reliability of the first print is visible.
    • It reads supply, not demand: The index counts what was produced, not what was bought, so it can rise while orders fall. Eg. July’s core growth of 5.4 per cent coincided with the Manufacturing Purchasing Managers’ Index at its weakest since August 2021. Fix. Present the core index and the demand side survey indicators in a single monthly dashboard rather than as separate releases.

    Conclusion

    The Indian economy looks set for a period of slack demand, higher costs and moderating growth. The July core sector reading does not contradict that: a large part of its growth is base driven, only cement and electricity grew genuinely strongly, and the sectoral spread set out above is narrow. The cost side is worsening independently, on the import bill and the tariff exposure already recorded. Whether the next few months show a genuine industrial recovery depends on domestic demand rather than on the base against which growth is measured.

    Industrial Growth in India

    • Manufacturing’s share is stuck: Manufacturing contributes around 17 per cent of Gross Domestic Product (GDP), far below the 25 per cent target set under Make in India.
    • Global standing: India holds about 2.8 per cent of global manufacturing output against China’s roughly 29 per cent, with domestic manufacturing output nearing $1 trillion in 2025-26.
    • Concentration: Maharashtra, Gujarat and Tamil Nadu account for about 40 per cent of net value added in manufacturing, and half the States have no operational Special Economic Zone.

    Government Initiatives for Industrial Growth

    • National Manufacturing Mission: Announced in the 2025-26 Budget, it unifies manufacturing policy and targets a 25 per cent GDP share with 143 million jobs by 2035.
    • Production Linked Incentive Scheme: Covers 14 sunrise and strategic sectors with outcome linked incentives, drawing over ₹1.76 lakh crore in committed investment as of March 2025.
    • Semiconductor Mission: A ₹76,000 crore framework under which 10 projects worth about ₹1.60 lakh crore have been approved.
    • Industrial Corridors Programme: India approved 11 corridors covering 32 projects, with 12 new industrial nodes cleared in 2024 for plug and play industrial cities.

    Challenges in Industrial Growth

    • Compliance load falls on small firms: Micro, small and medium enterprises face over 1,450 annual compliances, which consumes management time that would otherwise go into expansion. Eg. Annual compliance costs for such firms run to ₹13 lakh to ₹17 lakh. Fix. Adopt third party certification in place of repeat inspections, as the Ajay Shankar Committee recommended.
    • Regional concentration leaves capacity idle: Industrial value added clusters in three States, so national incentives do not translate into national capacity. Eg. Half of India’s States have no operational Special Economic Zone. Fix. Weight central incentive disbursal toward States below the national share of net value added.
    • Technology transition is slow in strategic segments: Domestic capability lags in electronics, semiconductors and renewable energy components, which keeps high value assembly abroad. Eg. India remains heavily dependent on imports for semiconductors and advanced electronic components. Fix. Extend Production Linked Incentives to upstream segments such as advanced materials and green hydrogen rather than final assembly alone.
    • Credit does not reach small manufacturers: Formal finance is unavailable to the great majority of small firms, so they cannot fund the fixed capital that raises productivity. Eg. The unmet credit demand of the micro, small and medium enterprise sector is estimated at about ₹20 lakh crore to ₹25 lakh crore. Fix. Expand cash flow based lending against Goods and Services Tax returns rather than collateral based assessment.
    • Trade barriers raise export uncertainty: Tariff action by large markets can remove the price advantage of an entire export segment without notice. Eg. The United States imposed a 50 per cent tariff in August 2025, hitting about 55 per cent of India’s exports to that market. Fix. Deepen global value chain participation through trade agreements and diversify destination markets under a China plus one strategy.
  • A dry spell along the Cauvery river

    A dry spell along the Cauvery river

    Why in the News

    Karnataka appealed to the Cauvery Water Management Authority (CWMA) on 11 August to cut its daily release to Tamil Nadu from 12,000 cusecs to 10,000 cusecs. It warned of a severe drinking water shortage if more water were released for crops in the Cauvery basin. Tamil Nadu had already chosen not to open the Mettur dam for irrigation on the customary date of 12 June, given a poor south-west monsoon forecast attributed to a super El Nino. Large tracts of the Cauvery delta consequently remain barren in a season that normally carries two crops. The dispute is no longer only between an upper and a lower riparian State, because Karnataka is simultaneously rationing its own canal irrigation and committing reservoir water to Bengaluru’s drinking supply.

    What is the Cauvery water-sharing arrangement?

    1. The dispute predates the States: The sharing of the Cauvery is a vexed issue going back more than 130 years, to agreements between the Mysore Kingdom and the Madras Presidency that were drawn without regard to any future State boundary.
    2. The award fixes an annual quota and a monsoon share: The Cauvery Water Disputes Tribunal and the Supreme Court provided for Karnataka to release 123.14 thousand million cubic feet of the 177.25 thousand million cubic feet annual quota during the south-west monsoon. That share is mostly meant to support paddy cultivation in the Samba season.
    3. A central authority administers the sharing: The CWMA was set up in June 2018 by the Union government to handle water-sharing from the Cauvery among Karnataka, Tamil Nadu, Kerala and Puducherry.
    4. A technical committee advises it: The Cauvery Water Regulation Committee (CWRC) assesses storage and crop requirement and recommends releases to the CWMA, and both bodies sit under the Supreme Court’s continuing supervision.

    What is a cusec?

    1. A cusec measures flow, not volume: A cusec is one cubic foot per second, so a release order of 12,000 cusecs fixes the rate at which water must cross the inter-State point rather than a total quantity.

    What is a TMC?

    1. A TMC measures volume: A thousand million cubic feet (TMC) is a stock of water, roughly 28.3 million cubic metres. Reservoir capacity and annual quotas are stated in TMC rather than in the cusecs used for daily obligations.

    Why does the delta’s cropping calendar depend on a single dam opening date?

    1. One release date sets the whole season: Water released from the Mettur dam, built in Salem district across the Cauvery, on 12 June for irrigation ordinarily reaches Tiruvarur about 300 km downstream by 23 or 24 June. This year nothing reached it.
    2. Two seasons run off that release: Paddy is ordinarily cultivated across 5.3 lakh acres in the delta during the short-term Kuruvai season, followed by 12.9 lakh acres during the longer Samba-Thaladi season.
    3. Samba is the season that matters: Samba transplantation begins in late July or early August and the harvest ends in mid-January, and the crop is both a food security crop and the mainstay of the delta’s rural economy.
    4. Kuruvai is the higher-yield gamble: The shorter-duration Kuruvai crop can offer higher yields and is largely dependent on groundwater drawn through energised pumpsets rather than on canal water.
    5. The acreage has already collapsed: Tamil Nadu government data put the area under paddy cultivation this year at 4.5 lakh acres, against the 5.3 lakh acres the Kuruvai season alone normally covers.

    How is Karnataka rationing its own irrigation?

    1. Farmers sowed against official advice: Farmers across Karnataka’s Cauvery basin defied advice against sowing water-intensive crops such as paddy and sugarcane this season, amid a predicted deficient monsoon and inadequate inflows into the basin’s reservoirs.
    2. A brief August revival encouraged them: The Krishna Raja Sagara (KRS) reservoir has a full level of 124.8 feet. It rose from 93 to 94 feet to over 100 feet within days in the first week of August before stagnating at 109 feet.
    3. The canal system runs off that reservoir: The Visvesvaraya canal system draws water from the KRS reservoir, located across the Cauvery near Mysuru, and serves the Mandya belt.
    4. Releases were cut to four rotational cycles: The Cauvery Irrigation Advisory Committee, a regional body chaired by the Karnataka Water Resources Minister, met in Bengaluru on 19 August and decided to release canal water in only four rotational cycles during the crop season instead of continuously.
    5. The stated purpose is storage, not irrigation: The decision was taken to conserve reservoir storage and ensure water availability for other needs, including drinking water.
    6. Rotation does not sustain a standing crop: A pattern of about 15 days of release followed by 15 days without will not provide enough water for paddy and sugarcane, and leaves farmers able to grow only dry crops.

    What are farmers at the canal’s tail end facing?

    1. The tail end gets water last or not at all: A farmer in Kuntanahalli village of Maddur taluk in Mandya district has raised a paddy nursery on a two-acre plot lying at the tail end of the Visvesvaraya canal system.
    2. The window is measured in days: Without water in the next 7 to 10 days he loses both the sowing season and the Rs 8,000 already spent on raising the nursery.
    3. Switching crops is not a safe alternative: Semi-dry crops such as ragi, pulses and oilseeds are the fallback, and heavy rain arriving late can damage a ragi crop just as its absence damages paddy.
    4. Position on the canal decides outcomes: Paddy transplantation is nearly complete in Karekura and Hosahalli, close to the KRS reservoir, and even there farmers who normally take two crops a year doubt the second.
    5. Losing a crop means becoming a labourer: Most agricultural labourers in the region earn Rs 400 to Rs 500 for a day’s work from 7 a.m. to noon, which is the fallback income for a farmer whose second crop fails.
    6. Sugarcane is exposed for longer: A standing sugarcane crop in Pandavapura taluk needs another nine months before harvest, and without timely rain may not even be fit for use as cattle fodder.
    7. Debt is the binding constraint: Farmers have taken interest-free short-term loans from primary agricultural cooperative credit societies and high-interest loans from microfinance companies, and are seeking a waiver and restraint on aggressive recovery agents.

    Does Bengaluru’s drinking water come at the cost of the Cauvery’s irrigators?

    1. A new drinking water stage is already sanctioned: The Cauvery Stage VI drinking water project is a Rs 6,939 crore initiative approved by the Karnataka government this February.
    2. It adds a fixed annual claim on the river: The project requires an additional 6 thousand million cubic feet of Cauvery water every year, which is a permanent first charge rather than a seasonal allocation.
    3. The service area extends beyond the city: It will supply 500 million litres per day to roughly 30 lakh residents in Bengaluru and the adjoining towns of Bidadi, Hoskote, Anekal, Devanahalli and Nelamangala.
    4. The diversion is from the same reservoir: Farmers in Maddur taluk are bracing for confrontation with the State government over the proposed diversion of KRS water. Their canal draws from the same reservoir.
    5. The competing claim is now internal: The canal rationing decision was justified by the need to protect drinking water, so the same argument that limits releases to Tamil Nadu also limits releases to Karnataka’s own irrigators.

    Why has farmer protest stayed muted this year?

    1. Mobilisation has fallen flat: Protests over poor rainfall and releases to Tamil Nadu have remained muted compared with previous years, and a Karnataka bandh called by a Kannada activist on 13 August drew a lukewarm response outside parts of Maddur taluk.
    2. Farm bodies cannot bring out their own members: The organising secretary of the Mandya District Raithara Hitharakashana Samithi, a farmers’ welfare committee, records that farmers who are the main stakeholders are not responding to calls for struggle.
    3. Ruling party leaders are discouraging the streets: Cultivators say ruling party leaders are warning them against joining what they call an “Opposition trap”, and against the police stations and court appearances that follow a protest.
    4. The Chief Minister has publicly discouraged it: The Karnataka Chief Minister has chastised activists for staging Cauvery protests “for the sake of publicity”, and warned against wading into the river after the Water Resources Department issued a flood alert over releases from the near-brimming Kabini reservoir.
    5. The State’s own position is two-sided: The Chief Minister has acknowledged that Karnataka’s dams are not yet full and vowed to protect farmers’ interests. The same statement emphasised compliance with directions on releasing water to Tamil Nadu.
    6. Farmers question the State’s legal effort: The president of the State Sugarcane Farmers’ Association questions whether the government and its legal team have made a strong enough case before the CWRC, the CWMA and the Supreme Court about the water crisis inside Karnataka.

    What positions have the two States taken?

    1. Tamil Nadu blames storage and shortfall in releases: Low storage at the Mettur dam and Karnataka’s failure to release a sufficient share of the water it received in June and July are the two grounds Tamil Nadu cites for the barren delta.
    2. The reservoir is far below the release threshold: The Mettur dam level is now about 85 feet against a full capacity of 120 feet, and farmer bodies argue that no water should be released until the level reaches at least 100 feet.
    3. The opening date is still unannounced: The Tamil Nadu government has not announced when the Mettur dam will be opened, and it continues its legal battle with Karnataka to secure the State’s share.
    4. It is contesting the reduction in court: Tamil Nadu has strongly opposed Karnataka’s push to reduce releases and is pressing the Supreme Court to ensure strict adherence to the mandated 12,000 cusecs daily flow.
    5. The position is framed as a rights claim: The Tamil Nadu Chief Minister has said the legitimate rights of lower riparian States and the livelihoods dependent on assured river flows must be fully protected.

    What does the delta contribute and what is it losing?

    1. The delta is the State’s rice bowl: Located along the eastern coast and spanning Thanjavur, Tiruvarur, Mayiladuthurai and Nagapattinam, it is characterised by fertile alluvial soil and a tropical climate carried by the Cauvery’s flow.
    2. It supplies most of the State’s procured paddy: During the 2025-26 procurement year, from 1 September 2025 to 31 July 2026, the region contributed 39.5 lakh tonnes of paddy out of a Statewide procurement of 57.5 lakh tonnes.
    3. The failure is visible across districts: A drive of over 200 km from Tiruchi through Thanjavur, Thiruvaiyaru, Tiruvarur and Mannargudi shows largely barren paddy fields where the previous year showed continuous green.
    4. The official acreage may overstate the crop: Some agriculturists dispute the reported figure, citing stunted growth and crops showing signs of withering, which make an area-sown count unreliable as a measure of what will be harvested.
    5. The loss spreads beyond the fields: Economic activity in the region is crippled by the erosion of livelihood opportunities, and shops and other businesses in Mannargudi now down their shutters by 7 p.m.
    6. The poorest bear it first: Much of the zone remains economically backward with a majority dependent on agriculture, and Scheduled Castes, who live there in large numbers, constitute the dominant segment of landless agricultural labourers.

    Why is groundwater not a fallback for the delta?

    1. The water table is falling even between two rivers: In Peramur, about 10 km from Thiruvaiyaru and located between the Cauvery and its branch the Coleroon, the water level is going down.
    2. Extraction technology has migrated to the delta: Submersible pumpsets, once more common in the dry districts of Coimbatore and Dharmapuri, have become commonplace in the delta.
    3. Over-extraction has damaged the resource permanently: Excess withdrawal has led to salinity ingress in many areas, which removes land from cultivation rather than merely reducing a season’s yield.
    4. The Kuruvai fallback is therefore closing: The shorter crop that depends on pumped groundwater is becoming harder to raise in the very years when canal water fails, so the two sources fail together rather than covering for each other.

    What do farmers want, and what will they get?

    1. Compensation demands have begun: Several farmers’ groups have started demanding compensation for crop losses across the delta.
    2. The announced waiver is considered inadequate: Farmers are unhappy with the crop loan waiver scheme announced by the Tamil Nadu Chief Minister and are seeking a full, unconditional waiver of up to Rs 1 lakh for every farmer who has taken a crop loan.
    3. Relief is conditional on a disaster classification: Any compensation will be subject to the Union and State governments’ norms for natural disasters and to a survey by the departments concerned.
    4. Officials are still counting on the monsoon: With about a month left in the season, officials continue to hope for a revival that would allow at least a partial Samba crop.

    Challenges to Cauvery water sharing

    1. The award has no distress-year formula: The allocation assumes a normal monsoon and offers no proportionate sharing rule for a deficit year, so every shortfall becomes a fresh contest. Eg. Karnataka’s request to cut releases from 12,000 to 10,000 cusecs has to be argued case by case rather than settled by a rule. Fix. Notify a pro-rata distress sharing schedule tied to measured basin inflow, so releases fall automatically and equally in a deficit year.
    2. Drinking water and irrigation are not ranked: The award prioritises drinking water in principle without capping how much a growing city may draw, so urban demand expands against a fixed river. Eg. Delhi’s drinking water share of the Yamuna has been litigated against upstream States in the Supreme Court for over two decades. Fix. Fix an audited ceiling on urban drawal from the basin, conditional on the city reusing a notified share of its treated wastewater.
    3. The Article 262 bar is routinely circumvented: Article 262 lets Parliament exclude the courts from water disputes, and States nonetheless reach the Supreme Court through special leave petitions under Article 136. Eg. The Cauvery allocation has been litigated in the Supreme Court repeatedly after the Tribunal’s award. Fix. Amend the Inter-State River Water Disputes Act, 1956 to make a tribunal award final on quantum, leaving only implementation questions justiciable.
    4. Tribunals take decades to decide: Article 262 sets no time limit, so an award arrives after the cropping economy it was meant to govern has already changed. Eg. The Cauvery Water Disputes Tribunal took 17 years to deliver its decision. Fix. Enact the pending Inter-State River Water Disputes (Amendment) Bill and apply its timelines to disputes already before a tribunal.
    5. Flow data is contested rather than shared: Each State measures inflow and utilisation on its own gauges, so the basic facts of a deficit year are disputed before the sharing question is reached. Eg. Karnataka and Tamil Nadu differ on how much of the June and July inflow was actually released downstream. Fix. Operate a single telemetered gauge network under the CWMA with readings published in real time and binding on both States.
    6. The dispute pays politically: Regional parties gain from an unresolved conflict, so neither an implementation habit nor a negotiated settlement is rewarded at the ballot. Eg. A bandh call and a protest ban were both issued in the same fortnight in Karnataka this month. Fix. Route inter-State negotiation through the Inter-State Council under Article 263, where a recorded agreement carries a political cost to abandon.

    Conclusion

    A deficient monsoon has converted the Cauvery allocation from a sharing arrangement into a distress-year contest that the award was never designed to settle. Karnataka is rationing its own canal command to four rotational cycles and committing an additional annual volume to Bengaluru’s drinking supply. Tamil Nadu’s delta has lost a season because the Mettur dam was never opened. The immediate decisions rest with the Cauvery Water Management Authority on the daily release rate and with the Tamil Nadu government on the dam opening date. Neither will be settled this season without a rule for sharing a shortfall, which is exactly what the existing award does not contain.

    “[2024, GS3, 15 marks] What are the major challenges faced by Indian irrigation system in recent times? State the measures taken by the government for efficient irrigation management.”

  • [22nd May 2026] The Hindu OpED: Noise annoys: India must enforce noise pollution regulations uniformly and consistently

    [22nd May 2026] The Hindu OpED: Noise annoys: India must enforce noise pollution regulations uniformly and consistently

    Question (2020, GS2): “Judicial Legislation is antithetical to the doctrine of separation of powers as envisaged in the Indian Constitution. In this context justify the filing of large number of public interest petitions praying for issuing guidelines to executive authorities.
    Linkage: This question directly addresses the core tension of the Patna High Court case: whether courts issuing executive-style guidelines (like noise limits and enforcement mechanisms) violates the separation of powers, or if it is justified by the sheer volume of public interest petitions stemming from executive inaction.

    Mentor comment

    The Patna High Court issued Statewide directives on the emission of high-decibel noise through an order dated 14 August 2026. The order closes an escalation that began in Surendra Prasad vs State of Bihar. A February 2025 hearing before a single judge in that case acknowledged DJ trolleys and loudspeakers to be a major source of noise in Patna. The same hearing criticised the Bihar State Pollution Control Board (BSPCB) for failing to curb the problem. India already has comprehensive noise law, so the directives are not filling a gap in the rules. What is contested is whether a constitutional court that has taken on the functions of a regulator is a remedy or an admission that routine enforcement has collapsed.

    What are the Noise Pollution (Regulation and Control) Rules, 2000?

    1. Subordinate legislation under an environmental statute: The Rules were made under the Environment (Protection) Act, 1986, and noise is separately treated as an air pollutant under the Air (Prevention and Control of Pollution) Act, 1981 when present in harmful concentrations.
    2. Limits are set zone by zone and by time of day: The Rules fix permissible ambient limits across residential, commercial, industrial and silence zones, with a lower limit at night than by day. Residential areas must stay below 55 decibels by day and 45 decibels at night.
    3. Silence zones carry a stricter regime: Areas within 100 metres of hospitals, educational institutions and courts are silence zones, with tighter limits and restrictions on loudspeaker use.
    4. Loudspeakers are barred at night: Loudspeakers and public address systems may not be used between 10 p.m. and 6 a.m., with a limited festival relaxation that a State government may notify.

    What is a decibel?

    1. A logarithmic unit, not a linear one: The decibel scale compresses a very wide range of sound intensities, so a rise of 10 decibels is a tenfold increase in sound energy and is perceived as roughly a doubling of loudness.
    2. Standards are set as averages, not peaks: Ambient noise limits are expressed as day and night equivalent levels for a zone, which is why a single loud event can breach the limit for an entire area.

    How did a single city’s complaint become a Statewide order?

    1. The Board was told to produce the enforcement record: After criticising the BSPCB, the Court directed it to obtain reports from the police on permissions granted to operators of these noise sources and on the action taken against them.
    2. The record showed enforcement stopping at the town boundary: In October the police reported seizing equipment and levying fines over three months in Patna, Barh and Fatuha, and taking no action at all in Masaurhi.
    3. A nil return was treated as evidence of non-enforcement: The judge called the picture “unbelievable” for suggesting there were no noise violations in Masaurhi at all.
    4. The Court moved from records to persons: Police officers were summoned in the course of the hearings, and boilerplate affidavits filed in response were upbraided from the bench.
    5. The escalation ended in Statewide relief: The 14 August order extended what began as a Patna grievance into directives binding across Bihar.

    What did the Patna High Court direct?

    1. Enforcement must become routine, not complaint-driven: Authorities were directed to pursue enforcement on their own initiative rather than waiting for a member of the public to file a complaint against a specific source.
    2. Operators must register themselves: DJs, sound-system operators and event halls were directed to register with the subdivisional authorities, which converts an invisible population of operators into a listed one.
    3. The cut-off was moved forward by five minutes: Loudspeakers were directed to stop playing at 9.55 p.m., five minutes before the law’s 10 p.m. limit.
    4. The five minutes are a compliance device, not a concession: The margin gives operators time to wind up, and it removes the defence that carrying on past 10 p.m. is only a matter of a few minutes.

    Why does enforcement fail even where the law is comprehensive?

    1. The failure is in application, not in drafting: Comprehensive rules have existed since 2000, and the Court’s intervention illustrates how dismal enforcement has become despite them.
    2. Complaint-based enforcement puts the cost on the victim: It is absurd to expect the public to complain about every DJ or horn before the police can respond, and a complainant in a small town faces the operator socially afterwards.
    3. Governments have an incentive to tolerate the violation: Loud events belong to constituents, and antagonising them carries a political cost that enforcement carries no matching reward for.
    4. Responsibility is split between two agencies: The pollution control board owns the standards and the police own the power to seize and prosecute, so neither is accountable for the outcome when the other does nothing.
    5. Episodic action has hardened into the norm: Drives launched around a festival and abandoned afterwards teach operators that the rule applies for a fortnight in the year.

    Does uniform noise enforcement collide with the right to practise culture?

    1. The sources are ordinary social occasions: Loud noise is produced by festivals, weddings, political campaigns and religious events, not mainly by industry, so every enforcement action touches a social gathering.
    2. Enforcement therefore reads as interference: Rules create friction with people who believe they have a right to practise their culture as they deem fit, which is what makes the state reluctant to act.
    3. The competing right is also constitutional: Courts have repeatedly held that people have a right under Article 21 to be protected from unlawful noise, so the question is between two claimed rights and not between culture and convenience.
    4. The claim has already been decided: A Supreme Court ruling of 2005 held that noise pollution violates Article 21 and that the use of loudspeakers, even for religious purposes, is not a fundamental right.

    Is a High Court acting as a regulator a solution or a symptom?

    1. The Court is doing the executive’s work: With episodic enforcement having become endemic, the Patna High Court becoming a quasi-regulator is creditable as a stopgap measure.
    2. A stopgap is not a regulatory system: A court supervises through hearings and contempt, which is an expensive and slow substitute for routine administrative enforcement by a subdivisional officer.
    3. Court-driven compliance decays when the case ends: Enforcement sustained by a listed matter tends to lapse once the bench changes or the petition is disposed of.
    4. The right test is behavioural, not judicial: The success of the order should be measured by whether the State develops a consistent habit of enforcement, not by the number of directions issued.

    Challenges to enforcing the Noise Pollution Rules, 2000

    1. Penalties are too small to deter: Fines under the general environmental penalty provisions are trivial against the earnings of a single wedding or campaign engagement, so paying is cheaper than complying. Eg. Equipment seizures rather than fines were what the Bihar police reported as their main action. Fix. Move to graded penalties linked to the event’s scale and to cancellation of the operator’s registration on a second breach.
    2. Traffic noise sits outside the permission system: The largest single urban source is road transport, and horns and modified silencers are not covered by any event permission or registration regime. Eg. Metros such as Delhi and Mumbai routinely breach the 55 decibel residential daytime limit. Fix. Enforce horn and silencer standards through automated noise cameras at signalised junctions, linked to the vehicle registration database.
    3. Silence zones are breached where enforcement matters most: Hospitals, schools and courts sit on arterial roads where the 100 metre silence zone cannot be maintained without traffic management. Eg. Silence zone signage exists around most large hospitals without any accompanying restriction on the road. Fix. Require every notified silence zone to carry a traffic calming plan approved along with the zone notification.
    4. Festival relaxations become the operating rule: States may permit loudspeaker use beyond the night limit on a small number of days a year, and the exemption expands informally into the surrounding weeks. Eg. Enforcement drives are routinely suspended for the length of a festival season rather than for the notified days. Fix. Publish the notified relaxation dates in advance and require a written order for any extension, subject to review.
    5. The register has no custodian system: The subdivisional offices directed to hold the operator register have no software, no dedicated staff and no publication duty attached to it. Eg. The nil action return from Masaurhi shows what an unmonitored subdivision produces. Fix. Host the operator register online at State level with each permission and each violation recorded against the operator’s entry.
    6. Data does not exist to prove a breach: Prosecution needs a calibrated measurement at the time and place of the offence, and most police stations have no sound level meter. Eg. Real-time ambient noise monitoring covers only a handful of Indian cities. Fix. Equip every police station in a notified urban area with a calibrated meter and make the reading an admissible enforcement record.

    Conclusion

    India’s noise problem is a failure of routine enforcement rather than a gap in law, and the Patna High Court has had to supply the enforcement architecture the executive did not, through mandatory registration, self-initiated policing and a wind-up margin before the statutory cut-off. Court supervision is a legitimate stopgap and it is not a regulatory system. The order will have worked only if the State keeps registering operators and acting on violations after the case is no longer listed. Consistency, not the number of directions, is the measure.

    Noise Pollution in India

    1. About: Noise pollution is excessive, unwanted or harmful sound that disrupts the environment and harms human health, arising from traffic, industry, construction, loud music and public events beyond permissible levels.
    2. Health burden: Chronic exposure raises hypertension, heart disease and stroke risk, and workplace noise alone causes around 500,000 hearing loss cases globally each year.
    3. Wider effects: Noise impairs children’s learning and drives stress, anxiety and depression, and it disrupts animal communication and breeding. Eg. Marine traffic noise disorients whales and dolphins that depend on echolocation.
    4. Policy standing: The United Nations Environment Programme declared noise an emerging environmental threat in 2022, and the European Environment Agency now ranks it among the top three environmental health risks behind only air pollution and temperature.

    Laws and Rules Governing Noise Pollution

    1. Air (Prevention and Control of Pollution) Act, 1981: Includes noise within the definition of an air pollutant where it is present in concentrations harmful to humans, animals, plants, property or the environment, and industrial noise is regulated by State Pollution Control Boards under it.
    2. Environment (Protection) Rules, 1986: Prescribe source-specific noise standards for motor vehicles, air conditioners, refrigerators, diesel generators and construction equipment.
    3. Motor Vehicles Act, 1988 and rules made under it: Prohibit multi-toned and shrill horns and the removal or alteration of a silencer, and provide the basis for vehicle noise limits at the point of type approval.
    4. Bharatiya Nyaya Sanhita, 2023: Retains public nuisance as an offence. Police most often invoke that provision against a loudspeaker operator in the absence of a measured reading.

    Key Facts about Noise Standards

    1. World Health Organization (WHO) Environmental Noise Guidelines, 2018: Recommend 45 decibels by day and 40 decibels at night for road traffic noise, values stricter than India’s residential limits.
    2. European burden estimate: Transport noise causes an estimated 66,000 premature deaths a year in Europe, along with 50,000 new cardiovascular cases and 22,000 type-2 diabetes cases.
    3. Scale of exposure: Over 20 per cent of Europeans, more than 110 million people, face harmful transport noise, with 4.6 million reporting severe sleep disturbance.
    4. Firecracker limit in India: The Central Pollution Control Board caps firecracker noise at 125 decibels measured at 4 metres from the point of bursting.

    Back2Basics: State Pollution Control Boards

    1. Statutory basis: Constituted by State governments under the Water (Prevention and Control of Pollution) Act, 1974, and given further functions under the Air (Prevention and Control of Pollution) Act, 1981.
    2. Composition: A chairman with knowledge of environmental protection, officials nominated by the State government, representatives of local authorities, and representatives of companies and corporations.
    3. Core power: Grant, refuse or withdraw consent to establish and consent to operate for any industry discharging effluent or emitting pollutants, which is the licence an industry cannot run without.
    4. Relationship with the Centre: The Central Pollution Control Board lays down standards, coordinates the boards and resolves disputes between them, and may direct a State board on any matter.
  • The birth story no one prepared me for

    The birth story no one prepared me for

    Why in the News

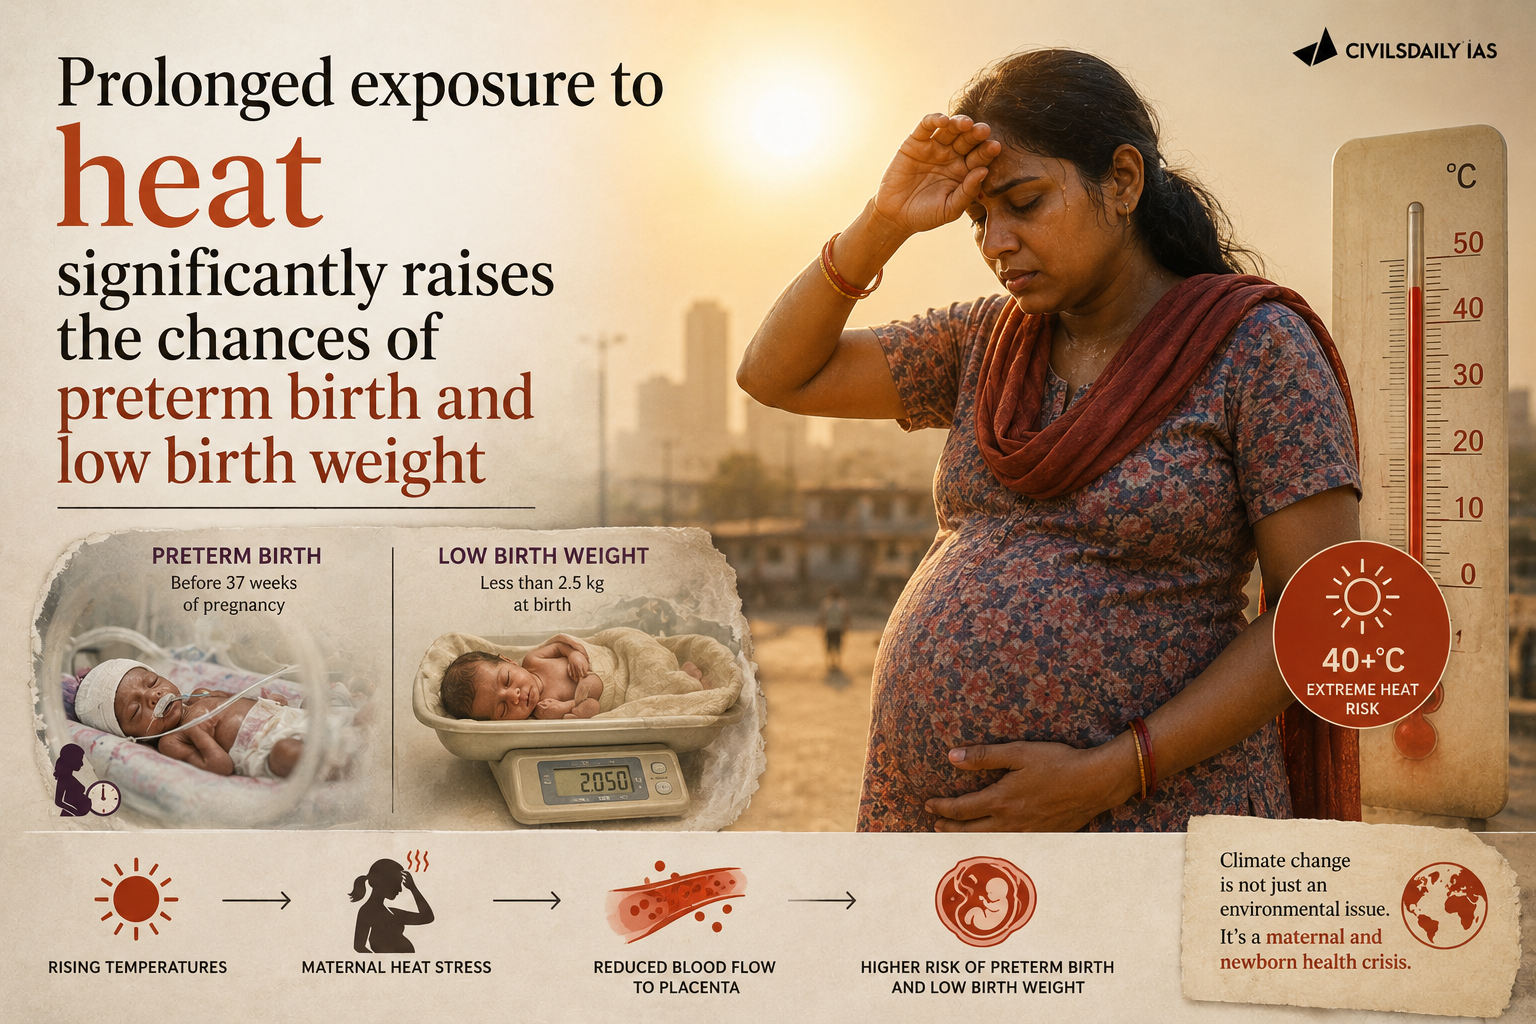
    Preterm births in India are rising, and Delhi alone has recorded a 21 per cent increase over the past five years. A study by the Indian Institute of Technology Delhi with international universities analysed National Family Health Survey data for 2015 to 2020. It established that prolonged exposure to heat significantly raises the chances of preterm birth and low birth weight. Motherhood in India continues to be narrated through the language of labour pain, sacrifice and endurance. That language describes a full-term vaginal delivery and nothing else. Causation is moving towards environmental exposure no individual can control. Responsibility is still located in the mother’s body.

    What is preterm birth?

    1. A birth before 37 completed weeks: Preterm birth is delivery before 37 completed weeks of gestation, counted from the first day of the last menstrual period.
    2. Three severity bands: The World Health Organization classifies births before 28 weeks as extremely preterm, 28 to 32 weeks as very preterm, and 32 to 37 weeks as moderate to late preterm.
    3. Low birth weight is a separate marker: A newborn weighing under 2,500 g is classified as low birth weight, with or without prematurity. The risk compounds when both are present.
    4. India carries the largest absolute burden: India records the highest number of preterm births of any country, at roughly three million a year, which is close to a fifth of the global total.

    What is kangaroo mother care?

    1. Skin-to-skin contact as clinical treatment: Kangaroo mother care places the low birth weight infant upright against the parent’s bare chest for prolonged periods, combined with exclusive breastfeeding, to stabilise temperature, heart rate and breathing.
    2. It is recommended from birth: The World Health Organization advises immediate and continuous kangaroo mother care for infants born under 2,000 g rather than delaying it until the infant is clinically stable.

    What does care inside a neonatal intensive care unit actually involve?

    1. Time is measured by instruments, not routines: Days inside a neonatal intensive care unit (NICU) are structured around oxygen saturation levels, heart-rate monitors and machine alarms rather than feeding schedules or sleepless nights.
    2. The first contact is mediated by equipment: Early memories of motherhood are of incubators and wires rather than of cradling a child, with infants weighing a few hundred grams held for kangaroo mother care.
    3. The mother is a patient at the same time: A caesarean delivery leaves the mother recovering from major abdominal surgery. The infant is treated several corridors away, so hours of sitting are managed through incision pain.
    4. Stays run into weeks, not days: A NICU admission after a very preterm delivery commonly runs six weeks or longer, which is a period of hospital residence rather than a hospital visit.
    5. Solidarity forms sideways, not from clinicians: Support comes from nurses, guards, hospital staff and other mothers in the same unit, who mark small milestones together and register each other’s setbacks.

    Why do preterm births keep rising in India?

    1. Maternal nutrition: The nutritional health of mothers is a direct contributor, with anaemia and low pre-pregnancy weight raising the risk of early delivery.
    2. The changing pattern of pregnancies: Later first pregnancies, higher rates of assisted conception and more multiple births all shift the distribution towards earlier deliveries.
    3. Environmental factors: A significant part of the rise is attributable to environmental exposure rather than to maternal or clinical factors.

    What does the parallel rise in caesarean sections indicate?

    1. Caesarean rates have moved well past the clinical reference range: The National Family Health Survey records 21.5 per cent of deliveries as caesarean nationally, against the 10 to 15 per cent range the World Health Organization treats as the point beyond which population level benefits stop.
    2. The private sector drives the gap: Caesarean deliveries account for 47.4 per cent of births in private facilities against 14.3 per cent in public facilities. The gap points to provider incentives rather than to clinical need.
    3. An emergency caesarean is a different event from an elective one: A preterm emergency caesarean is a rescue procedure for foetal or maternal distress, and it arrives without the preparation an elective procedure allows.
    4. Timing carries its own risk: Caesarean delivery before 39 completed weeks raises neonatal respiratory morbidity, so a rising caesarean rate and a rising preterm rate reinforce each other.

    Who is held responsible when a birth goes wrong?

    1. The dominant script has no place for a preterm birth: An initiation into motherhood that begins at the doors of a neonatal unit has no available story, so the experience goes unnarrated rather than merely unrecognised.
    2. Scrutiny falls on the mother’s conduct: Society places the burden of a healthy pregnancy almost entirely on women, and a premature birth intensifies that scrutiny into questions about whether she travelled or rested enough. The mother’s body becomes the site of investigation.
    3. The evidence points the other way: Environmental exposure and clinical practice are population level determinants, and neither is amenable to individual maternal conduct.
    4. The psychological cost has no recognised name: Conversation around postpartum depression has grown, and the emotional realities of neonatal intensive care motherhood remain largely invisible.
    5. Even the support offered polices the mother: Nurses urge mothers to stay positive because infants sense their emotions. That instruction converts grief into a further maternal responsibility.

    Challenges in maternal and newborn care in India

    1. Neonatal intensive care capacity is thin outside metros: District level special newborn care units handle stabilisation but not ventilation or surgery, so very preterm infants must be transferred to a medical college or a private hospital. Eg. Referral transport for sick newborns remains the weakest link in the newborn care chain in most States. Fix. Attach a functioning level three unit to every district hospital with a dedicated newborn transport ambulance on a fixed response standard.
    2. Neonatal intensive care is catastrophic out-of-pocket expenditure: A six-week private NICU stay runs into several lakh rupees and sits outside most insurance cover for a newborn without an existing policy. Eg. Ayushman Bharat covers the mother’s delivery package but not an extended neonatal admission in every State’s package list. Fix. Add a defined neonatal intensive care package with a per-day rate to the national health insurance benefit list, effective from the date of birth.
    3. Perinatal mental health has no service line: Public maternity facilities have no counsellor attached to the neonatal unit, so the psychological consequences of a preterm birth go unscreened and untreated. Eg. Screening for postpartum depression is not part of the standard postnatal visit schedule. Fix. Post a trained counsellor at every special newborn care unit and add a validated screening question to the routine postnatal check.
    4. Caesarean rates are unaudited in the private sector: No facility level audit compels a hospital to justify its caesarean rate, so the rate rises without a clinical explanation. Eg. Facility caesarean rates above 50 per cent are recorded in several States without triggering review. Fix. Publish facility-wise caesarean rates using the Robson classification and make registration renewal conditional on a rate review.
    5. Heat action plans do not name pregnant women: City heat plans list outdoor workers and the elderly as vulnerable groups and generally omit pregnant women, so no advisory or workplace protection reaches them. Eg. Most State heat action plans carry no antenatal advisory component. Fix. Add pregnant women as a notified vulnerable category, with heat advisories issued through antenatal care contacts and Anganwadi workers.
    6. Kangaroo mother care coverage stays low: The intervention is cheap and evidence-backed, and it requires a mother to remain beside the infant for hours. Most public units are not physically designed for that. Eg. Many newborn units have no space for a mother to stay overnight. Fix. Make mother-side accommodation a licensing condition for any unit designated to handle low birth weight newborns.

    Conclusion

    Preterm birth in India is being pushed upward by heat exposure and other environmental determinants that no individual pregnancy can be managed against, and the clinical system is simultaneously delivering more babies surgically and earlier. The response has stayed at the level of the individual mother, whose conduct is scrutinised and whose psychological care is not provided at all. Recognising heat as a maternal health exposure, auditing caesarean practice and funding neonatal intensive care are the three interventions the evidence already supports. Until they are in place, the burden of a structural change will keep being carried privately.

    “[2025] Consider the following statements:

    Statement I: At the 28th United Nations Climate Change Conference (COP28), India refrained from signing the ‘Declaration on Climate and Health’.

    Statement II: The COP 28 Declaration on Climate and Health is a binding declaration; and if signed, it becomes mandatory to decarbonize health sector.

    Statement III: If India’s health sector is decarbonized, the resilience of its healthcare system may be compromised.

    Which one of the following is correct in respect of the above statements?

    (a) Both Statement II and Statement III are correct and both of them explain Statement I

    (b) Both Statement II and Statement III are correct but only one of the them explains Statement I

    (c) Only one of the Statements II and III is correct and that explains Statement I

    (d) Neither Statement II nor Statement III is correct

  • Ethanol blending policy is behind rise in sugar prices, says Opposition

    Ethanol blending policy is behind rise in sugar prices, says Opposition

    Why in the News

    Retail sugar prices reached Rs 62.5 to Rs 64 per kg in Maharashtra and Rs 63 to Rs 64 per kg in Karnataka on 20 August. The corresponding ranges on 1 August were Rs 46.2 to Rs 46.9 and Rs 46.25 to Rs 47 per kg, with Uttar Pradesh at Rs 44.95 to Rs 46.7. Closing stocks for the 2025-26 sugar season are set to fall to a nine-year low on a production shortfall. The ethanol blending programme has been named as the cause of the spike. What is contested is whether diverting cane to fuel drove the price rise, or whether a crop failure larger than the diversion did.

    What is the Ethanol Blended Petrol Programme?

    1. A fuel substitution programme run through sugar mills: The Ethanol Blended Petrol (EBP) Programme requires oil marketing companies to blend ethanol into petrol, and it sources that ethanol partly from sugarcane. It runs under the National Policy on Biofuels, 2018.
    2. Cane can be diverted at three points: Mills may make ethanol from direct sugarcane juice or syrup, from B-heavy molasses, or from C-heavy molasses, each of which sacrifices a different quantity of sugar.
    3. The 20 per cent target was met early: The blending target of 20 per cent ethanol in petrol was achieved ahead of its 2025-26 deadline.
    4. It exists to fix mill finances as much as fuel imports: Diversion gives mills a buyer who pays on delivery, which shortens the cane payment cycle to farmers and cuts crude oil imports at the same time.

    What is sugar recovery?

    1. Recovery is the yield of the crush: Recovery rate is the sugar produced expressed as a percentage of the cane crushed, and it decides how much sugar a given tonnage of cane actually yields.
    2. It is set in the field, not the mill: Recovery depends on sucrose accumulated in the cane stalk, which needs sunlight and aeration in the ripening months, so a waterlogged crop lowers recovery even where tonnage holds up.

    What are B-heavy and C-heavy molasses?

    1. Molasses grades mark how much sugar is left behind: Molasses is the residue after sugar crystals are extracted, and B-heavy molasses is drawn off at an earlier stage than C-heavy molasses, so it retains more fermentable sugar.
    2. The grade decides the sugar sacrificed: One tonne of ethanol from C-heavy molasses costs almost no sugar, B-heavy costs more, and direct juice or syrup costs the most, which is why diversion policy is set grade by grade.

    India’s sugar balance sheet: what do the numbers show?

    Sugar Year (Oct-Sep)Opening StocksDomestic OutputDomestic ConsumptionExportsClosing Stocks
    2016-1772.5202.62244.480.4639.41
    2017-1839.41323.28253.96.32104.71
    2018-19104.71331.6225538143.33
    2019-20143.33273.8525359.4104.78
    2020-21104.78311.22607283.98
    2021-2283.98359.2526211071.23
    2022-2371.233312816457.23
    2023-2457.23319295180.23
    2024-2580.23261.8284850.03
    2025-26*50.03279280841.03

    All figures in lakh tonnes. *Industry estimates. Source: National Federation of Cooperative Sugar Factories Ltd.

    1. The season starts with just over 50 lakh tonnes: Opening stocks for 2025-26 stood at 50.03 lakh tonnes, so total sugar available after adding production works out to about 329 lakh tonnes.
    2. Consumption and exports leave 41 lakh tonnes: Deducting domestic consumption of 280 lakh tonnes and exports of 8 lakh tonnes closes the season at around 41 lakh tonnes.
    3. That is the lowest in nine years: The last time closing stocks were lower was 39.41 lakh tonnes in 2016-17.
    4. A disputed opening figure makes it worse: Some in the industry hold that opening stocks were only 48 lakh tonnes rather than 50.03 lakh tonnes, which would take closing stocks to 39 lakh tonnes, the lowest since 2008-09.
    5. The peak was three seasons of surplus: Closing stocks ran to 143.33 lakh tonnes in 2018-19 and were still 104.78 lakh tonnes in 2019-20, so the current tightness follows a period of overhang, not chronic scarcity.

    Why did production fall so far below projection?

    1. The apex body projected a large crop: The Indian Sugar and Bio-energy Manufacturers Association (ISMA), the association of private sugar mills, estimated gross production for the 2025-26 season at 343.5 lakh tonnes in early November 2025. After 34 lakh tonnes of ethanol diversion, it pegged net output at 309.5 lakh tonnes.
    2. The actual crop came in far smaller: Latest industry estimates put gross production at 309 lakh tonnes and ethanol diversion at 30 lakh tonnes, leaving net output at 279 lakh tonnes. Net output is therefore 30.5 lakh tonnes below the 309.5 lakh tonnes originally projected on a net basis.
    3. Excess rain hit the crop at the wrong time: The cane crop in Maharashtra, Karnataka and Gujarat suffered excess rainfall in September and October last year, with a delayed withdrawal of the southwest monsoon.
    4. Waterlogging cut both tonnage and recovery: Waterlogged fields combined with a lack of sunshine deprived the standing crop of aeration and daylight. That affected cane growth and sucrose accumulation in the stalks, lowering yields and mill recovery.
    5. The two tropical States missed badly: ISMA had projected Maharashtra at 130 lakh tonnes and Karnataka at 63.5 lakh tonnes, and their mills produced only 99.2 lakh tonnes and 47.2 lakh tonnes.
    6. Uttar Pradesh lost output to disease and pest: Factories in the State produced 89.7 lakh tonnes against an earlier estimate of 103.2 lakh tonnes. Red rot fungal disease and the top shoot borer insect pest were the chief causes, and the dominant Co-0238 cane variety has grown increasingly susceptible to both.

    What turned a shortfall into a price spike?

    1. Prices were flat for most of the season: Average ex-factory prices in Maharashtra fell from Rs 38.31 to Rs 36.98 per kg between September 2025 and April 2026, then recovered to Rs 38.23 by June. They rose from July, averaging Rs 41.85 per kg that month.
    2. Declared mill stocks were doubted: Some liquidity-strapped mills had already sold sugar beyond their government-fixed monthly release quotas and had little left. The stocks they declared existed on paper.
    3. A second bad monsoon was priced in early: High rainfall deficiency in June, particularly in Maharashtra and Karnataka, convinced the trade that yields and production would take a hit in the 2026-27 season as well.
    4. Buyers and sellers both moved first: Larger merchants, stockists and bulk industrial consumers began taking positions before July. From August some mills started holding back sales in anticipation of higher prices ahead of the festival season.

    Where does India’s ethanol actually come from?

    1. Sugarcane supplies under a third: Of 810.67 crore litres of ethanol supplied to oil marketing companies for blending between November 2025 and July 2026, only 259.24 crore litres or 32 per cent came from sugarcane-based feedstock.
    2. Direct juice and syrup is the largest cane route: Direct juice or syrup contributed 147.6 crore litres, B-heavy molasses 98.19 crore litres and C-heavy molasses 13.45 crore litres.
    3. Grain supplies the balance: Distilleries using grain-based feedstock supplied 551.43 crore litres or 68 per cent of the total.
    4. Maize leads the grain feedstock: Maize accounted for 288 crore litres, Food Corporation of India rice 207.1 crore litres and broken or damaged foodgrains 56.33 crore litres.

    Is ethanol diversion the cause of the spike or a scapegoat for a crop failure?

    1. The diversion looks large in isolation: Thirty lakh tonnes of sugar went into ethanol in the current season, which is more than two-thirds of the season’s projected closing stock.
    2. The crop failure was larger than the diversion: Gross production before any diversion came in 34.5 lakh tonnes below the initial gross estimate of 343.5 lakh tonnes, so the sugar lost to the weather exceeded the sugar lost to fuel.
    3. Two-thirds of blended ethanol never touched cane: The blending target is being met mainly out of maize and rice, so cutting cane diversion to zero would remove only a third of the programme’s feedstock demand and not a third of the price.
    4. Reversing diversion moves the problem, it does not remove it: Ethanol sales are the payment stream that lets mills clear cane dues on time, so a ban on juice and B-heavy diversion converts a consumer price problem into a farmer arrears problem.

    What has the government done to check sugar prices?

    1. Exports banned on 13 May: All sugar exports were banned until 30 September 2026. It was a precautionary move rather than a response to a confirmed shortage.
    2. Duty-free imports opened this week: Import of up to 10 lakh tonnes of raw sugar at zero duty was allowed until 31 October, against the standard tariff of 100 per cent on the sweetener.
    3. Refiners at Kandla will process the raws: The raw sugar can be processed by companies operating refineries at Gujarat’s Kandla port, such as Shree Renuka Sugars and Shri Dutta India Private Ltd. The refined output can supply the market until Indian mills begin cane crushing from end-October to early November.
    4. Stock limits imposed on 28 July: A stocking limit of 400 tonnes was imposed on all sugar dealers, and no dealer may hold any sugar beyond 30 days of receiving it.
    5. Bulk buyers put under disclosure on 13 August: Mills were directed by letter to furnish details of bulk consumers such as soft drink and confectionery makers and sweetmeat sellers who bought 500 tonnes or more annually, directly or through agents, during the 2025-26 financial year.
    6. A diversion curb is expected next: The government is expected to direct mills not to manufacture ethanol from direct sugarcane juice and B-heavy molasses in the 2026-27 season, on the stated priority of augmenting domestic sugar supply.

    Challenges to the Ethanol Blended Petrol Programme

    1. Grain has crowded out cane as feedstock: Grain-based distilleries now supply more than twice the volume the cane routes do, which shifts the food security question from sugar to cereals. Eg. Food Corporation of India rice was released to distilleries in the current supply year. Fix. Cap grain feedstock at a notified share of annual blending and reserve open market cereal releases for the public distribution system.
    2. Procurement prices have not tracked cane costs: Ethanol procurement prices have stayed largely stagnant as the Fair and Remunerative Price for cane has risen, squeezing distillery margins. Eg. Cane FRP rose from Rs 285 per quintal in 2020-21 to Rs 355 per quintal in 2025-26. Fix. Index the ethanol procurement price for each feedstock route to the notified cane price through a published formula.
    3. Distillation capacity sits underused: Mills built distilleries on the expectation of assured diversion, and capacity idles whenever policy switches back to sugar. Eg. Many mills face underutilised distillation capacity in the current season. Fix. Publish a three-year rolling diversion band so investment decisions are made against a stated range rather than an annual notification.
    4. Higher blends carry a vehicle cost: Ethanol has a lower energy density than petrol, so fuel efficiency falls by roughly 2 to 6 per cent at higher blend levels and older engines face material compatibility issues. Eg. Vehicles manufactured before E20 compliance norms were not certified for the current blend. Fix. Mandate a labelled dual fuel dispensing option at retail outlets so owners of non-compliant vehicles retain a lower blend choice.
    5. Cane ethanol carries a heavy water footprint: Sugarcane is grown largely in water-stressed tropical districts, so cane-based ethanol transfers an irrigation burden to the fuel sector. Eg. Maharashtra and Karnataka face groundwater depletion in the same belts that supply mill cane. Fix. Restrict juice and B-heavy diversion licences to mills that have converted a notified share of their command area to drip irrigation.

    Conclusion

    The sugar price spike is the result of a crop that came in 34.5 lakh tonnes below projection in gross terms, stocks doubted by the trade and positions taken ahead of the festival season, not of ethanol diversion that supplied under a third of blended fuel. The government has answered on the supply side, with an export ban, duty-free raw imports, dealer stock limits and bulk-buyer disclosure. A curb on cane-based ethanol in 2026-27 would trade a consumer price problem for a cane arrears problem. The season will close on the tightest stock position in nine years, and next season’s crop is already being discounted for a deficient June.

    “[2025] Consider the following statements:

    Statement I: Of the two major ethanol producers in the world, i.e., Brazil and the United States of America, the former produces more ethanol than the latter.

    Statement II: Unlike in the United States of America, where corn is the principal feedstock for ethanol production, sugarcane is the principal feedstock for ethanol production in Brazil.

    Which one of the following is correct in respect of the above statements?

    (a) Both Statement I and Statement II are correct and Statement II explains Statement I

    (b) Both Statement I and Statement II are correct but Statement II does not explain Statement I

    (c) Statement I is correct but Statement II is not correct

    (d) Statement I is not correct but Statement II is correct

  • NGT seeks Centre’s response on change in floodplain rules

    NGT seeks Centre’s response on change in floodplain rules

    Why in the News

    The National Green Tribunal (NGT) has issued notice to the Centre on a petition challenging an amendment to the rules governing the Ganga’s floodplains. The Jal Shakti Ministry issued the amendment earlier this month. It removed the “construction-free zone” tag on the Ganga’s floodplains. It also redefined what counts as a floodplain, replacing a single protected belt with three graded bands. The contest is over whether narrowing the protected area corrects a legal defect in the original rules or opens land that a hundred years of flood records show the river still claims.

    What is the River Ganga (Rejuvenation, Protection and Management) Authorities Order, 2016?

    1. A governance structure, not a pollution standard: The Order was notified under the Environment (Protection) Act, 1986 to create a single chain of command for the Ganga. It replaced a scatter of separate authorities with one tiered structure.
    2. Five tiers from the Centre to the district: It set up the National Ganga Council, an Empowered Task Force, the National Mission for Clean Ganga (NMCG), State Ganga Committees and District Ganga Committees. The Council is chaired by the Prime Minister and the Task Force by the Union Jal Shakti Minister.
    3. NMCG holds the enforcement powers: The Order gave NMCG the standing of an authority able to issue binding directions to any person or body on the Ganga and its tributaries. Its directions carry the force of directions under the 1986 Act.
    4. It closed the floodplain to construction: The Order tagged the Ganga’s floodplains a construction-free zone. It fixed the extent of that floodplain largely by the once-in-100-year flood line.

    What is a floodplain and how is one delineated?

    1. A floodplain is the river’s own land: It is the flat ground beside a river channel that the river inundates when discharge exceeds the channel’s capacity, and it absorbs flood volume and recharges groundwater.
    2. Delineation uses a flood return period: A one-in-100-year flood is a discharge with a one per cent chance of being equalled or exceeded in any single year, and the line it reaches marks the outer edge of the mapped floodplain.

    What exactly does the amendment change?

    1. The active floodplain shrinks to a five-year line: The “active floodplain” is now the area inundated by a flood with a one-in-five-year return period. The 2016 line ran to the once-in-100-year flood.
    2. A regulatory zone replaces the ban on the middle belt: Land flooded once in five to 25 years falls into a “regulatory zone” where activity is permitted subject to conditions rather than prohibited.
    3. A warning zone covers the outer belt: Land flooded once in 25 to 100 years falls into a “warning zone”, the weakest of the three categories.
    4. NMCG notified the change: The amendment was notified by the Ministry’s National Mission for Clean Ganga and was reported on 11 August. The construction-free zone tag was dropped in the same instrument.

    Why does the petitioner say the change is unlawful?

    1. An environmentalist filed the challenge: The petition was filed by environmentalist Amit Kumar, who is not a State or a statutory body.
    2. The no-construction zone was altered without a fresh basis: The petition argues that the amendment alters the no-construction zone set out in the 2016 order. It says the “active floodplain” has been wrongly pegged to a one-in-five-year flood.
    3. The change contradicts settled orders: The petition contends that the amendment runs counter to earlier rulings of the Tribunal and of the High Courts. Those rulings had treated the floodplain as protected land.
    4. The route was an executive notification: The 2016 Order was made under the Environment (Protection) Act, 1986 and has been amended by executive notification, without any legislative examination of the narrowed definition.

    Is a graded floodplain regime a legal correction or a dilution of protection?

    1. The government calls it a technical repair: A government official explained the change as “correcting a legal inconsistency” in the original order. A blanket construction-free tag over a 100-year flood line was internally inconsistent with the graded controls used elsewhere in river regulation.
    2. Graded zoning is the standard engineering practice: Flood plain zoning worldwide separates a prohibited core from regulated and warning belts, because a single prohibition over the full 100-year belt is unenforceable in a densely settled basin.
    3. The graded regime converts prohibition into permission: Most of the land between the five-year and the 100-year line moves from a ban to a conditional clearance. Discretion at the clearance stage replaces a rule that needed no discretion.
    4. Flood risk does not follow the average: A five-year line describes the routine flood, not the damaging one, and structures built between the five-year and 100-year line are exposed precisely in the years that matter.

    What does the Tribunal’s refusal to stay the amendment mean on the ground?

    1. The amendment remains in force during the challenge: The Tribunal did not stay the amendment, so the narrowed definition governs every clearance decision taken until the case is decided.
    2. The hearing produced notice, not relief: A Bench of the Chairperson and an Expert Member heard the matter on 19 August. It directed the Union government and other respondents to file their replies.
    3. The next date is two months away: The case has been listed for 27 October. Construction permitted in the interval will be complete or under way by then.
    4. Approvals granted meanwhile are hard to unwind: A structure raised on the strength of a valid clearance acquires equities that a later order rarely disturbs. Demolition after the fact is the remedy the Tribunal has historically been most reluctant to grant.

    Challenges to floodplain regulation in India

    1. India has no floodplain zoning law: A Model Flood Plain Zoning Bill was circulated to the States in 1975 and only a handful enacted it, so the country regulates floodplains through orders and court directions rather than statute. Eg. Manipur, Rajasthan and Uttarakhand enacted versions of the model bill. The large basin States did not. Fix. Enact a central framework law under Entry 56 of the Union List for inter-State rivers, leaving intra-State reaches to State legislation.
    2. Land is a State subject and floodplains are valuable: State governments resist zoning because the floodplain is often the last unbuilt land inside a growing city. Eg. Delhi’s Yamuna floodplain hosts a bus depot, a metro depot and event grounds built after clearances that were later questioned. Fix. Compensate States for foregone land value through a dedicated flood risk reduction transfer, so protection stops being a pure fiscal loss.
    3. Flood hazard maps are outdated or missing: Zoning cannot be enforced without a current, surveyed inundation line, and most basins are mapped on decades-old records. Eg. The Central Water Commission’s flood atlas work covers only part of the flood-prone area of 40 million hectares. Fix. Mandate a satellite-based inundation remapping cycle every five years, with the maps published as the legal basis for zoning.
    4. Definitions conflict across agencies: Revenue records, irrigation departments and pollution boards each use a different boundary for the same riverbank, so an approval from one is defended against an objection from another. Eg. Riverbed land recorded as revenue land in State records is routinely leased for farming and then built upon. Fix. Fix one notified inundation line per reach as binding on every department, with revenue entries corrected to match it.
    5. Enforcement rests on understaffed boards: State pollution control boards carry the monitoring duty without field staff to patrol hundreds of kilometres of riverbank. Eg. The Tribunal has repeatedly pulled up State boards for filing identical status reports without site inspection. Fix. Transfer routine floodplain patrolling to district administrations with a published monthly encroachment return.
    6. Rules change faster than the river: A protected belt created by executive order can be narrowed by another executive order, so investment and enforcement both discount the rule’s durability. Eg. The construction-free zone survived nine years before this amendment removed it. Fix. Require that any dilution of a notified ecological limit be preceded by a published scientific justification and a public objection window.

    Conclusion

    The Ganga’s floodplain has been redefined from a single protected belt fixed at the 100-year flood line to three graded bands whose innermost core is set at a five-year flood. The amendment stands notified and unstayed, so it governs clearances now. The Union government and other respondents must file replies before the National Green Tribunal. The Tribunal has listed the matter for 27 October. Whether the change is a legal repair or a dilution will be settled at that hearing, and until then the narrowed line is the operative law.

    “[2016] Which of the following are the key features of ‘National Ganga River Basin Authority (NGRBA)’?

    1. River basin is the unit of planning and management.

    2. It spearheads the river conservation efforts at the national level.

    3. One of the Chief Ministers of the States through which the Ganga flows becomes the Chairman of NGRBA on rotation basis.

    Select the correct answer using the code given below.

    (a) 1 and 2 only

    (b) 2 and 3 only

    (c) 1 and 3 only

    (d) 1, 2 and 3

  • Remembering Niketu Iralu: Peace activist, bridge between Nagas, mainland India

    Remembering Niketu Iralu: Peace activist, bridge between Nagas, mainland India

    Why in the News

    Niketu Iralu, a Naga peace activist, died in a Delhi hospital on 18 August 2026 at the age of 91. He spent six decades on reconciliation between Naga factions and between the Naga people and the rest of India, outside every formal negotiating channel. His maternal uncle, Angami Zapu Phizo, led the Naga National Council (NNC), which declared Naga independence on 14 August 1947. The Centre constituted a new ministerial panel last week to carry forward the stalled talks on a final Naga settlement. The conflict has found no solution in the nearly eight decades since that declaration. One position holds that a final text can now be signed. The competing position is that the reconciliation work behind six decades of talks has no institutional successor.

    What is the Naga peace process?

    1. A ceasefire came before any accord: A peace camp at Chedema, on a hilltop near Kohima, negotiated a ceasefire in 1964 between the rebel Naga Federal Government and the Government of India. It was the first suspension of hostilities after more than a decade of armed insurgency.
    2. The Shillong Accord split the movement: NNC representatives signed the Shillong Accord in 1975, accepting the Constitution of India. A faction rejected it and formed the National Socialist Council of Nagaland (NSCN) in 1980.
    3. The current track opened with the 1997 ceasefire: The Centre signed a ceasefire with the NSCN (Isak-Muivah) faction in 1997. Talks under it have run for close to three decades without a final agreement.
    4. The Framework Agreement fixed the terms in 2015: The Centre and the NSCN (Isak-Muivah) signed a Framework Agreement on 3 August 2015 recognising the “unique history” of the Nagas. Its contents have never been published.

    Why did a family at the centre of the sovereignty claim produce its leading peace advocate?

    1. The lineage ran through the sovereignty movement: His father, Sevilie Iralu, was among the first Naga doctors. His maternal uncle led the council that made the 1947 declaration.
    2. He chose a different method: He committed himself to non-violence, dialogue and reconciliation rather than armed struggle. He became known across the Northeast as a peace activist rather than a political negotiator.
    3. Initiatives of Change shaped that method: He worked in Initiatives of Change, an organisation that pursues social transformation through “personal change”. Its premise is that a political conflict is resolved by first changing the people inside it.
    4. Mainland India was a discovery, not an inheritance: He left for Madras Christian College in the 1950s, his first encounter with mainland India. He described the crowds boarding trains at Kolkata as a scale of population that felt unsurvivable.
    5. His house was named for the method: His home at Sechu Zubza in Kohima district was called Kerunyu Ki, “The House of Listening”. People travelled to it for counsel rather than to a party office or a negotiating table.
    6. Recognition came as a bridge builder: He received the Bhupen Hazarika Integration Award among other honours. Hundreds gathered at Dimapur airport when his body arrived from Delhi.

    How does the Second World War figure in Naga political memory?

    1. The war reached Naga villages: The Japanese Army invaded Nagaland in 1944 during the Second World War. His village, Khonoma, was overrun and families fled into the forest.
    2. The battle of Kohima was the turning point: The Japanese retreated after the battle of Kohima. An advance past it would have taken them to the Brahmaputra valley and into mainland India.
    3. The cemetery fixed the memory: The Kohima War Cemetery carries the epitaph, “When you go home, tell them of us and say, for their tomorrow, we gave our today.”
    4. The war left a habit of seeing the enemy as human: His sister slapped a Japanese soldier helping himself to a Naga shawl, and the soldier bowed and left. He read that restraint as evidence that the soldier also had a sister at home.

    What did the 1990 repatriation of Phizo’s body show about informal mediation?

    1. The leader died in exile: Angami Zapu Phizo died in London in April 1990. He had been in exile since 1960, when he left for the United Kingdom to mobilise world opinion for the Naga cause.
    2. The request came from the insurgent side: NNC leaders asked him to help bring the body back to India. No working channel existed between the NNC and the Government of India at that point.
    3. The government feared a funeral would trigger violence: The Janata Dal led government judged that returning the body might set off violence in Nagaland. A Janata Dal member of the Rajya Sabha, who had worked with him in Initiatives of Change for three decades, argued that denying the Nagas the right to grieve was the greater risk.
    4. The ask was procedural, not financial: He told the then Finance Minister at a 5 a.m. meeting that the Nagas had collected the money themselves. He asked only for foreign exchange clearance.
    5. The state supplied the logistics: The remains were received at the technical area of Palam airport. A Home Ministry aircraft then carried the casket to Kohima for the funeral.

    Does reconciliation require a community to confront its own failures?

    1. The demand was turned inward, not outward: A tribute in Ukhrul Times described him as a man who spent decades asking Nagas to confront their failures, resist hatred and recover the courage to listen. The demand was addressed to Naga society, not to the Indian state.
    2. Moral courage was defined as internal criticism: He held that moral courage involves “telling one’s own side what it does not want to hear”. He did not treat reconciliation as a concession or as weakness.
    3. Factional politics penalises exactly that: Naga groups have fought each other as often as they have fought the state, and internal criticism reads as disloyalty inside a faction. Eg. The NSCN split of 1988 into the Isak-Muivah and Khaplang factions produced years of inter-factional killing.
    4. The obstacle is not an administrative clause: The unresolved items are a separate Naga flag and a separate Naga constitution, which are claims about identity rather than about administration. A negotiator can concede an administrative arrangement, and only the community can revise a claim about who it is.

    Challenges to the Naga peace settlement

    1. The flag and constitution demand is unresolved: The NSCN (Isak-Muivah) insists on a separate Naga flag and a separate constitution, the Yehzabo, rejected by the Centre as incompatible with Indian sovereignty. Eg. The talks declared concluded in October 2019 ended without agreement on either demand. Fix. Settle the symbolic claim as a cultural flag protected under Article 371A’s guarantee for Naga customary practice, separated from any constitutional status.
    2. The territorial claim crosses three other States: The “Greater Nagalim” demand would merge Naga inhabited areas of Manipur, Assam and Arunachal Pradesh into one unit. Eg. The Manipur Assembly has repeatedly resolved against any settlement altering the State’s boundaries. Fix. Use non-territorial autonomy, giving Naga councils outside Nagaland cultural and development powers without redrawing State boundaries.
    3. The negotiation has two competing counterparties: The Centre talks in parallel to the NSCN (Isak-Muivah) and to the Naga National Political Groups, and each rejects a settlement signed only with the other. Eg. The Working Committee of the Naga National Political Groups signed a separate Agreed Position in 2017. Fix. Convene one joint negotiating forum so a single signed text binds every group.
    4. Ceasefire ground rules are routinely breached: Cadres under ceasefire run parallel taxation in Nagaland and in Naga areas of Manipur, which keeps an armed economy alive through the negotiation. Eg. Traders and salaried employees in Dimapur pay levies to more than one faction. Fix. Publish the ceasefire monitoring group’s findings with a fixed penalty schedule for each verified breach.
    5. A text kept secret cannot be ratified: The 2015 Framework Agreement has never been published, so no legislature or public body has examined what was agreed. Eg. Nagaland’s own legislators have sought disclosure of the text on the floor of the Assembly. Fix. Table the agreed text in Parliament and in the Nagaland Assembly before signature, so ratification precedes implementation.
    6. Security law feeds the grievance the talks address: The Armed Forces (Special Powers) Act, 1958 remains in force across parts of Nagaland, sustaining the alienation a settlement is meant to end. Eg. The Oting killings of December 2021 in Mon district led the Assembly to demand repeal. Fix. Complete the district by district withdrawal already begun and move residual powers to a civil authority subject to judicial review.

    Conclusion

    The Naga settlement is stalled on claims about identity, not on administrative detail, and identity claims are revised by a community rather than conceded by a negotiator. The reconciliation work that kept six decades of talks survivable was carried by individuals with no official standing, and it has no institutional successor. A ministerial panel can reopen the file. It cannot by itself rebuild the trust that would let a signed text hold.

    “[2025, GS3, 15 marks] What are the major challenges to internal security and peace process in the North-Eastern States? Map the various peace accords and agreements initiated by the government in the past decade.”

  • Ensuring equity amid India’s educational progress

    Ensuring equity amid India’s educational progress

    Why in the News

    The Unified District Information System for Education Plus (UDISE+) 2025-26 report records notable progress across India’s school education system. Progress is recorded in gross enrolment, student retention, dropout reduction, teacher availability and educational infrastructure. The same report records that regional and social disparities persist in access, resources, learning opportunities and educational outcomes. Differences in gross enrolment ratios, dropout rates, pupil teacher ratios and infrastructure availability now separate States and social groups from one another rather than separating India from an earlier baseline. What is contested is whether an improving national average can be read as equitable, inclusive and quality education.

    What is the Unified District Information System for Education Plus (UDISE+)?

    1. A school level administrative database: UDISE+ is the annual data system that collects information from every recognised school in the country, managed by the Department of School Education and Literacy under the Ministry of Education.
    2. Scale of the 2025-26 round: The report covers 1.47 million schools, 240 million students and 10.2 million teachers.
    3. What it measures: It records enrolment, retention, teacher deployment and school infrastructure, reported down to the district and school level.
    4. Why the numbers matter: The database is the official basis on which school education allocations are made and progress is monitored.

    What is the Gross Enrolment Ratio (GER)?

    1. Enrolment measured against an age group: GER is total enrolment at a school stage expressed as a percentage of the population in the official age group for that stage.
    2. Why a value above 100 is possible: Enrolment of under age and over age children pushes the ratio past 100 without meaning that every eligible child of that age is in school.

    What is the Pupil Teacher Ratio (PTR)?

    1. Students carried by each teacher: PTR is the number of enrolled students per teacher at a given school stage, so a higher value means each teacher carries a larger class load.

    What is the Gender Parity Index?

    1. Girls’ enrolment measured against boys’: The index is the ratio of female to male enrolment at a school stage, and a value above one shows more girls enrolled than boys.

    What is Aadhaar seeding of student records?

    1. Linking an enrolment record to a unique identity number: Seeding attaches a student’s Aadhaar number to the school record, which is how duplicate and inactive enrolments are removed from the count.

    Which States lead and lag on enrolment records and school profile?

    1. Aadhaar seeding of enrolled students: Andhra Pradesh leads at 99.6 percent, followed by Chandigarh at 99 percent. Meghalaya records the lowest rate at 35 percent against a national average of 90.2 percent.
    2. Share of schools and enrolment: Uttar Pradesh accounts for the highest share of both schools and student enrolment. Meghalaya and Himachal Pradesh have the lowest shares of schools relative to enrolment, which produces higher student school ratios.
    3. Composition of schools by stage: West Bengal records the highest proportion of foundational and preparatory schools at 79 percent and among the lowest secondary schools at 11 percent. Chandigarh is the reverse, with 83 percent secondary schools and 5 percent foundational and preparatory schools.
    4. Average enrolment per school: Chandigarh registers the highest at 1,194, followed by Delhi at 788. Ladakh records the lowest at 64, which marks the spread in school size across the country.

    How is enrolment distributed across social groups?

    1. Regional concentration of social groups: Chandigarh and Delhi have the highest proportions of General category students. Lakshadweep, Mizoram, Meghalaya and Ladakh have high proportions of Scheduled Tribe enrolment.
    2. Concentration of Scheduled Caste and Other Backward Classes enrolment: Punjab records one of the highest shares of Scheduled Caste enrolment. Other Backward Classes representation is particularly high in Tamil Nadu and Gujarat.
    3. Gross enrolment by social group at the national level: Other Backward Classes record the highest at 49 percent, followed by General at 27 percent, Scheduled Castes at 17 percent and Scheduled Tribes at 10 percent.
    4. Enrolment set against population: Those figures diverge from the corresponding population of each social group, which is where the enrolment gap between groups becomes visible.
    5. Girls ahead of boys on participation: The Gender Parity Index across all school levels shows higher girls’ enrolment and participation than boys in most States and Union Territories.
    6. Minority enrolment: Students from minority communities account for more than 20 percent of enrolment, with Muslims and Parsis among the major minority groups.

    How far apart are States on teacher availability?

    1. The spread tracks population density: PTR registers lowest in Union Territories and highest in densely populated States.
    2. The secondary stage carries the heaviest load: Foundational, preparatory and middle stage ratios are generally lower than the secondary ratio across most States.
    3. The highest secondary ratios: Jharkhand records the highest secondary PTR at 43, followed by Uttar Pradesh, which signifies a heavy workload on each teacher.
    4. The lowest secondary ratios: Sikkim records the lowest secondary PTR at 6, followed by Ladakh.

    What do the stage wise gross enrolment figures show?

    1. Foundational stage: Meghalaya records the highest at 131, followed by Mizoram. Bihar records the lowest at 24, preceded by Uttar Pradesh.
    2. Preparatory stage: Meghalaya again records the highest at 171, followed by Manipur. Gujarat records the lowest at 74, preceded by Bihar.
    3. Middle stage: Chandigarh and Meghalaya record the highest at 118, followed by Delhi. Bihar records the lowest at 70, preceded by Nagaland.
    4. Secondary stage: Chandigarh registers the highest at 109, followed by Goa. Bihar records the lowest at 48, preceded by Nagaland.
    5. The pattern across stages: One large State sits at or near the bottom at every stage, which concentrates the enrolment deficit rather than spreading it evenly across the country.

    What does the dropout data show about retention at each stage?

    1. Why the indicator matters: The dropout rate determines attainment and the transition rate to the next stage of schooling.
    2. Preparatory stage: Bihar accounts for the highest preparatory dropout rate at 7.9 percent, followed by Meghalaya. Delhi, Haryana and Maharashtra do not report dropout at this stage.
    3. Middle stage: Bihar records the highest middle level dropout rate at 9 percent, followed by Uttar Pradesh. Chandigarh, Maharashtra and Andhra Pradesh register no dropouts at this stage.
    4. Secondary stage: Ladakh records the highest secondary dropout rate at 14.8 percent, followed by Karnataka. West Bengal records the lowest at 1.5 percent, preceded by Telangana.

    Why has improved access not produced regular attendance?

    1. A school within reach is now the norm: Access to schooling has improved significantly over the years, and most children now have a school at a suitable distance.
    2. Terrain still decides regularity: Remote, hilly, tribal and border areas still have limited schools and transport facilities, so children there face greater difficulty attending regularly. Eg. Bageshwar district of Uttarakhand, Ganjam and Kandhamal districts of Odisha, Kathua district of Jammu and Kashmir, and Palghar district of Maharashtra.
    3. Social position compounds distance: Children from Scheduled Castes, Scheduled Tribes, minorities and economically poor families face barriers that limit enrolment, attendance and completion together.

    What limits infrastructure and teacher deployment in backward districts?

    1. Infrastructure has improved unevenly: School infrastructure has improved in several areas of the country on drinking water and electricity, and availability still varies across regions.
    2. Rural schools in backward districts lag: Educationally backward districts continue to struggle to provide a learning environment in rural schools compared with urban areas.
    3. One teacher, many roles: Rural and remote schools face teachers handling multiple classes and subjects alongside non teaching responsibilities allotted by the government.

    Which groups remain outside the gains?

    1. Girls’ schooling has advanced without closing retention: Progress in girls’ schooling has not removed the challenge of reducing dropout rates.
    2. The primary to secondary transition is weak: Improving the transition from primary to secondary education remains a stated gap.
    3. Facilities for disabled children fall short: Sufficient and suitable facilities for children with disabilities are not yet in place.
    4. What inclusion requires: Inclusive infrastructure, accessible classrooms and supportive teaching practices are the stated conditions for equitable education.

    Does progress in national averages amount to educational equity?

    1. Improvement and inequality sit in the same dataset: Educational inequality persists across accessibility, infrastructure, teacher availability, digital resources and social inclusion even as the aggregate indicators improve.
    2. The dimensions move together: Addressing these dimensions collectively is treated as essential, since a gain on one indicator does not carry across to the others.
    3. The paradox of progress: Regional and social imbalances continue to influence educational opportunities and learning conditions, so the national average understates what a child in a lagging district faces.

    What would a targeted equity response have to do differently?

    1. Investment directed at deprived regions: Targeted investment in educationally deprived regions is the first measure set out, in line with the National Education Policy 2020.
    2. Teacher deployment as an equity instrument: Deployment is set out as a requirement distinct from recruitment. Eg. The State spread in secondary stage ratios.
    3. Digital infrastructure as a school input: Improved digital infrastructure is named alongside physical infrastructure rather than as an add on.
    4. Dedicated support for disadvantaged groups: Stronger support for disadvantaged social groups, backed by inclusive social and economic policies, is required in addition to general spending.

    Conclusion

    India’s school education system has largely settled the access question and opened the equity question in its place. The 2025-26 data establishes progress at the national level and leaves the distribution unsettled, since the State a child studies in still predicts enrolment, teacher availability and completion. Progress will read as equity only when the distance between the best and the worst performing States narrows on the same indicators that have improved nationally.

    “[2022, GS2, 15 marks] The Right of Children to Free and Compulsory Education Act, 2009 remains inadequate in promoting incentive-based system for children’s education without generating awareness about the importance of schooling. Analyse.”