Mains Ready By December. Smash Mains & Smash PYQ Admissions Open

GS Paper: GS1-11.Salient Features of World Physical Geography

  • Needed: A Super El Nino Abhiyan

    Why in the News

    Global forecasters give a 97% probability that the 2026 El Niño will continue into spring 2027. India lacks systematic data on how such events hit its ecosystems and livelihoods, so a Super El Niño Abhiyan joining scientific evidence, administrative readiness and societal empathy is proposed.

    What is a Super El Niño, and why does it matter for India?

    1. What El Niño is: El Niño is an unusual warming of the Pacific Ocean. Because warm water drives moisture laden winds, a hot Pacific disrupts the winds that pull monsoon rains toward India.
    2. Rare confidence: For the first time, the World Meteorological Organization (WMO), the US National Oceanic and Atmospheric Administration (NOAA) and other institutions are highly confident in an El Niño forecast.
    3. Strong event likely: NOAA puts 80% plus odds on a strong to very strong event, with sea surface temperatures over 2°C above normal, a rarely crossed threshold.
    4. Global stakes: The UN warns this “supersized” El Niño could deal massive economic blows. Coral core records suggest the worst event in a millennium.
    5. The takeaway: Strong El Niño years have coincided with India’s worst droughts, so a forecast this confident is a warning for farms, water and coasts.

    Why is India already vulnerable?

    1. Disasters as routine: With global warming intensifying extreme weather, 86% of days in 2023 saw an extreme weather event in India.
    2. Wide exposure: About 85% of districts are exposed to floods, droughts or cyclones.
    3. Weak monsoon: The southwest monsoon ended well below its long period average, the benchmark for normal rain. Some regions got half their normal September rain, hurting rice, pulses, cotton and maize.
    4. Worse ahead: Reservoirs are low heading into the rabi (winter crop) season, and the main impact is expected only from November.

    What could it do to ecosystems and coasts?

    1. Unknown inland effects: No one knows how it will affect grasslands, forests, rivers, phenology (the timing of plant growth and fruiting), farmers or pastoralists.
    2. Coral bleaching: Pacific temperatures are already 2.6°C above the 0.5°C El Niño threshold, so many reefs are expected to bleach and die.
    3. Fragile recovery: Nature Conservation Foundation researchers recorded a 50% decline in Lakshadweep’s reefs even without a Super El Niño. Some had only begun recovering.
    4. Marine heat stress: The Indian National Centre for Ocean Information Services (INCOIS) predicts severe heat stress in the Arabian Sea and Bay of Bengal peaking around March 2027, cutting catches of sardine and mackerel.

    Why must evidence be gathered before the shock, not after?

    1. Missing data: India has no systematic data on how El Niño events affect ecosystems and dependent communities.
    2. Lost coral record: The 1998 El Niño destroyed 80 to 90% of live coral on most Lakshadweep reefs studied. It is known only because researchers like Rohan Arthur were measuring.
    3. Call to ecologists: On September 16, 188 conservationists and researchers urged real time data collection and a joint effort across sectors instead of reacting after the fact.
    4. On site measurement: Monitoring should cover coral bleaching, rainforest tree deaths, fire risk, urban heat islands (cities trapping heat) and animal behaviour on the ground, not only by satellite remote sensing.
    5. Who pays: The government should facilitate access and funding, and philanthropic capital should treat the research as a moral imperative.

    Challenges

    1. Local forecast gap: Global El Niño odds do not translate into district rainfall forecasts farmers can act on.
    2. Fragmented agencies: Weather, ocean and ecology data sit with separate bodies that rarely share them.
    3. Access barriers: Research in protected sites needs permits. Eg. Entry to Lakshadweep requires a permit.

    Way Forward

    1. Shared data platform: The Ministry of Earth Sciences should pool India Meteorological Department (IMD), INCOIS and field ecology data on one open portal.
    2. Fast track permits: Forest and island administrations should clear research access within days.
    3. Lean season support: State fisheries departments should prepare income support if catches fall.

    Conclusion

    A strong El Niño on top of a weak monsoon makes the coming months a test of preparedness, not only of forecasting. What to watch is whether agencies start ground level monitoring of reefs, forests and livelihoods before heat stress peaks, so this event leaves evidence rather than anecdote.

    Key numbers

    1. Strong El Niño drought years in India: 1972, 2002 and 2009.
    2. Cropland damaged by extreme weather (2023): more than 2.2 million hectares.
    3. Projected Pacific anomaly: up to 4°C above the El Niño threshold.
    4. Lakshadweep reef decline period: 1998 to 2025.

    Matching Previous Year Question

    “[2017] With reference to ‘Indian Ocean Dipole (IOD)’ sometimes mentioned in the news while forecasting Indian monsoon, which of the following statements is/are correct? 1. IOD phenomenon is characterized by a difference in sea surface temperature between tropical Western Indian Ocean and tropical Eastern Pacific Ocean. 2. An IOD phenomenon can influence an El Nino’s impact on the monsoon. Select the correct answer using the code given below: (a) 1 only (b) 2 only (c) Both 1 and 2 (d) Neither 1 nor 2 Answer: B”

  • Season’s end

    Why in the News

    The India Meteorological Department (IMD) forecast a “below normal” monsoon, but the season ended “deficient” at 87% of normal, the outcome its own models had pointed to. Large regional misses and State drought declarations now question whether the IMD is too conservative in warning of shortfalls.

    How does the IMD forecast the monsoon, and what did it predict?

    1. What a seasonal forecast is: Two IMD forecasts, in April and May, estimate the season’s rain as a share of the Long Period Average (LPA), the long term mean used as “normal”. It is like a weather report for four months.
    2. Forecast categories: “Below normal” means 90% to 95% of average rain. Anything lower is “deficient”.
    3. El Niño: In an El Niño year the Central Equatorial Pacific warms, which suppresses monsoon rain. Global models agreed that one of the strongest El Niño events was coming.
    4. A cautious call: The IMD’s models pointed to “deficient” rain, yet it chose to forecast “below normal”.
    5. The takeaway: By picking the milder category, the IMD gave less warning of a shortfall its own science saw coming.

    How far did the season miss the forecast?

    1. National total: The monsoon ended at 759 mm against a normal of 869 mm.
    2. Technical victory: IMD forecasts allow an error window of 4% to 5%. The final figure sits inside it, so the IMD can claim only a technical success.
    3. June shortfall: June got 65% of its normal rain against a forecast of 92%.
    4. Northeast: The northeast, expected to be “normal”, had its driest season since 1901, falling 26% short.
    5. South and the rest: The south peninsula ran 23% short. Central and north west India finished close to predictions, helped by ocean conditions.

    Why are regional forecasts getting harder?

    1. Climate change: Warming makes rain patterns less regular and harder to forecast.
    2. Western disturbances: These extra-tropical rain bearing systems, which reach India from the west, are bringing more rain in the monsoon months, helping the north west.
    3. Southern volatility: Southern India is more vulnerable to El Niño triggered volatility in rainfall.
    4. Kharif sowing: Sowing of kharif (monsoon season) crops trailed last year’s by 16% in early July. By early September the gap had narrowed to under 2%.

    Why does a cautious forecast matter for drought response?

    1. Karnataka: The State has declared drought in over 100 taluks.
    2. Maharashtra: The State has declared drought in 265 of 358 taluks.
    3. National threshold: The national deficit of about 12% is below the Centre’s 20% threshold for “agricultural drought”, so the national figure masks local distress.
    4. Dry months ahead: The IMD expects El Niño to bring below normal rain from October to December, threatening soil moisture and reservoir recharge.
    5. Crop signals: The Cabinet raised the support price, the price the government guarantees farmers, by ₹25 a quintal for wheat and ₹413 for mustard. The larger mustard rise nudges crop diversification.

    Challenges

    1. Coarse resolution: National forecasts hide district level extremes that drive crop planning.
    2. Institutional caution: A forecaster judged on staying within its band may prefer the milder call.
    3. Shifting drivers: Pacific warming and extra-tropical systems interact differently each year, weakening models built on past patterns.
    4. Threshold mismatch: A single national drought test can miss distress concentrated in a few States.

    Way Forward

    1. Sub-regional systems: The IMD should improve its sub-regional forecast systems and issue unwelcome forecasts plainly.
    2. Show the models: The IMD should publish what its models project alongside its official category.
    3. Regional probabilities: Forecasts should state the probability of deficient rain for each region.
    4. Early contingency plans: States should use district forecasts to trigger alternative crop plans.

    Conclusion

    This monsoon showed that a forecast can be accurate for the country and still fail the regions that most needed a warning. The test now is whether the IMD’s outlook for the coming months warns districts early enough to act.

    Key numbers

    1. July rain: About 1 percentage point above the “below 94%” forecast.
    2. August rain: 84% of the LPA, in line with the “below 94%” forecast.
    3. September rain: 92.4%, a little above the forecast of “below 91%”.

    Back2Basics: Types of drought

    1. Meteorological drought: A significant rainfall deficiency over a period, usually 25% or more below normal. Eg. Marathwada (2015).
    2. Agricultural drought: Too little soil moisture for crops, cutting yields. Eg. Bundelkhand (2016).
    3. Hydrological drought: Falling river flows, reservoir storage and groundwater after prolonged rain deficits. Eg. Cauvery basin (2016).
    4. Socioeconomic drought: Water scarcity that disrupts livelihoods and food security. Eg. Vidarbha (2012 to 2013).

    Matching Previous Year Question

    “[2017] With reference to ‘Indian Ocean Dipole (IOD)’ sometimes mentioned in the news while forecasting Indian monsoon, which of the following statements is/are correct? 1. IOD phenomenon is characterized by a difference in sea surface temperature between tropical Western Indian Ocean and tropical Eastern Pacific Ocean. 2. An IOD phenomenon can influence an El Nino’s impact on the monsoon. Select the correct answer using the code given below: (a) 1 only (b) 2 only (c) Both 1 and 2 (d) Neither 1 nor 2 Answer: B”
  • Pressure on food prices: El Nino effect, geopolitical tensions / Dip in fertiliser sales warning signal

    Pressure on food prices: El Nino effect, geopolitical tensions / Dip in fertiliser sales warning signal

    Why in the News

    The southwest monsoon has finished 14.7 per cent below the long period average (LPA) as on 14 September, with 24 of India’s 36 meteorological subdivisions more than 10 per cent deficient. The shortfall tracks a strengthening El Nino, which weakened the easterly trade winds in August and cut the transport of moisture laden air towards the subcontinent. Kharif sowing has held up at 1,096.5 lakh hectares, only 1.4 per cent below the same point last year. Fertiliser sales and wholesale mandi prices point the other way. The tension is between a sowing figure that reads as normal and the input and price data that point to lower yields, arriving at the same moment as a turn upward in world food prices.

    What is El Nino?

    1. El Nino: It is an abnormal warming of sea surface temperatures in the equatorial Pacific Ocean off the coasts of Ecuador and Peru, which shifts global atmospheric circulation for several seasons at a time.
    2. Effect on the Indian monsoon: It weakens the easterly trade winds that carry moisture laden air from east to west towards the subcontinent, so rainfall systems that do form deliver less rain than their number suggests.
    3. Temperature effect: El Nino suppresses rainfall over India and also raises temperatures, which is why its consequences run past the monsoon into the winter crop season.
    4. Low pressure system (LPS): It is the rain bearing system of the monsoon, formed when warm moist air near the ground rises, cools and condenses into cloud.

    How did the monsoon actually behave month by month?

    1. June: Not a single low pressure system formed, against a monthly average of three systems covering about 11 days. All India rainfall was 38 per cent below the LPA for the month.
    2. July: Four systems formed, close to the climatological average, and each persisted longer than usual. Total LPS days reached 24 against an average of 13.56, and rainfall came in 1 per cent above the LPA.
    3. August: Six systems formed against a normal of 5.38, and LPS days reached 26 against a normal of 16.3. Rainfall still recorded a 16.3 per cent deficit, because weakened easterly trade winds cut moisture transport.
    4. Season and spatial spread: Cumulative rainfall to 14 September was 14.7 per cent below the LPA, with 24 of 36 subdivisions over 10 per cent deficient. The southern States, along with Marathwada and Vidarbha in Maharashtra, were worst affected.

    Why does sowing acreage understate the damage?

    1. Kharif acreage: Area sown under kharif crops was 1,096.5 lakh hectares as of 11 September, against 1,112.5 lakh hectares for the same period of 2025, a gap of only 1.4 per cent.
    2. Fertiliser sales: Sales in April to July 2026 fell across di ammonium phosphate (25.6 to 24.4 lakh tonnes), muriate of potash (7 to 5.9 lakh tonnes) and complex fertilisers (50 to 43 lakh tonnes) against the same months of 2025. Only single super phosphate rose, from 20 to 20.2 lakh tonnes.
    3. Urea: Sales fell 6.6 per cent despite policy interventions to secure natural gas for domestic production and to secure imports through the West Asia supply shocks.
    4. Mandi prices: Maize at Chhindwara in Madhya Pradesh is around Rs 2,625 a quintal against Rs 2,165 a year ago. Arhar at Akola is Rs 8,650 against Rs 6,200 and soyabean at Dewas Rs 6,150 against Rs 4,300.
    5. Output forecasts: The United States Department of Agriculture (USDA) has forecast India’s rice output falling to 147 million tonnes from an all time high of 154 million tonnes, and maize to 50 million tonnes from 55.1 million tonnes.
    6. The temporal and spatial pattern: Extended dry spells interspersed with heavy downpours, with rain largely confined to Odisha, Chhattisgarh, eastern Madhya Pradesh, Gangetic West Bengal, Jharkhand and Uttar Pradesh, translates into lower yields rather than into unsown land.

    What does the El Nino outlook mean for the rabi season?

    1. Current state: El Nino is in a strong state, with average sea surface temperatures in the equatorial Pacific roughly 1.8 degrees Celsius above normal.
    2. Projection: The National Oceanic and Atmospheric Administration (NOAA) projects a 90 per cent plus chance of a very strong event, meaning sea surface temperatures more than 2 degrees Celsius above normal, running from September through January.
    3. Decay path: The event is projected to stay strong, above 1.5 degrees Celsius, until March, and weak to moderate, 0.5 to 1.5 degrees Celsius, until May.
    4. Crops at risk: A short and warm winter would hit the rabi crop, from wheat, rapeseed mustard, chana, masoor and matar to potato, onion, garlic, jeera, saunf and dhaniya.

    Why are world food prices turning up now?

    1. The buffer that held: The West Asia conflict produced no dramatic spike in world food prices, unlike Russia’s invasion of Ukraine in 2022, because back to back bumper crops in 2024 to 2025 and 2025 to 2026 left ample stocks of wheat, rice, maize, sugar, soyabean, rapeseed and palm oil.
    2. The index: The Food and Agriculture Organisation (FAO) food price index, a weighted average of world prices of a basket of food commodities against a 2014 to 2016 base value of 100, stood at 133.3 points in August, the highest since November 2022 and below the all time high of 160.2 points in March 2022.
    3. Where the pressure sits: The vegetable oil index was the highest since June 2022 and the cereal index edged to a 27 month high.
    4. Vegetable oils: Landed Mumbai prices of imported crude palm, soyabean and sunflower oil are $1,285, $1,300 and $1,450 per tonne, against September 2025 averages of $1,164, $1,182 and $1,293.
    5. Cereals: Wheat export prices firmed over the past year from $228 to $262 per tonne for Argentina, $226 to $290 for the European Union, $251 to $319 for Australia and $235 to $354 for the United States. Corn from Argentina and Brazil is exported at $219 and $238 against $200 and $210 a year ago.
    6. The direction of travel: A running down of stocks, disrupted trade logistics from escalating tensions in West Asia and Russia Ukraine, and a strengthening El Nino all push world prices the same way.

    Challenges to India’s food price management under El Nino

    1. Import dependence in edible oils: India imports the bulk of its vegetable oil, so a world price move passes into domestic retail prices within weeks regardless of the domestic harvest. Eg. Landed Mumbai prices of crude palm, soyabean and sunflower oil are all above their September 2025 averages.
      The Fix: Tie import duty changes to a stated trigger price rather than announcing them after the retail price has already moved.
    2. Procurement concentrated in two crops: Assured purchase at the support price operates at scale for wheat and rice, so a pulse or oilseed grower carries the full price risk of a bad season. Eg. Pulse and oilseed prices at Akola and Dewas moved sharply this year with no procurement floor doing the work.
      The Fix: Extend physical procurement capacity to pulses and oilseeds in the deficit districts rather than relying on an announced floor alone.
    3. Input withdrawal is invisible in acreage data: A farmer who sows but cuts fertiliser use produces a yield shortfall that no sowing statistic records until harvest. Eg. Kharif area was 1.4 per cent below last year while fertiliser sales fell across every major category except single super phosphate.
      The Fix: Publish district level fertiliser offtake alongside the weekly sowing bulletin so the yield signal arrives before the harvest does.
    4. Irrigation cover decides the rabi outcome: The winter crop depends on stored soil moisture and reservoir levels built during the monsoon, which a deficient season does not deliver. Eg. The southern States, Marathwada and Vidarbha carried deficits above 10 per cent this season.
      The Fix: Sequence reservoir releases for the rabi sowing window in the deficient subdivisions rather than for the standing kharif crop alone.
    5. Buffer stocks cannot absorb a domestic and a world shock together: Releasing stock cools the domestic market only where the commodity is one the state actually holds. Eg. Duty free imports of up to 10 lakh tonnes of raw sugar were allowed until 31 October after inventory fell to multi year lows.
      The Fix: Hold a standing calibrated import window for commodities with no domestic buffer, so the decision is not taken at the festival season peak.

    Conclusion

    Food price pressure this year is not a single monsoon question. A rainfall deficit, a pullback in purchased inputs and a turn in world prices are three separate pressures that have arrived together, and only the first of them ends with the season. The winter crop is where the remaining two will be counted, since the same ocean warming that suppressed the rains is projected to persist into the sowing window. The rabi sowing period is the next decision point, and input availability and reservoir cover in the deficient subdivisions are the markers to watch.

    Matching Previous Year Question

    “[2014, GS1, 10 marks] Most of the unusual climatic happenings are explained as an outcome of the El-Nino effect. Do you agree?”

  • There is no such thing as a ‘UN map with borders’: UN Secretary-General

    Why in the News

    The United Nations Secretary General has stated that the United Nations has not published any map with borders and that it is not for the United Nations to define borders. The statement answers India’s objection to “anomalies” in a “Map of the World” published by UN Geospatial on 1 July and used during the consultation process for the “Correct the Map” resolution. That map showed the Line of Control in Jammu and Kashmir as a dotted line with an explanatory note attached, and omitted the Indian and Chinese “claim lines” in Arunachal Pradesh and Aksai Chin that previous United Nations maps carried, with no note explaining the omission. India voted in favour of the resolution, which the United Nations General Assembly passed on 3 September to replace the Mercator map with maps following the “equal area” principle. The contest is that a map disowned as unofficial has stayed on the United Nations website and circulated as the artefact accompanying a resolution India supported.

    What is the “Correct the Map” resolution?

    1. Replacement of the Mercator map: The resolution, passed by the United Nations General Assembly on 3 September, seeks to replace the Mercator map with maps that follow the “equal area” principle.
    2. Distortion of landmass sizes: The Secretary General’s stated position is that there are distortions in the landmasses relative to their real sizes, that these come from power relations of the past, and that those distortions should be corrected.
    3. Scope of the resolution: The resolution is not a map, and the approval of a resolution in the General Assembly does not amount to the adoption of any cartographic depiction.

    What did the disputed map actually show?

    1. “Map of the World”, published 1 July: The artefact is titled the “Map of the World”, was published by UN Geospatial on 1 July, and was later taken up for discussion at the General Assembly.
    2. The Line of Control was marked and explained: The map showed the Line of Control in Jammu and Kashmir as a dotted line, with a note stating that the dotted line represents approximately the Line of Control agreed upon by India and Pakistan and that the final status of Jammu and Kashmir has not yet been agreed upon by the parties.
    3. The claim lines were dropped without explanation: It depicted Arunachal Pradesh and Aksai Chin without the Indian and Chinese “claim lines” that previous United Nations maps used, and carried no note explaining that omission.
    4. Continued hosting on the United Nations website: The map published by UN Geospatial has remained on the United Nations website.

    What is the United Nations position on maps and borders?

    1. No map with borders exists: The Secretary General’s position is that there is no such thing as a United Nations map with borders and that it is not for the United Nations to define borders.
    2. The artefact is attributed elsewhere: The map on the website is described as not an official United Nations map and as the contribution of a non governmental organisation.
    3. Indicative status of the depiction: The map is treated as indicative, with no definition by the United Nations of what borders should be.

    What position has India taken?

    1. The vote was on the principle: The Ministry of External Affairs stated on 8 September that India’s vote for the resolution was in support of the underlying principle of “equal area representation”.
    2. The map question was separated from the vote: The Ministry’s stated position is that the United Nations does not endorse any map and does not issue any map, and that maps may exist for reasons of consultation.
    3. The omission has been formally raised: The Ministry stated that India has taken note of the anomaly and is taking it up with the United Nations.

    Challenges in the depiction of disputed boundaries on international maps

    1. An unofficial map acquires official standing by association: A map circulated during a General Assembly process is read as carrying institutional authority whatever its disclaimer says. Eg. The “Map of the World” was used during the consultation process for a resolution and has remained on the United Nations website.
      The Fix: Require any cartographic material circulated in a General Assembly process to carry the producing entity’s name and the standard territorial disclaimer on the artefact itself.
    2. Disclaimers are applied inconsistently across disputes: Explaining one disputed line and silently dropping another creates an asymmetry that reads as a position. Eg. The same map annotated the Line of Control and carried no note on the omitted claim lines in Arunachal Pradesh and Aksai Chin.
      The Fix: Apply a single annotation standard to every disputed boundary on a map, so a line is either shown with its note or its absence is explained.
    3. Correction has no procedural route: A member state that objects to a depiction can raise it bilaterally with the Secretariat, and there is no mechanism that compels a revision or a withdrawal. Eg. India has taken note of the anomaly and is taking it up with the United Nations.
      The Fix: Create a published register of member state objections to circulated maps, with a stated time limit for the producing entity to respond.
    4. Domestic law and international depiction diverge: India’s own legal position on depicting its external boundaries binds publishers within India and has no effect on material produced abroad. Eg. Indian law requires the depiction of Indian territory as claimed, which the circulated map did not follow.
      The Fix: Route the objection through the United Nations Group of Experts on Geographical Names and the regional cartographic conferences, where standards are set rather than only contested after publication.

    Conclusion

    The resolution and the map are two different objects and the Secretary General’s answer rests entirely on that separation. It resolves the legal question, since no cartographic depiction was adopted by anyone, and leaves the practical one open, because the artefact that dropped the claim lines is still hosted where a reader will find it. The status is that India’s vote stands on the equal area principle, the objection has been raised with the United Nations, and the map has not been altered. The marker to watch is whether UN Geospatial reissues the map with the claim line annotation restored or withdraws it from the website.

    Back2Basics: UN Geospatial

    1. UN Geospatial: UN Geospatial, formerly the United Nations Cartographic Section, is the Secretariat unit that produces maps and geospatial products for United Nations use.
    2. Map products supplied: It supplies general reference maps, maps for peace operations and thematic maps requested by United Nations bodies.
    3. The status of its maps: Its maps carry a disclaimer that the designations used and the presentation of material do not imply any official endorsement or acceptance by the United Nations.
    4. Relevance to the disputed artefact: The artefact at issue was produced by this unit yet has been described as not an official United Nations map.

    Matching Previous Year Question

    “[2026] Which of the following with reference to Indian States is/are NOT correct? 1. Uttar Pradesh shares its boundary with the highest number of other Indian States. 2. Rajasthan shares the longest international border among all Indian States. 3. Sikkim is the only State that shares its boundary with just one other Indian State. (a) 1 only (b) 1 and 2 (c) 2 and 3 (d) 3 only ANSWER: C”

  • El Nino to peak during Oct-Dec this year, says US climate agency

    Why in the News

    The current El Nino event will enter its peak phase during October to December this year and will prevail through the winter season. The National Oceanic and Atmospheric Administration (NOAA) puts the chance of the event intensifying further into the “very strong” category at greater than 90 per cent. Sea surface temperatures in the key Nino regions continued to rise through August and clocked readings of 1.8 to 3 degrees Celsius. On that trajectory the 2026 El Nino would be a historic event, the strongest ever recorded since 1950. The consequence is that a year of below normal rainfall and above normal temperature is now being forecast with confidence rather than flagged as a possibility.

    What is El Nino?

    1. El Nino: El Nino is a naturally occurring ocean and atmospheric phenomenon in which abnormal warming is recorded along the equatorial and central Pacific Ocean waters.
    2. What drives the warming: The easterly trade winds that normally push warm surface water towards the western Pacific weaken, so warm water spreads back eastward and suppresses the cold upwelling off South America.
    3. Global weather effects: El Nino conditions are linked to extreme weather across the globe, in the form of higher than average temperatures, rainfall or droughts.
    4. El Nino Southern Oscillation cycle: It is the warm phase of the El Nino Southern Oscillation, whose cool phase is La Nina, and the cycle recurs irregularly rather than on a fixed calendar.

    What does the latest assessment actually record?

    1. The temperatures kept climbing: Sea surface temperatures continued to rise in August, and the key Nino regions clocked readings of 1.8 to 3 degrees Celsius.
    2. The index confirms acceleration: The latest Nino index, covering June through August, rose by 0.4 degrees Celsius over the May to July value, confirming a rapidly intensifying event.
    3. The category is expected to move up: NOAA puts the chance of intensification into the “very strong” category at greater than 90 per cent.
    4. The duration is not short: The event is expected to prevail through the winter season, beyond the October to December peak.
    5. Strongest event since 1950: The 2026 event would be the strongest recorded since 1950, which is the start of the comparable record.

    Challenges posed by a very strong El Nino

    1. The Indian monsoon weakens in most El Nino years: A warm eastern Pacific shifts the rising limb of the Walker circulation away from the Indian Ocean, which suppresses monsoon rainfall over India. Eg. The very strong event of 2015 and 2016 followed consecutive deficient monsoons in India in 2014 and 2015.
      The Fix: Trigger the contingency crop plans of the Indian Council of Agricultural Research at the forecast stage rather than after a rainfall deficit is confirmed, so short duration and drought tolerant seed reaches districts before sowing.
    2. Reservoir and groundwater stress follows the deficit by months: A weak monsoon empties storage that the following summer depends on, so the damage peaks long after the event is over. Eg. Southern States drawing on hydropower face the shortfall in the dry season that follows a deficient monsoon.
      The Fix: Set reservoir drawdown limits for the post monsoon season on the forecast rather than on the current storage level, so carryover is protected.
    3. Food price inflation moves with a small production shortfall: A modest fall in output of pulses, oilseeds and vegetables translates into a disproportionate price rise because those crops have thin buffer stocks. Eg. Pulses and edible oils are already import dependent, so a domestic shortfall is met at world prices.
      The Fix: Pre position import contracts for pulses and edible oils in the peak forecast window, so procurement is not made in a market that has already moved.
    4. Marine fisheries are disrupted by the same warming: Suppressed upwelling cuts nutrient supply and moves fish stocks, which hits coastal livelihoods that carry no crop insurance equivalent. Eg. The collapse of the Peruvian anchoveta catch is the classic documented El Nino fishery effect.
      The Fix: Extend forecast linked advisories and lean season support to registered marine fishers on the same basis as agricultural advisories.
    5. A strong event raises the global temperature record itself: El Nino releases ocean heat into the atmosphere, so the warmest years on record cluster in El Nino years and compound the underlying warming trend. Eg. Heat released during a strong event is added on top of the long term rise rather than substituting for it.
      The Fix: Issue heat action plan activation thresholds for the following summer at the time of the peak forecast, so city level preparation runs on the seasonal outlook rather than on the first heatwave.

    Conclusion

    The forecast has moved from probability to expectation, since the agency now attaches a greater than 90 per cent chance to further intensification and expects the event to hold through the winter. That gives India a lead time of several months between the warning and the season in which the consequences land, which is the interval in which seed, storage and import decisions are actually made. The status is that the event is intensifying and unbroken, and the next milestone is the peak window itself, when the category will either be confirmed or fall short of it.

    Back2Basics: The Nino regions and the Nino index

    1. What the regions are: The Nino regions are fixed boxes in the equatorial Pacific, numbered 1+2, 3, 3.4 and 4, running from the South American coast westward.
    2. Nino 3.4 as the standard region: Nino 3.4, in the central equatorial Pacific, is the region used for standard El Nino Southern Oscillation monitoring.
    3. What the index measures: The index tracks the sea surface temperature anomaly, meaning the departure from the long period average for that region, rather than the absolute temperature.
    4. How an event is classified: Sustained positive anomalies of half a degree Celsius or more mark an El Nino, and anomalies of about 2 degrees Celsius and above place it in the “very strong” category.

    Matching Previous Year Question

    “[2017] With reference to ‘Indian Ocean Dipole (IOD)’ sometimes mentioned in the news while forecasting Indian monsoon, which of the following statements is/are correct? 1. IOD phenomenon is characterized by a difference in sea surface temperature between tropical Western Indian Ocean and tropical Eastern Pacific Ocean. 2. An IOD phenomenon can influence an El Nino’s impact on the monsoon. Select the correct answer using the code given below: (a) 1 only (b) 2 only (c) Both 1 and 2 (d) Neither 1 nor 2 ANSWER: (b)”

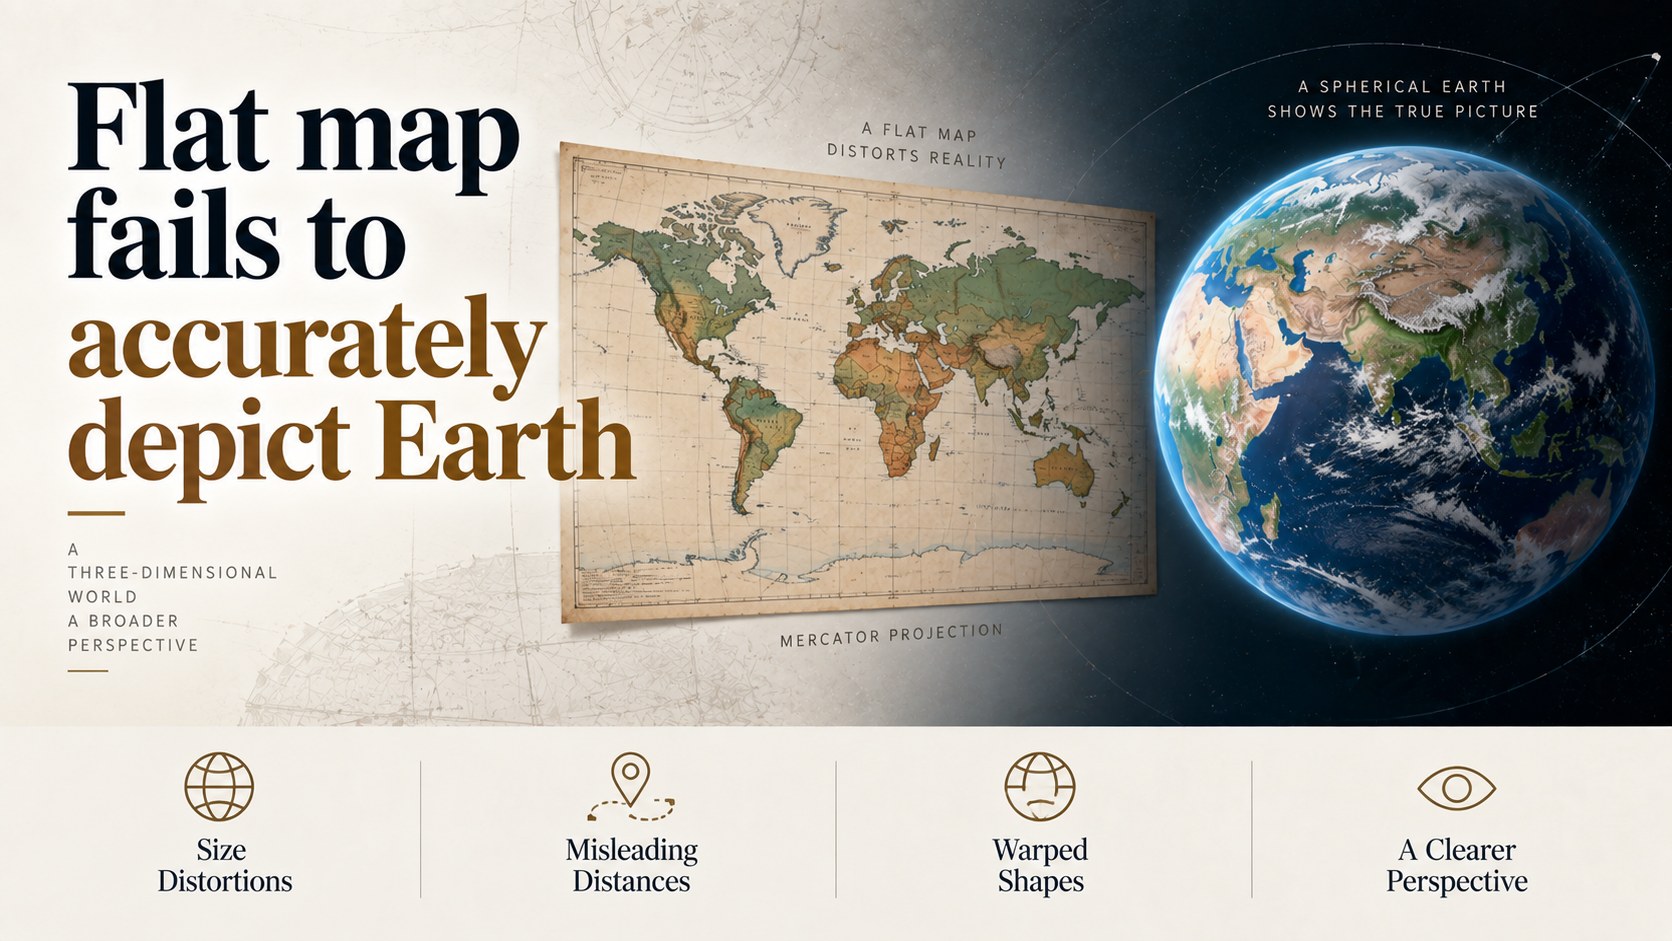
  • Why a flat map fails to accurately depict Earth

    Why a flat map fails to accurately depict Earth

    Why in the News

    • The UN General Assembly has adopted a resolution encouraging a shift from the Mercator projection towards the Equal Earth projection.
    • 164 countries, including India, supported the resolution.
    • The United States voted against, while six countries abstained.
    • The resolution is non-binding.
    • The debate centres on how world maps represent the relative size of different regions, particularly Africa.

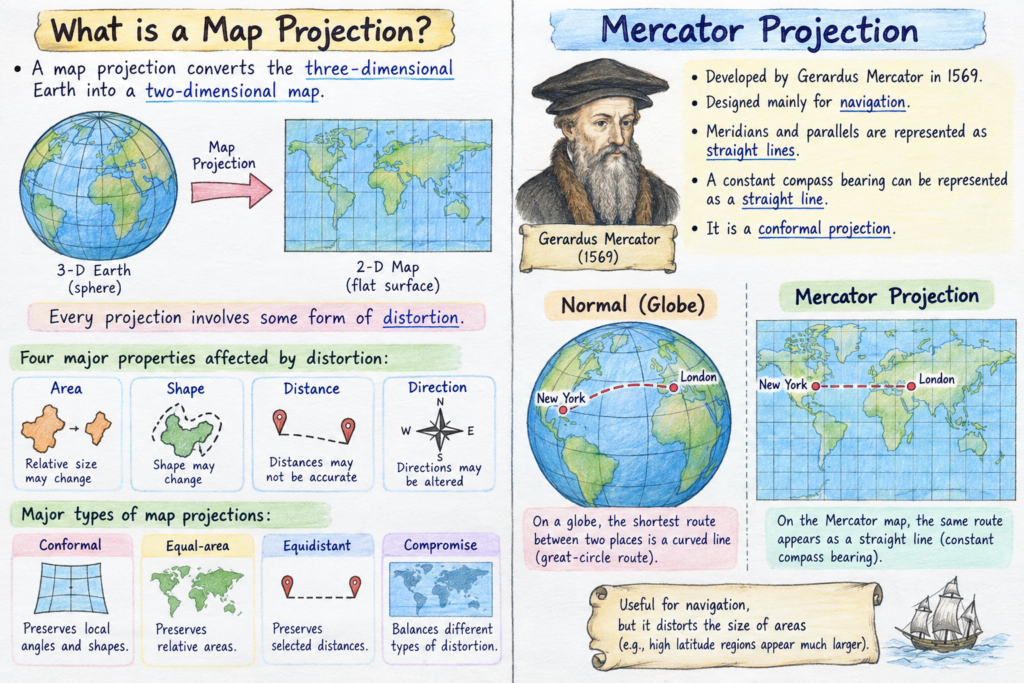
    What is a Map Projection?

    • A map projection converts the three-dimensional Earth into a two-dimensional map.
    • Every projection involves some form of distortion.
    • Four major properties are: Area, Shape, Distance, Direction
    • Major types include:
      • Conformal: Preserves local angles and shapes.
      • Equal-area: Preserves relative areas.
      • Equidistant: Preserves selected distances.
      • Compromise: Balances different types of distortion.

    Mercator Projection

    • Developed by Gerardus Mercator in 1569.
    • Designed mainly for navigation.
    • Meridians and parallels are represented as straight lines.
    • A constant compass bearing can be represented as a straight line.
    • It is a conformal projection.

    Major Limitation

    • Areas become increasingly exaggerated towards the poles.
    • Greenland and Antarctica therefore appear much larger than their actual relative size.
    • This can visually distort perceptions of the geographical size of regions.

    Equal Earth Projection

    • Developed in 2018.
    • It is an equal-area projection.
    • Preserves the relative area of landmasses.
    • Particularly useful for:
      • Population distribution
      • Climate data
      • Land-use mapping
      • Resource distribution
    • It sacrifices some accuracy in shape and distance.

    Which Projection for Which Purpose?

    • Navigation → Mercator or other conformal projections.
    • Statistical/thematic maps → Equal-area projections such as Equal Earth.
    • General world maps → Robinson or Winkel Tripel.
    • Polar regions → Azimuthal projections.

    Challenges

    • UN resolutions are not legally binding.
    • Digital mapping systems continue to rely heavily on Mercator-derived projections.
    • Changing a projection does not eliminate distortion; it only changes which property is prioritised.
    • Therefore, maps should clearly mention the projection and its principal purpose.

    Way Forward

    • Use projection according to purpose, rather than adopting one universal map.
    • Provide equal-area options in government statistical and mapping platforms.
    • Clearly mention the projection used on published maps.
    • Improve geographical literacy by teaching the limitations of different projections.

    Prelims Pointers

    • Compromise projections → Balance multiple distortions.
    • Mercator → Conformal projection.
    • Mercator → Developed in 1569.
    • Mercator’s major use → Navigation.
    • Equal Earth → Equal-area projection.
    • Equal-area projection → Preserves relative areas.
    • Geostationary ≠ Geosynchronous is a separate orbital concept, not a map projection.
    • No flat map → Can simultaneously preserve area, shape, distance and direction perfectly.
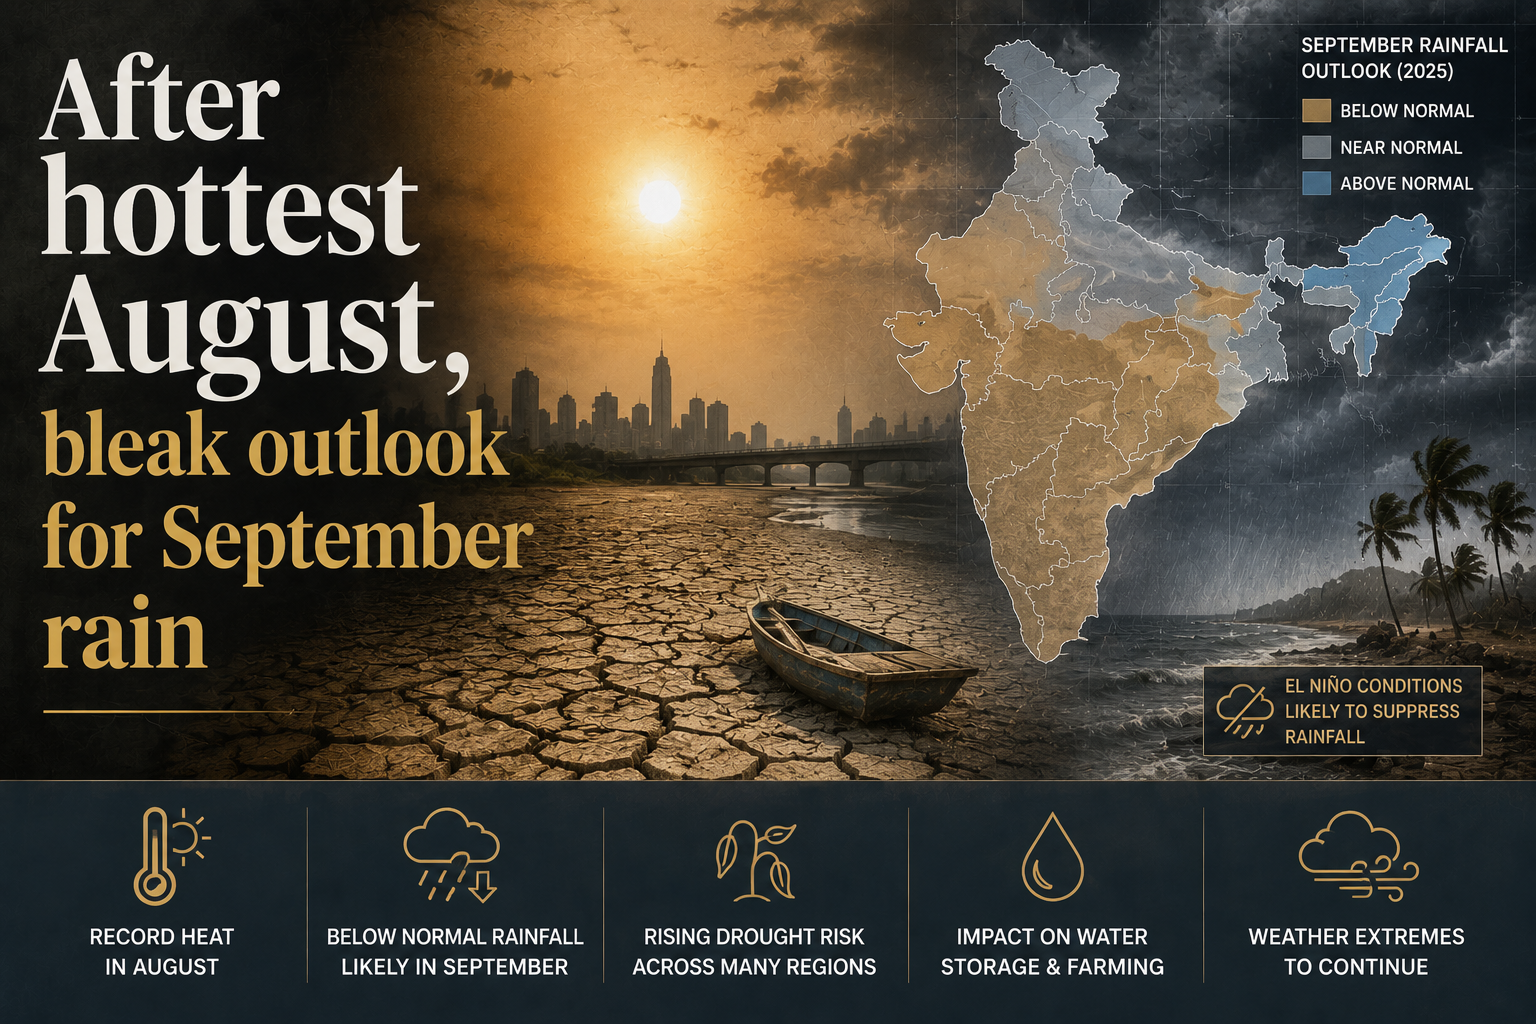
  • After hottest August, bleak outlook for September rain

    After hottest August, bleak outlook for September rain

    Why in the News

    The India Meteorological Department (IMD) has forecast September rainfall at least 9 per cent short of the long period average of 167.9 mm, the average rainfall recorded for that month over several decades against which every seasonal forecast is stated.

    What does the September outlook actually say?

    1. September carries about a fifth of the season’s rain: July contributes 32 per cent and August 29 per cent of the June to September monsoon total.
    2. Some regions are exempt from the deficit call: Parts of northwest, northeast, east and east-central India and isolated areas of southeast peninsular India could receive “normal to above-normal rainfall”.
    3. Temperatures are forecast above normal at both ends: Maximum temperatures are expected above normal over most of India and minimum temperatures above normal over most areas.
    4. Recent Septembers have run against the longer pattern: September rainfall has seen a relative uptick in recent years.
    5. The previous outlook proved accurate: The IMD’s 31 July outlook had indicated below normal rainfall for August over much of the country, and the agency assessed that it matched observations over many regions.

    What made August the hottest since 1901?

    1. The average minimum temperature was the highest on record: It reached 24.36 degrees Celsius for the month.
    2. Rainfall was among the lowest for the month this century: India received 213.3 mm in August, the seventh lowest since 2001.
    3. El Nino is the stated cause: The IMD Director General attributed the heat to the ongoing El Nino, which dries out the atmosphere and raises temperatures.
    4. The month was not uniformly dry: Repeated low pressure systems brought heavy rain across the Indo-Gangetic Plains and parts of central and eastern India.
    5. The warming phase is expected to strengthen: IMD models indicate El Nino conditions will intensify through the remainder of the 2026 southwest monsoon season.

    Why did an unusually long run of low pressure days not lift the rainfall total?

    1. Four systems persisted for 26 days: Low pressure systems, the precursors to cyclonic storms, lasted a combined 26 days in August against a climatological average of 16.3 days.
    2. The systems all took the same track: They formed repeatedly over the Bay of Bengal, moved west-northwest and weakened over central and northern India.
    3. Their rain stayed within one belt: Rainfall activity from those systems was confined to the Indo-Gangetic Plain.
    4. Western Disturbances narrowed the spread further: These extra-tropical storms originating in the Mediterranean interacted with the monsoon circulation and with low pressure and cyclonic circulations. The interaction concentrated intense rainfall over eastern, east-central and parts of northwestern India rather than producing a widespread monsoon revival.

    How uneven has the season been across regions?

    1. Only central India ended August in surplus: Every other region closed the month below its normal cumulative rainfall.
    2. Three large regions carry the shortfall: The northwest, the east and northeast, and the south peninsula all recorded deficits.
    3. The deficit is deepest in the east and the south: The shortfall was particularly pronounced in the east and northeast and in the southern peninsula.
    4. A dry September would land on the same regions: Many parts of the country are expected to remain drier than normal, so the areas already short of rain gain no correction from the final month.

    Challenges to seasonal monsoon forecasting in India

    1. Seasonal skill is weakest exactly where it is needed: A national rainfall percentage carries far more confidence than the district level distribution a farmer sows against. Eg. The August forecast was correct on direction at the national level and did not anticipate that the month’s rain would concentrate on the Indo-Gangetic Plain.
      The Fix: Publish probabilistic district level outlooks with stated confidence intervals alongside the national figure, so an advisory can be issued at the scale sowing decisions are taken.
    2. The benchmark itself shifts: The long period average is recalculated against a moving set of decades, so a deficit against one baseline is not comparable with a deficit against another. Eg. The IMD revised the all-India seasonal normal downward when it updated the reference period, which changed what counted as a normal monsoon year.
      The Fix: Fix a published revision cycle for the normals and report every seasonal figure against both the old and the new baseline in the transition year.
    3. A normal seasonal total conceals destructive intensity: Rainfall delivered in a few heavy spells produces flooding and crop loss even where the season closes at normal. Eg. Kerala in 2018 recorded heavy concentrated spells in August that caused the State’s worst floods in a century.
      The Fix: Report the number of heavy and very heavy rainfall days alongside the seasonal total, so intensity enters the headline measure.
    4. El Nino does not translate into deficit with any reliability: The correlation between a warm Pacific and a weak Indian monsoon holds on average and fails in individual years. Eg. 1997 was among the strongest El Nino years on record and India’s monsoon rainfall that year was normal.
      The Fix: Report the Indian Ocean Dipole state and the Madden-Julian Oscillation phase alongside El Nino, since these are the drivers that offset it.
    5. A rainfall deficit becomes a crop loss through irrigation gaps: Under half of India’s net sown area is irrigated, so a shortfall passes directly into kharif output and food prices. Eg. Marathwada’s consecutive deficit years in 2015 and 2016 emptied reservoirs and forced water to be moved to Latur by rail.
      The Fix: Tie contingency crop planning and seed buffer releases to the mid-season forecast rather than to the end of season assessment.

    Conclusion

    Overall, the September outlook highlights the increasing variability of India’s monsoon. Better regional forecasting, climate monitoring, water management and timely farm advisories can help reduce the impact of rainfall deficits and build greater climate resilience.

    Back2Basics: El Nino Southern Oscillation

    1. What it is: The El Nino Southern Oscillation (ENSO) is the coupled ocean and atmosphere cycle in the tropical Pacific that redistributes rainfall across the tropics on a two to seven year rhythm.
    2. Three phases: El Nino is the warm phase, La Nina the cool phase, and the neutral phase sits between them.
    3. How it is measured: The Oceanic Nino Index tracks sea surface temperature anomalies in the central Pacific Nino 3.4 region, and the Southern Oscillation Index tracks the sea level pressure difference between Tahiti and Darwin.
    4. Why India tracks it: El Nino years are statistically associated with weaker southwest monsoon rainfall, and a positive Indian Ocean Dipole can partly offset that effect.

    “[2015, GS1, 12.5 marks] How far do you agree that the behavior of the Indian monsoon has been changing due to humanizing landscapes? Discuss.”

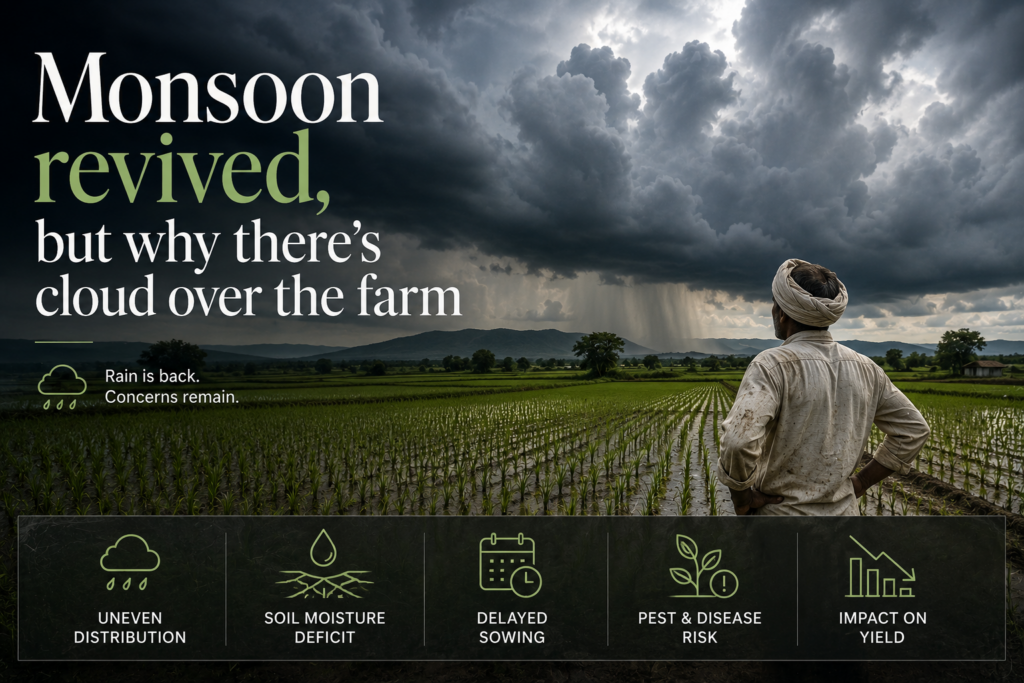
  • Monsoon revived, but why there’s cloud over the farm

    Why in the News?

    The southwest monsoon’s revival in July, despite a strengthening El Nino, has sharply narrowed the gap in area sown under kharif crops this season. The relief exposes a deeper tension between a recovering kharif and the mounting risks to the rabi season and to food inflation from El Nino’s lagged effect and a surge in global vegetable oil prices.

    Why did a sowing gap open and how did July reverse it?

    1. Weak start: Rainfall in June was 38 percent below the long period average, making it the sixth driest June in India since 1901, with not a single low pressure system forming.
    2. Early shortfall: By 6 July farmers had planted only 350.85 lakh hectares, which was 20.8 percent below the 442.80 lakh hectares sown in the same period of 2025.
    3. July turnaround: In July the country recorded four low pressure systems against a normal of three. These moved slowly, producing about 24 affected days against a normal of 14, lifting all India July rainfall to 2.4 percent above the average.
    4. Recovery: By 7 August the 967.92 lakh hectares covered was only 1.8 percent lower than last year, with the pulses gap down to 1.8 percent, cotton to 0.4 percent, and oilseeds exceeding last year’s level.

    What is El Nino and why does its effect lag?

    1. Definition: El Nino is the abnormal warming of surface waters in the central and eastern Pacific Ocean off Peru and Ecuador that suppresses monsoon rainfall over India.
    2. Lagged impact: El Nino’s effect on rainfall and temperatures comes with a lag of one to two months and can play out over five to six months or more.
    3. Current phase: It intensified from a weak to moderate phase in June into a moderate to strong event in July, and global agencies expect it to turn very strong during October to December.

    Why is the worst not yet over?

    1. Late kharif needs rain: Crops need rainfall during August and early September for flowering and grain formation that determine yields. Meteorological Department has predicted a fresh low pressure system around 12 August.
    2. Delayed hit: Because El Nino’s rainfall suppressing effect lags, its worst impact is still to come.
    3. Rabi at risk: A strengthening El Nino raises temperatures, and a short warm winter harms wheat, mustard and potato yields, so the real threat is to the rabi season.

    What does the FAO Food Price Index show?

    1. Index high: The United Nations Food and Agriculture Organization (FAO) food price index touched 131.1 points in July, up 1 percent from July 2025 and the highest since the 131.4 of January 2023, a three and a half year high. This means food prices are now at their highest level in about 3½ years.
    2. Vegetable oils drive it: The vegetable oils index reached 195.7 points, up 17.3 percent year on year and the highest since June 2022.
    3. Mixed components: The cereals index was 113.8 points, up 6.9 percent, while dairy fell 24.8 percent, sugar fell 8 percent, and meat rose just 0.8 percent.
    4. Causes: The rise is attributed to El Nino, heatwave hit crop yields in Europe, and supply disruptions from conflicts in West Asia and Ukraine.

    Why are vegetable oils the real concern for India?

    1. Import exposure: The combined value of India’s imports of oilseeds, pulses and cotton was close to 25 billion dollars in 2025-26, which El Nino could push to a new high.
    2. Biofuel diversion: Firming vegetable oil prices stem mainly from diversion of palm, rapeseed and soyabean oil toward biofuel as petroleum prices harden.
    3. Fuel substitution: These oils are used to make fatty acid methyl esters, a substitute for petroleum diesel, linking food and fuel markets.
    4. Buffer available: The government held 92.6 million tonnes of rice and wheat on 1 July against a required minimum of 41.1 million tonnes, plus over 4 million tonnes of pulses, which can be offloaded to contain inflation.

    Conclusion

    The July monsoon revival has rescued the kharif season, cutting the sowing gap to under 2 percent even as El Nino strengthened. The central worry has shifted to the rabi season and to food inflation, since El Nino’s temperature and rainfall effects lag and global vegetable oil prices are at multi year highs. Ample public grain stocks give the government room to manage food inflation, but the rabi outlook and edible oil import bill remain the open risks.

    Back2Basics:

    Foundational Context: Climate Change and Food Security

    1. About: Food security means reliable physical and economic access to sufficient, safe and nutritious food, which climate variability directly threatens.
    2. Tropical vulnerability: Tropical countries face greater exposure because agriculture is rain dependent and heat sensitive.
    3. India context: A large share of India’s cropped area is rainfed, tying output to monsoon performance.
    4. Transmission channels: Erratic rainfall, heat stress, pest incidence and global price shocks each transmit climate risk to food systems.

    FAO Food Price Index

    1. Convening body: Published by the United Nations Food and Agriculture Organization (FAO).
    2. What it measures: A weighted average of world prices of a basket of food commodities against a base period value taken as 100 for 2014 to 2016.
    3. Components: Tracks separate indices for cereals, vegetable oils, dairy, meat and sugar.
    4. Frequency: Released monthly.
    5. Recent reading: Touched 131.1 points in July, a three and a half year high.

    Government Initiatives for Agriculture and Edible Oils

    1. National Mission on Edible Oils Oil Palm: Mission to raise domestic oil palm and edible oil production and cut import dependence.
    2. PM-AASHA: Umbrella scheme assuring remunerative prices to farmers, especially for oilseeds and pulses.
    3. Price Stabilisation Fund: Buffer stock mechanism to moderate volatility in pulses and other commodities.
    4. Minimum Support Price: Price assurance to encourage sowing of pulses and oilseeds.

    Key Facts about the Monsoon and Kharif Season

    1. Sixth driest June: June 2026 was the sixth driest June since 1901.
    2. July rainfall: All India July rainfall was 2.4 percent above the long period average.
    3. Import bill: Oilseeds, pulses and cotton imports neared 25 billion dollars in 2025-26.
    4. Grain stocks: 92.6 million tonnes of rice and wheat held on 1 July against a 41.1 million tonne minimum.

    Challenges in Indian Agriculture

    1. Rainfall dependence: A large rainfed area leaves output exposed to monsoon swings.
    2. Import reliance: High dependence on imported edible oils and pulses exposes India to global prices.
    3. Climate volatility: El Nino and heatwaves disrupt both kharif and rabi seasons.
    4. Price transmission: Global food and fuel price shocks feed domestic inflation.
    5. Storage and logistics: Post harvest losses and uneven buffer management persist.
    6. Yield gaps: Low productivity in pulses and oilseeds constrains self sufficiency.

    Way Forward

    1. Raise oilseed output: Expand area and yields under the edible oils mission to cut imports.
    2. Diversify cropping: Promote pulses and climate resilient varieties in rainfed regions.
    3. Strengthen buffers: Use public grain and pulse stocks proactively to contain inflation.
    4. Improve forecasting: Sharpen monsoon and El Nino forecasting for sowing decisions.
    5. Invest in irrigation: Extend micro irrigation to reduce rainfall dependence.

    PYQ Relevance

    [UPSC 2023] Discuss the consequences of climate change on the food security in tropical countries.

    Linkage: The PYQ directly addresses the impact of climate change and climatic variability on food security in tropical countries. El Niño, erratic monsoons, heat stress and global food prices show how climate risks affect India’s kharif, rabi and food inflation.

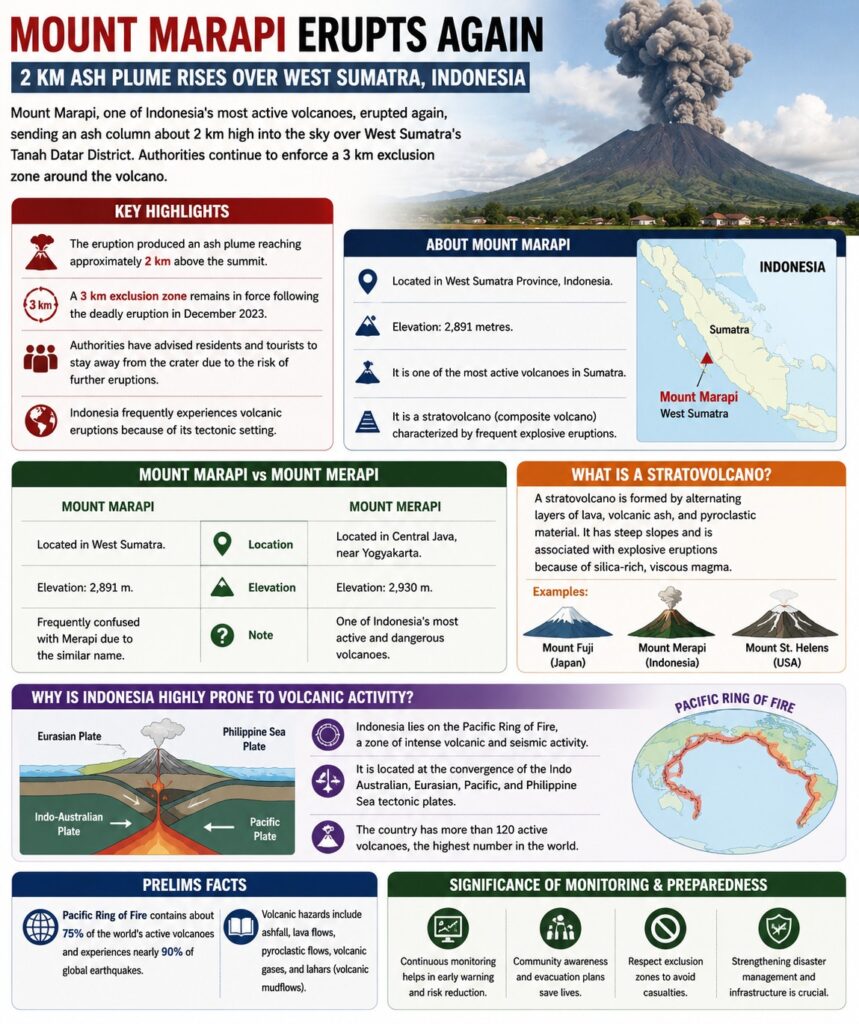
  • Mount Marapi Eruption in Indonesia

    Why in News?

    Mount Marapi, one of Indonesia’s most active volcanoes, erupted again, sending an ash column about 2 km high into the sky over West Sumatra’s Tanah Datar District. Authorities continue to enforce a 3 km exclusion zone around the volcano.

    Note: This volcano is Mount Marapi (West Sumatra), not Mount Merapi (Central Java). They are two different active volcanoes in Indonesia.

    Key Highlights

    • The eruption produced an ash plume reaching approximately 2 km above the summit.
    • A 3 km exclusion zone remains in force following the deadly eruption in December 2023.
    • Authorities have advised residents and tourists to stay away from the crater due to the risk of further eruptions.
    • Indonesia frequently experiences volcanic eruptions because of its tectonic setting.

    About Mount Marapi

    • Located in West Sumatra Province, Indonesia.
    • Elevation: 2,891 metres.
    • It is one of the most active volcanoes in Sumatra.
    • It is a stratovolcano (composite volcano) characterized by frequent explosive eruptions.

    What is a Stratovolcano?

    • A stratovolcano is formed by alternating layers of lava, volcanic ash, and pyroclastic material.
    • It has steep slopes and is associated with explosive eruptions because of silica-rich, viscous magma.
    • Examples include Mount Fuji (Japan), Mount Merapi (Indonesia), and Mount St. Helens (USA).

    Why is Indonesia Highly Prone to Volcanic Activity?

    • Indonesia lies on the Pacific Ring of Fire, a zone of intense volcanic and seismic activity.
    • It is located at the convergence of the Indo Australian, Eurasian, Pacific, and Philippine Sea tectonic plates.
    • The country has more than 120 active volcanoes, the highest number in the world.

    Prelims Facts

    • Pacific Ring of Fire contains about 75% of the world’s active volcanoes and experiences nearly 90% of global earthquakes.
    • Volcanic hazards include ashfall, lava flows, pyroclastic flows, volcanic gases, and lahars (volcanic mudflows).

    [2024] Consider the following:
    1. Pyroclastic debris
    2. Ash and dust
    3. Nitrogen compounds
    4. Sulphur compounds
    How many of the above are products of volcanic eruptions?

    [A] Only one

    [B] Only two

    [C] Only three

    [D] All four