Why in the News
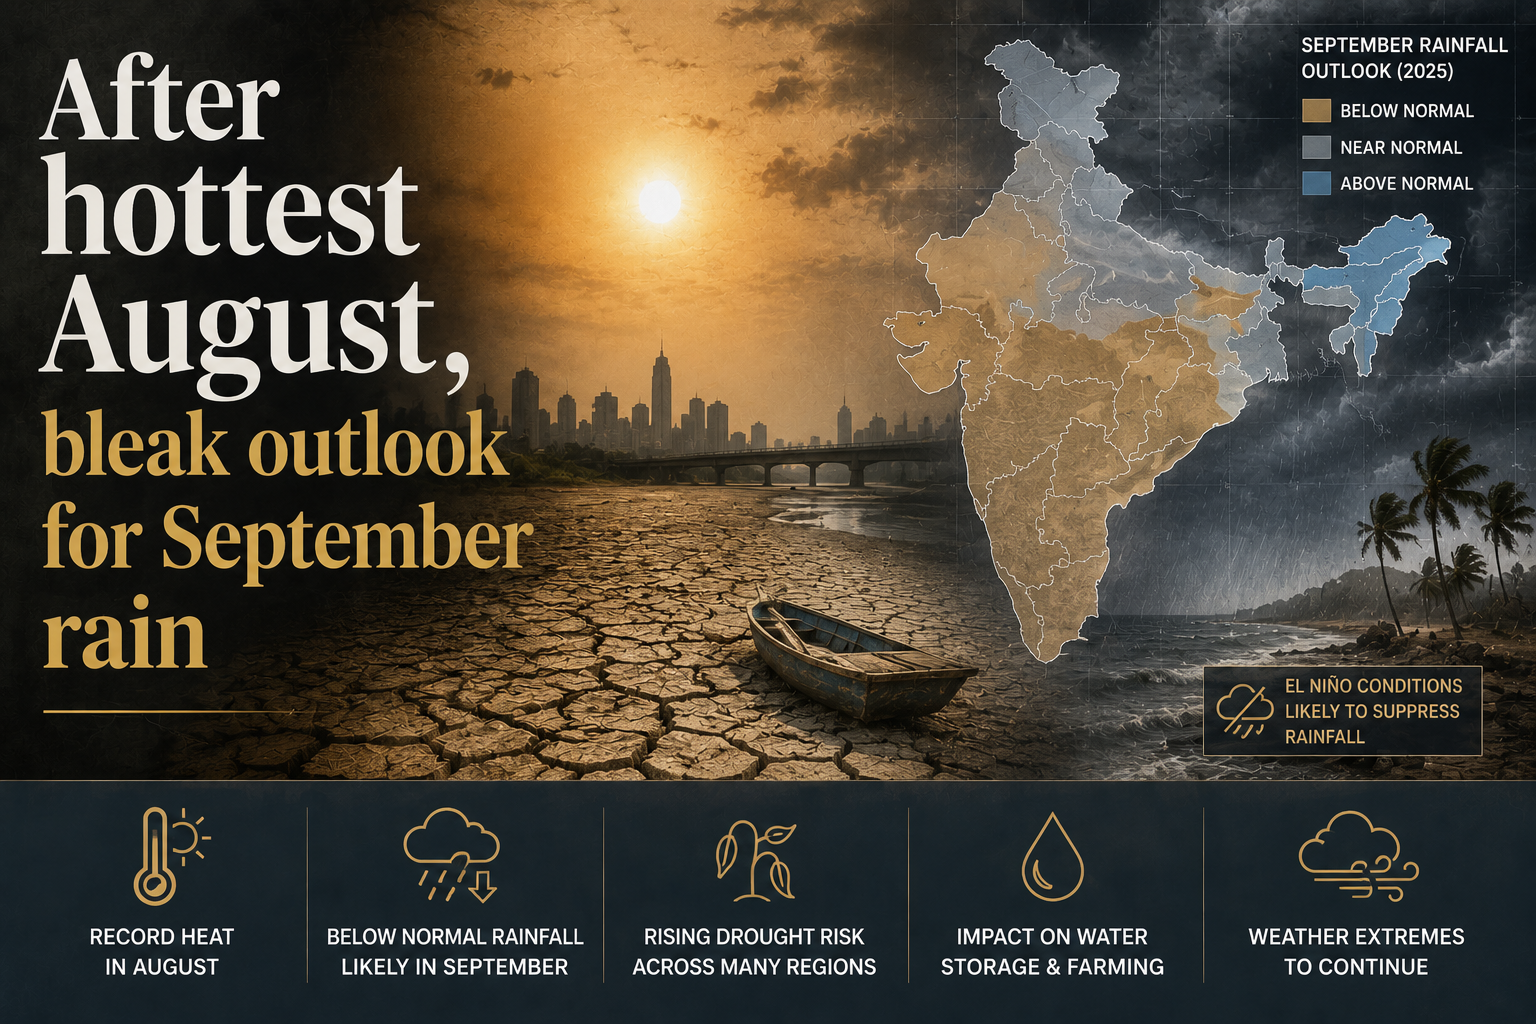
The India Meteorological Department (IMD) has forecast September rainfall at least 9 per cent short of the long period average of 167.9 mm, the average rainfall recorded for that month over several decades against which every seasonal forecast is stated.
What does the September outlook actually say?
- September carries about a fifth of the season’s rain: July contributes 32 per cent and August 29 per cent of the June to September monsoon total.
- Some regions are exempt from the deficit call: Parts of northwest, northeast, east and east-central India and isolated areas of southeast peninsular India could receive “normal to above-normal rainfall”.
- Temperatures are forecast above normal at both ends: Maximum temperatures are expected above normal over most of India and minimum temperatures above normal over most areas.
- Recent Septembers have run against the longer pattern: September rainfall has seen a relative uptick in recent years.
- The previous outlook proved accurate: The IMD’s 31 July outlook had indicated below normal rainfall for August over much of the country, and the agency assessed that it matched observations over many regions.
What made August the hottest since 1901?
- The average minimum temperature was the highest on record: It reached 24.36 degrees Celsius for the month.
- Rainfall was among the lowest for the month this century: India received 213.3 mm in August, the seventh lowest since 2001.
- El Nino is the stated cause: The IMD Director General attributed the heat to the ongoing El Nino, which dries out the atmosphere and raises temperatures.
- The month was not uniformly dry: Repeated low pressure systems brought heavy rain across the Indo-Gangetic Plains and parts of central and eastern India.
- The warming phase is expected to strengthen: IMD models indicate El Nino conditions will intensify through the remainder of the 2026 southwest monsoon season.
Why did an unusually long run of low pressure days not lift the rainfall total?
- Four systems persisted for 26 days: Low pressure systems, the precursors to cyclonic storms, lasted a combined 26 days in August against a climatological average of 16.3 days.
- The systems all took the same track: They formed repeatedly over the Bay of Bengal, moved west-northwest and weakened over central and northern India.
- Their rain stayed within one belt: Rainfall activity from those systems was confined to the Indo-Gangetic Plain.
- Western Disturbances narrowed the spread further: These extra-tropical storms originating in the Mediterranean interacted with the monsoon circulation and with low pressure and cyclonic circulations. The interaction concentrated intense rainfall over eastern, east-central and parts of northwestern India rather than producing a widespread monsoon revival.
How uneven has the season been across regions?
- Only central India ended August in surplus: Every other region closed the month below its normal cumulative rainfall.
- Three large regions carry the shortfall: The northwest, the east and northeast, and the south peninsula all recorded deficits.
- The deficit is deepest in the east and the south: The shortfall was particularly pronounced in the east and northeast and in the southern peninsula.
- A dry September would land on the same regions: Many parts of the country are expected to remain drier than normal, so the areas already short of rain gain no correction from the final month.
Challenges to seasonal monsoon forecasting in India
- Seasonal skill is weakest exactly where it is needed: A national rainfall percentage carries far more confidence than the district level distribution a farmer sows against. Eg. The August forecast was correct on direction at the national level and did not anticipate that the month’s rain would concentrate on the Indo-Gangetic Plain.
The Fix: Publish probabilistic district level outlooks with stated confidence intervals alongside the national figure, so an advisory can be issued at the scale sowing decisions are taken. - The benchmark itself shifts: The long period average is recalculated against a moving set of decades, so a deficit against one baseline is not comparable with a deficit against another. Eg. The IMD revised the all-India seasonal normal downward when it updated the reference period, which changed what counted as a normal monsoon year.
The Fix: Fix a published revision cycle for the normals and report every seasonal figure against both the old and the new baseline in the transition year. - A normal seasonal total conceals destructive intensity: Rainfall delivered in a few heavy spells produces flooding and crop loss even where the season closes at normal. Eg. Kerala in 2018 recorded heavy concentrated spells in August that caused the State’s worst floods in a century.
The Fix: Report the number of heavy and very heavy rainfall days alongside the seasonal total, so intensity enters the headline measure. - El Nino does not translate into deficit with any reliability: The correlation between a warm Pacific and a weak Indian monsoon holds on average and fails in individual years. Eg. 1997 was among the strongest El Nino years on record and India’s monsoon rainfall that year was normal.
The Fix: Report the Indian Ocean Dipole state and the Madden-Julian Oscillation phase alongside El Nino, since these are the drivers that offset it. - A rainfall deficit becomes a crop loss through irrigation gaps: Under half of India’s net sown area is irrigated, so a shortfall passes directly into kharif output and food prices. Eg. Marathwada’s consecutive deficit years in 2015 and 2016 emptied reservoirs and forced water to be moved to Latur by rail.
The Fix: Tie contingency crop planning and seed buffer releases to the mid-season forecast rather than to the end of season assessment.
Conclusion
Overall, the September outlook highlights the increasing variability of India’s monsoon. Better regional forecasting, climate monitoring, water management and timely farm advisories can help reduce the impact of rainfall deficits and build greater climate resilience.
Back2Basics: El Nino Southern Oscillation
- What it is: The El Nino Southern Oscillation (ENSO) is the coupled ocean and atmosphere cycle in the tropical Pacific that redistributes rainfall across the tropics on a two to seven year rhythm.
- Three phases: El Nino is the warm phase, La Nina the cool phase, and the neutral phase sits between them.
- How it is measured: The Oceanic Nino Index tracks sea surface temperature anomalies in the central Pacific Nino 3.4 region, and the Southern Oscillation Index tracks the sea level pressure difference between Tahiti and Darwin.
- Why India tracks it: El Nino years are statistically associated with weaker southwest monsoon rainfall, and a positive Indian Ocean Dipole can partly offset that effect.
“[2015, GS1, 12.5 marks] How far do you agree that the behavior of the Indian monsoon has been changing due to humanizing landscapes? Discuss.”