💥Mains Ready By December. Smash Mains & Smash PYQ Admissions Open

GS Paper: GS3

  • INS Mysore arrives at Lumut, Malaysia for Exercise Samudra Laksamana [MENTION]

    PIB class: Press Release. Ministry: Ministry of Defence.

    Why in News

    Indian Naval Ship (INS) Mysore arrived at Lumut, Malaysia for the 4th edition of Exercise Samudra Laksamana.

    Static Context (the exam value sits here)

    1. Exercise Samudra Laksamana is the bilateral naval exercise between India and Malaysia. It builds maritime interoperability between the two navies.
    2. Lumut hosts the main base of the Royal Malaysian Navy. It sits on the west coast of Peninsular Malaysia facing the Strait of Malacca.
    3. INS Mysore is a guided missile destroyer of the Indian Navy. It belongs to the Delhi class of destroyers.
    4. The exercise supports India’s Act East Policy and Indo Pacific outreach. Malaysia is an ASEAN member and a maritime neighbour across the Bay of Bengal.

    Prelims angle

    Pairing exercises with countries. Samudra Laksamana is India and Malaysia. Location cue Lumut and the Strait of Malacca as a chokepoint. Distinguish from other India naval exercises such as Varuna with France and Malabar with the United States, Japan and Australia.

    Mains angle

    GS3, security, and GS2, India and its neighbourhood. Naval diplomacy and maritime security cooperation in the Indo Pacific.

    Matching Previous Year Question

    “No direct PYQ on this bilateral exercise was traced in the provided files. Closest tracked Microtheme is Defence and India’s maritime security cooperation.”

  • Fueling the Blue Economy [PIB Backgrounder]

    PIB class: PIB Backgrounder. Unit: PIB feature unit.

    Why in News

    PIB published a thematic Backgrounder titled Fueling the Blue Economy.

    Core facts (static, definitional)

    1. The Blue Economy is the sustainable use of ocean resources for economic growth, livelihoods and jobs, while preserving ocean ecosystem health. It covers fisheries, shipping, ports, coastal tourism, marine minerals and marine renewable energy.
    2. Governing frame: India’s draft Blue Economy policy treats the ocean as the sixth dimension of national growth alongside land based sectors.
    3. Release specific figures: Not verifiable this run and therefore omitted.

    Static Context

    1. The Deep Ocean Mission is India’s flagship ocean programme. It funds deep sea exploration, a manned submersible named Samudrayaan, and survey of sea bed minerals and biodiversity. The nodal body is the Ministry of Earth Sciences.
    2. The Sagarmala Programme drives port led growth. It links port modernisation, coastal shipping and inland waterways under the Ministry of Ports, Shipping and Waterways.
    3. The Pradhan Mantri Matsya Sampada Yojana supports fisheries. It targets higher fish production, aquaculture and fisher incomes.
    4. India holds a large maritime footprint. It has a coastline of about 11,000 kilometres and an Exclusive Economic Zone of about 2 million square kilometres, which anchors the Blue Economy potential.

    Prelims angle

    The definition of the Blue Economy. Deep Ocean Mission and Samudrayaan under the Ministry of Earth Sciences. Sagarmala under the shipping ministry. The Exclusive Economic Zone extending to 200 nautical miles under the United Nations Convention on the Law of the Sea. Blue carbon ecosystems such as mangroves and seagrass.

    Mains angle

    GS3, conservation and economy, and GS1 geography, ocean resources. Balancing marine resource extraction with ocean ecosystem health, and the Blue Economy as a driver of coastal livelihoods.

    Matching Previous Year Question

    “[2026] Consider the following statements with reference to the Sagarmala Programme of the Government of India: I. The Sagarmala Programme seeks to achieve port-led economic growth through cost-effective and sustainable coastal infrastructure. II. The success of the Sagarmala Programme is reflected in significant growth in coastal and inland waterway shipping, along with improved global port rankings. III. Sagarmala 2.0 aims to position India as a global maritime innovation hub aligned with Atmanirbhar Bharat and Viksit Bharat 2047 visions. Which of the following relationships among the above statements is/are correct? 1. Statement II validates the effectiveness of the strategies envisioned in Statement I. 2. Statement III extends the objectives of Statement I by embedding them into a future-oriented innovation framework. 3. Statement I contradicts Statement III by focusing only on traditional infrastructure instead of modern innovation. Select the answer using the code given below: (a) 1 only (b) 1 and 2 (c) 2 and 3 (d) 3 only. Answer: (b)”

    “[2014, GS1, 10 marks] Critically evaluate the various resources of the oceans which can be harnessed to meet the resource crisis in the world.”

  • Small Hydro Power positioned as distinctive in the clean energy transition [MENTION]

    PIB class: Press Release. Ministry: Ministry of New and Renewable Energy.

    Why in News

    The renewable energy ministry stated that Small Hydro Power (SHP) holds a distinctive role in India’s clean energy transition.

    Static Context (the exam value sits here)

    1. Small Hydro Power (SHP) is defined by installed capacity up to 25 megawatts in India. The nodal ministry is the Ministry of New and Renewable Energy (MNRE).
    2. The capacity classes are standardised. Micro is up to 100 kilowatts. Mini is 100 kilowatts to 2 megawatts. Small is 2 to 25 megawatts.
    3. SHP is a run of river resource in most Indian sites. It needs no large reservoir, so its submergence and displacement footprint is small.
    4. SHP counts inside India’s non fossil capacity target. It supports decentralised generation in hill and remote areas.

    Prelims angle

    The 25 megawatt ceiling that defines SHP in India. The nodal ministry MNRE. SHP as a renewable source distinct from large hydro, which the power ministry handles. Run of river design.

    Mains angle

    GS3, infrastructure and energy. Role of decentralised renewable sources in the energy transition and in hill state electrification.

    Matching Previous Year Question

    “[2013, GS3, 5 marks] What do you understand by run of the river hydroelectricity project? How is it different from any other hydroelectricity project?”

  • National Statistical Office releases first ever district level output for the unincorporated non farm sector

    PIB class: Press Release. Ministry: Ministry of Statistics and Programme Implementation.

    Why in News

    The National Statistical Office (NSO) released, for the first time, output estimates for the unincorporated non farm sector at the district level.

    Core facts

    1. What it covers: The unincorporated sector means enterprises that are not registered as companies. It spans manufacturing, trade and other services run as household or proprietary units outside agriculture.
    2. Institution: The National Statistical Office (NSO) sits under the Ministry of Statistics and Programme Implementation (MoSPI). It compiles national accounts and conducts the large sample surveys.
    3. Significance stated in the headline: District level granularity is a new level of disaggregation. Earlier estimates for this sector stopped at the state and national level.
    4. Figures: Release specific counts and values were not verifiable this run and are therefore omitted.

    Static Context

    1. The unincorporated non farm segment is the statistical face of the informal economy. It employs the bulk of the non farm workforce and contributes a large share of jobs outside agriculture.
    2. The survey vehicle is the Annual Survey of Unincorporated Sector Enterprises (ASUSE). It records employment, output and value added for these units. It replaced the earlier periodic enterprise surveys of the erstwhile National Sample Survey Office.
    3. National accounts use these estimates. Value added from the unincorporated sector feeds the Gross Value Added computation for services and unregistered manufacturing.

    Prelims angle

    The parent body NSO and its ministry MoSPI. The distinction between incorporated and unincorporated enterprises. The survey name ASUSE. The place of unincorporated output inside Gross Value Added and Gross Domestic Product.

    Mains angle

    GS3, Indian economy, mobilization of resources, growth and employment. Better informal sector data supports district level planning and targeted formalisation. Frame around measurement gaps in the informal economy and the policy value of disaggregated data.

    Matching Previous Year Question

    No direct PYQ on unincorporated sector statistics was traced in the provided files. Closest tracked Microtheme is the manufacturing and micro, small and medium enterprise economy.

    “[2023, GS3, 10 marks] Faster economic growth requires increased share of the manufacturing sector in GDP, particularly of MSMEs. Comment on the present policies of the Government in this regard.”

  • Bihar flooded despite rainfall deficit; Nepal isn’t the reason

    Why in the News

    Bihar has flooded in a season of deficit rainfall. The State received 601.1 mm of rain between 1 June and 8 September, 27% below normal, and the Disaster Management Department recorded 2,157 villages across 14 districts affected. The Water Resources Minister has said this year’s flood pattern differed from previous years, with the Ganga rising first rather than the rivers that enter Bihar from Nepal. Discharge at the Valmikinagar Barrage on the Gandak stayed below what officials had expected, and the flooding continued anyway. The explanation offered is a backwater effect, so the immediate cause sits downstream in the main river rather than upstream across the border.

    What is a backwater effect?

    1. How a tributary drains: A tributary can discharge into a main river only for as long as the water level in the main river stays below its own.
    2. What happens when the main stem rises: A high stage in the main river holds the tributary’s water back and spreads it across the tributary’s own floodplain, with no additional rain falling there.

    Why did Bihar flood on a rainfall deficit?

    1. The seasonal shortfall: Rainfall from 1 June to 8 September was 601.1 mm, 27% below normal, and the deficit stood at 30% as late as 1 September.
    2. The month ran the other way: Rainfall during September itself was 31% above normal, so the cumulative figure conceals the period when the flooding worsened.
    3. Localised extremes: Individual rain events delivered 214.92 mm in East Champaran and 154.55 mm in Sitamarhi.
    4. The recorded damage: By 9 September the Disaster Management Department reported 2,157 villages in 14 districts affected and about 40.51 lakh people hit.
    5. Seasonal totals are the wrong measure: A flood is produced by the intensity and timing of rain and by upstream discharge, not by the season’s aggregate.

    How was this year’s flood sequence different?

    1. The usual order: The Bagmati, Kamla, Kosi and Gandak, which enter Bihar from Nepal, normally rise first, and the Ganga follows.
    2. What happened instead: The Ganga became the first source of concern this year, which inverted the sequence the State’s flood response is built around.
    3. The catchment is not local: The Ganga’s catchment extends far beyond Bihar, so it carries water generated by rainfall upstream, including in Uttar Pradesh.
    4. The stated drivers: The Disaster Management Department’s Principal Secretary identified rainfall around the Allahabad and Varanasi region and the resulting downstream discharge as important factors, with discharge from neighbouring States a major factor for the other rivers too.

    Why did opening the Valmikinagar Barrage not settle the Gandak?

    1. The gates were opened early: When floods hit Nepal on 26 August, Bihar opened all 36 gates of the Valmikinagar Barrage on the Gandak, which was then below its normal levels.
    2. The peak came in under expectation: Discharge at the barrage reached 1,50,200 cusecs (cubic feet per second, the volume of water passing a point each second) and then declined, below what officials had expected.
    3. Flooding continued regardless: The Gandak and the Punpun could not drain once the Ganga had swelled, which is the backwater effect at work.
    4. A second local input: The Punpun was also carrying heavy rainfall from Jharkhand.
    5. A flood travels: A river flood is a moving event, so a peak recorded at one gauge is transferred downstream and the flooded area is far larger than the area that recorded the heaviest rain.

    What do Bihar’s embankments do, and what do they not do?

    1. The length built: The State has built more than 3,730 km of river embankments.
    2. What they have protected: These structures have historically shielded around 3,600 sq km of land during floods.
    3. The limit of the structure: Embankments do not remove the underlying vulnerability of one of India’s flattest and most sediment heavy alluvial landscapes.
    4. Sediment raises the bed: The Ganga, Gandak, Kosi and Bagmati carry enormous quantities of sediment, and accumulation within a channel lifts the riverbed relative to the land beside it. Silt is a permanent condition of Bihar’s rivers rather than an event.

    Why has the Farakka Barrage entered the flood argument?

    1. The State’s contention: State leaders hold that the Farakka Barrage has trapped large volumes of silt along the Ganga over the five decades since it was built.
    2. The claimed consequence: That accumulation has made the riverbed shallower, so even normal seasonal monsoon flows now spill over the banks and produce annual flooding across the plains.
    3. A treaty deadline gives it timing: The 1996 India Bangladesh Farakka Treaty expires in December 2026, and demands in Bihar are for a review of the pact.

    What in Bihar’s own geography keeps exposure high?

    1. The rivers move: The Ganga, Gandak and Kosi constantly reshape their channels, so the land at risk is not fixed from one year to the next.
    2. People live at the water’s edge: High population density means many communities are settled close to rivers, and a rise in level turns into an evacuation rather than an inconvenience.

    Challenges to Bihar’s flood management

    1. An embankment concentrates risk at its weakest point: A breach releases water at high velocity onto land that the structure had kept dry for decades, so the damage is deeper than an unprotected flood. Eg. The Kosi breach at Kusaha in 2008 shifted the river’s course and displaced over three million people in Bihar.
      The Fix: Hold a pre positioned stock of boulders and geobags at identified weak reaches before each monsoon rather than mobilising material after a breach.
    2. Land behind the line cannot drain itself: An area sealed off from the river also loses the outlet for its own rainfall, so ground protected from flooding turns permanently waterlogged. Eg. Large tracts in the Kosi and Bagmati belts of north Bihar have gone out of cultivation from persistent waterlogging.
      The Fix: Build and maintain sluices and drainage channels through the embankment line with a fixed operating protocol for the monsoon months.
    3. Flood moderation depends on storage that does not exist: Peak attenuation on the Kosi and the Gandak requires reservoirs upstream in Nepal that have never been constructed. Eg. A high dam at Barahkshetra on the Kosi has been under discussion since the 1950s without being built.
      The Fix: Separate real time data sharing and joint forecasting from the dam negotiation, so warning improves without waiting on construction.
    4. Warnings are issued off levels already recorded: Forecasts rest on gauge readings at the moment of the peak, which leaves little lead time on terrain where water spreads sideways for tens of kilometres. Eg. A level based warning gives downstream districts only hours once an upstream gauge has crossed its danger mark.
      The Fix: Build district level inundation forecasts from upstream rainfall and barrage release data rather than from gauge readings alone.

    Conclusion

    Bihar’s flood risk is no longer set mainly by how much rain falls inside the State. It is set by the level of the main river the State has to drain into, and by channels whose beds have risen relative to the land beside them. The unresolved tension is that the structures protecting settled land also hold in the sediment that raises those beds, so each decade of protection shortens the next decade’s margin. What to watch is whether flood planning shifts from adding embankment length to sediment management, drainage behind the line and forecasting built on upstream data.

    Back2Basics: Farakka Barrage

    1. What it is and where: A barrage on the Ganga in Murshidabad district of West Bengal, commissioned in 1975, a short distance upstream of the border with Bangladesh.
    2. Why it was built: It diverts a part of the Ganga’s flow into a feeder canal to the Bhagirathi and Hooghly, to flush silt and maintain navigability for the port of Kolkata.
    3. A barrage, not a dam: It regulates and diverts flow through gates rather than impounding a large storage reservoir behind it.
    4. The water sharing arrangement: An agreement between India and Bangladesh shares the dry season flow measured at the barrage in ten day cycles between 1 January and 31 May.

    Matching Previous Year Question

    “[2024, GS3, 15 marks] What is disaster resilience? How is it determined? Describe various elements of a resilience framework. Also mention the global targets of the Sendai Framework for Disaster Risk Reduction (2015-2030).”

  • Govt. backing ‘ecocide’ by going ahead with Tara coal block auction: Congress

    Why in the News

    The Tara (Revised) coal block in the Hasdeo Aranya region of Chhattisgarh has been auctioned and allocated. The block covers about 5,000 acres, of which over 4,000 acres is dense forest. The auction reverses a settled position on the region: the State Assembly had resolved against further coal allocation there, the State told the Supreme Court that no new mines were needed, and the Union Coal Ministry had denotified the block from the auction process. Local Gram Sabhas have opposed mining in the region for nearly 15 years. The principal Opposition party has described the auction as “ecocide”. The contest is between a commercial coal allocation and both the ecological value of a contiguous forest and the recorded consent position of the communities inside it.

    What does the Tara block auction involve on the ground?

    1. Area and forest share: The block covers about 5,000 acres, of which over 4,000 acres is dense forest in a biodiversity rich ecosystem.
    2. Scale of felling: Working the block would require the clear felling of more than 10 lakh trees.
    3. A renaming, not a redesign: The block was renamed Tara (Revised), which does not materially alter what is being mined or where.
    4. Who won it: The successful bidder is CG Syn Gas and Chemicals Limited, a wholly owned subsidiary of Mundra Synenergy Limited, itself wholly owned by Adani Enterprises Limited.

    Which earlier decisions does the auction reverse?

    1. A unanimous legislative resolution: The Chhattisgarh Assembly resolved unanimously in July 2022 that no further coal blocks should be allocated or auctioned in Hasdeo Aranya.
    2. The State’s position before the Supreme Court: The State government filed an affidavit in July 2023 stating that there was no need to allocate or develop any new mines in the region.
    3. The State’s request to the Centre: The State wrote to the Union Coal Ministry in June 2023 seeking the exclusion of nine coal blocks, including this one, from the auction.
    4. The Centre’s own earlier step: The Union Coal Ministry denotified 40 coal blocks, including this one, from the auction process in October 2023.

    What are the ecological stakes beyond the loss of trees?

    1. An elephant corridor runs through it: Mining around the Lemru Elephant Reserve would disrupt the movement corridor that elephant herds use through the region.
    2. Species at the sharper end: Other species in the same landscape, including critically endangered ones, would be placed at further risk.
    3. Replacement planting is contested: Compensatory afforestation replaces a diverted natural forest with a plantation raised elsewhere, and the objection is that no such planting can substitute for the loss of a contiguous mature forest of this size.

    How have the affected communities recorded their opposition?

    1. A fifteen year record of refusal: Adivasi and other local communities have opposed mining in Hasdeo Aranya for close to 15 years.
    2. The formal route used: Opposition has been recorded through Gram Sabha resolutions, the village assembly decisions that the forest diversion process is required to consider.
    3. Beyond the paperwork: The same communities have run public campaigns, sit ins and protest marches, including in Raipur.

    Challenges to auctioning coal blocks under dense forest

    1. The bid parameter does not price the forest: A commercial coal block is won on the revenue share offered to the State, so a block under dense forest competes on the same financial terms as one under farmland. Eg. Commercial auctions are decided on the percentage of revenue a bidder offers, with no ecological weighting in the bid.
      The Fix: Make a graded forest quality threshold a qualifying condition, so blocks above it never enter the auction list.
    2. Allocation happens before clearance is decided: A block is sold before forest and environmental clearance is settled, which converts a later refusal into the cancellation of an existing commercial commitment. Eg. The Parsa East and Kete Basan blocks in the same forest received clearance only after allocation and years of litigation.
      The Fix: Complete the forest diversion decision for a block before it is offered, so the auction follows the environmental appraisal rather than preceding it.
    3. Recorded consent is weakly verified: Consent is captured as a Gram Sabha resolution at the diversion stage, and a refusal has repeatedly been overridden or replaced by a fresh resolution. Eg. Gram Sabhas in Hasdeo Aranya alleged in 2022 that consent recorded for a neighbouring block had been forged.
      The Fix: Require independent verification of every consent resolution and publication of the minutes before diversion is recommended.
    4. Impact is appraised one block at a time: Each clearance assesses a single block, so the combined effect of several mines inside one contiguous forest is never evaluated as a whole. Eg. Hasdeo Aranya holds multiple allocated coal blocks within a single forest stretch and a shared river catchment.
      The Fix: Require a cumulative impact assessment for the entire coalfield before any further block inside it is auctioned.

    Conclusion

    The block has been allocated, and the operative decisions now move to the forest diversion and clearance stage, where the State and the Centre must each take a position again. The unresolved tension is that a legislature and a State executive have recorded one view of the region. The auction machinery has proceeded on another, with no mechanism that reconciles the two. What to watch is whether the recorded refusals are treated as binding inputs at the diversion stage, and whether the dispute returns to court before mining begins.

    Back2Basics: Elephant Reserves

    1. What the designation is: An elephant reserve is an area declared by a State government to protect elephant populations and the corridors between their habitats.
    2. The programme behind it: Reserves are declared under Project Elephant, launched by the Union environment ministry in 1992 to support elephant range States.
    3. Its legal weight: The designation is administrative, and it carries none of the statutory bar on land use that applies inside a national park or wildlife sanctuary.
    4. The species status: The Asian elephant is listed as Endangered on the IUCN Red List and in Schedule I of the Wild Life (Protection) Act, 1972.

    Matching Previous Year Question

    “[2025, GS3, 15 marks] Mineral resources are fundamental to the country economy and these are exploited by mining. Why is mining considered an environmental hazard? Explain the remedial measures required to reduce the environmental hazard due to mining.”

  • Why India must rethink the way it values skills, jobs and productive work

    Why in the News

    India has become the world’s fourth largest economy and is treated as the next engine of global growth. The assessment now placed against that record is that the country is drifting toward the middle income trap, where an economy exhausts its gains from cheap labour and rapid catch up and fails to move to productivity led growth. Weak job creation, stagnant wages, sluggish private investment and low productivity are named as reinforcing one another. Youth protests across the country are read as the visible sign of that distress. The two standard explanations, another round of market reform and a larger public spending push, both treat this as a supply or a demand problem. The argument placed against both is that the binding constraint is institutional, meaning social norms that decide how the market prices skills and how the State allocates resources.

    Why do the standard explanations of the slowdown fall short?

    1. The pro market reading: Economists trained in market orthodoxy call for a second round of reform on the scale of 1991, covering labour flexibility, agricultural reform, deregulation and infrastructure investment.
    2. The Keynesian reading: Economists in the Keynesian tradition locate the problem in weak aggregate demand and prescribe higher public spending, redistribution and social protection.
    3. What both miss: Each treats the constraint as one of supply or of demand. Institutions shaped by social norms decide both how markets set incentives and prices and how the State allocates resources and supplies public goods.

    What does the present pattern of growth look like?

    1. Jobless growth: Productivity gains stay concentrated in narrow capital intensive and skill intensive enclaves that generate little employment.
    2. Weak domestic demand: Private investment remains sluggish, wage growth is stagnant and household consumption is weak.
    3. Manufacturing has not absorbed labour: The sector has failed to generate enough jobs for the workforce moving out of agriculture.
    4. An uneven recovery: Growth after the pandemic favoured large corporations and the digital economy and left the informal sector barely touched.
    5. Inequality and low productivity together: Rising inequality alongside low productivity is the specific combination that makes the trap dangerous, since neither corrects the other.

    How do social norms distort what the market and the State each do?

    1. Competitiveness through cost cutting: Private capital, freer from regulation than at any earlier point, competes by cutting costs rather than by innovating.
    2. Knowledge does not travel: Firms have failed to absorb the knowledge that arrives with foreign direct investment (FDI). Productivity has risen neither through movement between sectors nor through innovation inside them.
    3. Capital is priced below labour: Heavy subsidy to capital lowers its price relative to labour in an economy with surplus labour, which pushes firms toward machines over workers.
    4. Innovation is thin: Research and development spending stands at 0.65% of GDP, and technology adoption remains weak rather than spontaneous.
    5. State capacity is low despite size: Government has grown in size, and the ability to deliver basic services such as health centres and schooling remains among the lowest anywhere.
    6. Spending is tilted toward the privileged: Mass education has been historically underfunded. Higher education for elites was subsidised.
    7. The elite bias carried into the growth pattern: That same bias produced service sector heavy growth after the reforms, letting upper castes monopolise better occupations and relegating low productivity work to others.

    What does India’s vocational training record show?

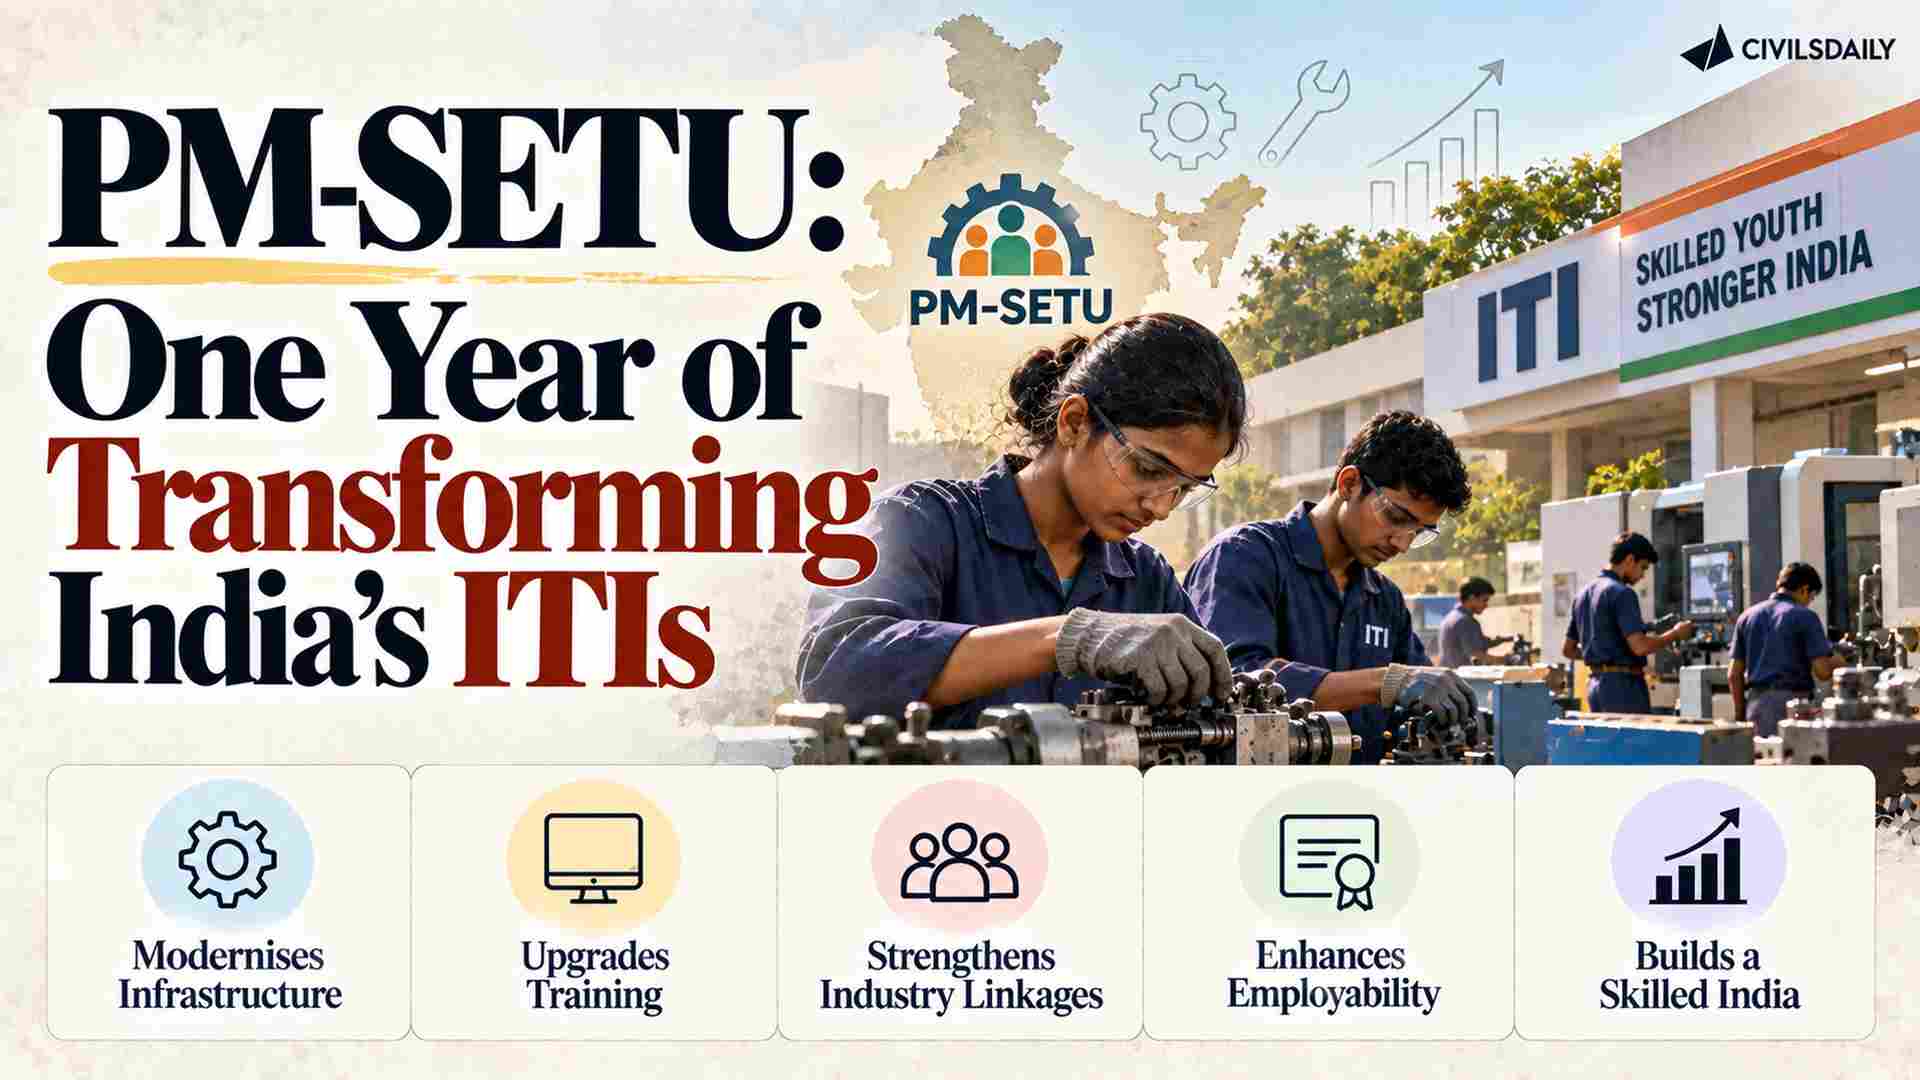
    1. Almost no formal skilling: Fewer than 3% of the workforce has any formal vocational education.
    2. Seats go unfilled: Roughly 14,000 Industrial Training Institutes (ITI) offer about 25 lakh seats, and actual intake is only about 48%.
    3. Placement is weak even for those who finish: The employment rate among graduates is 63%, against over 90% in many other countries.
    4. The system is badly run: Vocational training remains poorly managed and chronically underfunded, which follows from the long neglect of mass education.

    Why does the social valuation of skills decide productivity?

    1. Useful knowledge drives modern growth: Sustained growth rests on the coevolution of science, technology and the spread of “useful knowledge”, meaning the practical skills that let a society innovate, adapt and raise productivity. Eg. The economic historian Joel Mokyr, a Nobel laureate in economics, treats the diffusion of such knowledge as the taproot of entrepreneurial success.
    2. India privileged the abstract: University degrees command prestige. Courses training electricians, welders, machinists and carpenters do not.
    3. The hierarchy has a source: That ranking reflects centuries of caste based occupational stratification in which manual and artisanal work was systematically undervalued despite its role in industrial development.
    4. The visible result: Skilled manufacturing workers are chronically short even as millions of educated young people fail to find decent work.
    5. Valuation shapes choices before markets do: Social premiums attached to some occupations, visible in the marriage market, shape educational choices and occupational aspirations and therefore the allocation of labour.
    6. Official advice runs against the norm: The Chief Economic Adviser has urged young people to take up trades such as welding and plumbing rather than software jobs or management degrees.
    7. Labour intensity is falling: Data show a persistent decline in the labour intensity of production technology across sectors, including traditionally labour intensive ones, and artificial intelligence is expected to accelerate the trend.

    What separates the countries that escaped the trap from those that did not?

    1. South Korea: Escape came from building institutions capable of creating and diffusing useful knowledge across domains, not from building factories alone.
    2. China: Early state led industrialisation was paired with large investment in technical education, local manufacturing capability and technological learning, and earlier interventions in education and health laid the productive base.
    3. Brazil, Argentina, Thailand and the Philippines: All four failed to build or sustain such institutions and remain stuck in the middle income trap.
    4. The shared symptom of failure: In those four, as in India, large sections of the population depend on public transfers and handouts for the basic requirements of a decent living.

    What does productivism propose instead?

    1. The core shift: Productivism, proposed by the economist Dani Rodrik, moves policy attention from redistribution after the fact to the creation of productive employment.
    2. Where it parts from market orthodoxy: It gives government a leading role over markets in shaping economic opportunity rather than leaving that to prices alone.
    3. Its stated priorities: It places the real economy above finance, jobs above redistribution and production above consumption.
    4. Dignity as an economic output: An inclusive economy on this reading gives people social recognition as productive members of society, which requires changing the norms underpinning institutions rather than only the policy framework.

    Challenges to escaping the middle income trap

    1. Industrial policy without skilled labour stalls: Incentives for manufacturing cannot be used if the plants receiving them cannot staff skilled lines. Eg. Electronics units in India remain concentrated in final assembly rather than component fabrication.
      The Fix: Tie incentive disbursement to verified apprenticeship and skilling numbers at the receiving plant.
    2. Training is disconnected from employers: Curricula and equipment in public training institutes lag the technology used on the shop floor, so a certificate does not signal usable skill. Eg. Many public institutes still train on machine tools several generations behind those in contract manufacturing plants.
      The Fix: Give industry associations a decisive voice in course content and equipment upgrades at each institute, with annual revision.
    3. Skilling is measured as enrolment, not as employment: Targets reward seats filled and certificates issued rather than wages earned afterwards. Eg. Short duration certification under national skilling programmes has repeatedly recorded low conversion into formal jobs.
      The Fix: Shift reporting to wage outcomes after training, tracked through provident fund records.
    4. Cheap capital keeps displacing labour: Accelerated depreciation, concessional credit and duty exemptions lower the effective price of machinery against workers, so firms automate ahead of demand. Eg. Garment units have moved to automated cutting and spreading, with employment in the sector staying flat.
      The Fix: Rebalance the incentive structure toward employment linked support rather than capital linked support.
    5. State capacity limits the very services the strategy needs: Schooling and primary health are the inputs into a productive workforce and are delivered most thinly where they are needed most. Eg. Teacher and doctor vacancies persist across the districts with the youngest populations.
      The Fix: Fill sanctioned posts in the lowest performing districts first rather than distributing recruitment evenly.

    Conclusion

    The diagnosis places the binding constraint outside the familiar argument about how much the State should spend and how far markets should be freed. What follows from it is that a skilling target or a manufacturing incentive will not move productivity for as long as the social ranking of occupations stays where it is. The difficulty is that a norm of that kind is not amenable to a budget line or a notification. Whether policy can change the standing of skilled manual work, and not only its supply, is what decides where the economy settles.

    Back2Basics: Industrial Training Institutes

    1. What they are: Post school vocational institutions that train candidates in designated trades such as fitter, electrician, welder and machinist.
    2. Who runs them: They function under the Directorate General of Training in the Ministry of Skill Development and Entrepreneurship, and are set up by State governments and by private promoters.
    3. The qualification awarded: Trainees who clear the All India Trade Test receive the National Trade Certificate.
    4. Statutory anchor: Trade training and apprenticeship in these institutes operate within the framework of the Apprentices Act, 1961.

    Matching Previous Year Question

    “[2022, GS3, 15 marks] “Economic growth in the recent past has been led by increase in labour productivity.”Explain this statement. Suggest the growth pattern that will lead to creation of more jobs without compromising labour productivity.”

  • Elephant in the room in meetings with Xi, Putin: India’s manufacturing challenges

    Why in the News

    India’s manufacturing base, and not its diplomacy, is the binding constraint on the economic agenda of this weekend’s BRICS summit in New Delhi. The Prime Minister meets the Russian President ahead of the summit and the Chinese President over the weekend, and the consequential part of both conversations is bilateral and economic. India’s difficulty in each case is not the size of its trade deficit. It is the narrowness of what India is able to sell.

    What does the trade profile with Russia reveal about what India can sell?

    1. Exports are a fraction of imports: India’s exports to Russia remain below $5 billion against imports of $63.8 billion in the year to March 2025.
    2. The gap and its composition: The deficit is nearly $59 billion, and Russian oil and other natural resources dominate what India buys.
    3. The market is not the limitation: Russia is a substantial market for manufactured goods, so the shortfall lies on the supply side.
    4. Industrial promotion is under way: The first India Russia international industrial trade fair was held in Delhi this week, and both leaders are to visit it.

    What does China’s export record to Russia show about the size of the gap?

    1. The scale of the comparison: China exported about $103 billion of goods to Russia in 2025.
    2. The composition is the real point: Those exports run from cars and machinery to electronics and industrial equipment, which are exactly the categories India cannot supply at comparable scale.

    How does the same weakness appear in the trade with China?

    1. A larger deficit on a larger base: Bilateral trade reached about $151 billion in the year to March 2026, and India’s deficit rose to roughly $112 billion.
    2. The asymmetry is reversed: China sells manufactured goods, and increasingly the intermediate and capital goods that Indian manufacturers themselves need.
    3. The policy response so far: Delhi is responding to Beijing’s demand that India end its restrictions on commerce with China.

    Why does the goal of economic security collide with what Indian industry needs?

    1. Chinese inputs are embedded in Indian production: They run through electronics, machinery, chemicals, auto components and pharmaceutical inputs, and they feed India’s own exports of manufactured goods.
    2. The two objectives pull apart: The political aim of cutting dependence runs against the commercial need for cheap and increasingly sophisticated inputs at scale.
    3. One weakness, two symptoms: Limited manufacturing strength shows up as an inability to export to a large market in one relationship, and as import dependence in the other.

    Can diplomacy compensate for weak manufacturing?

    1. What negotiation can actually deliver: Payment mechanisms, investment targets and trade agreements are all negotiable, and political warmth cannot substitute for competitive products.
    2. The older ambition against the present agenda: India’s call to democratise the global economic order dates to the Cold War years. The immediate bilateral ask is that Russia and China buy more, invest more and help build Indian productive capacity.
    3. What closing the gap requires: Sustained economic reform, simpler regulation, greater competitiveness, less corruption, deeper domestic supply chains and a stronger manufacturing ecosystem.
    4. Investment follows attractiveness, not persuasion: The world is not short of capital or technology, and India is not near the top of the destinations they go to.
    5. Why the bilateral overshadows the multilateral: BRICS, like the Shanghai Cooperation Organisation (SCO), has become a venue for high level political engagement and bilateral problem solving.

    Challenges to widening India’s manufacturing base

    1. Firms stay small, and stay small for long: A size distribution dominated by tiny units leaves few producers able to take on a large export order. Eg. Most registered manufacturing units in India employ fewer than ten workers.
      The Fix: Make support conditional on growth in employment and turnover rather than on staying below a small unit threshold.
    2. Duties on inputs tax the exporter: Tariffs on intermediate goods raise the cost of the components a finished goods exporter has to buy. Eg. Duties on electronic components have been cut in successive Budgets precisely because they raised assembly costs.
      The Fix: Move to a single low duty band on intermediate and capital goods, and reserve protection for finished goods alone.
    3. Logistics cost eats the margin: Dependence on road freight and long dwell time at ports raise the delivered price of Indian goods. Eg. The National Logistics Policy of 2022 was framed around bringing logistics cost as a share of output closer to competitor levels.
      The Fix: Tie port and freight corridor funding to published turnaround and transit time targets.
    4. Assembly has grown faster than component making: Incentives have drawn in final assembly without a domestic base in parts, so import content stays high. Eg. Mobile phone exports have risen sharply, with display panels and battery cells still largely imported.
      The Fix: Condition incentive payouts on a rising schedule of domestic value addition rather than on output value alone.

    Conclusion

    The agenda for this week is bilateral, and the constraint on it is domestic. Persuasion can open a market, and it cannot supply the goods that would fill one. What India’s economic diplomacy is worth therefore turns on decisions taken by its own economic policymakers rather than on commitments extracted from partners. The test worth watching is whether the industrial reform agenda moves at all once the summit season ends.

    Matching Previous Year Question

    “[2025, GS3, 15 marks] Discuss the rationale of the Production Linked Incentive (PLI) scheme. What are its achievements? In what way can the functioning and outcomes of the scheme be improved?”

  • At 78%, Telangana district Nirmal on top in women’s share in informal workers

    Why in the News

    The Ministry of Statistics and Programme Implementation (MoSPI) has released the first district level estimates of India’s informal sector drawn from a large scale national survey. They come from the Annual Survey of Unincorporated Sector Enterprises (ASUSE) of 2025, which covers enterprises outside the corporate sector and outside agriculture. Women are 78% of all informal workers in Nirmal district of northern Telangana, the highest share recorded for any district. Female participation in informal work turns out to vary far more between districts than any national figure suggests. The districts where women dominate this workforce are also among the lowest paying, which is the tension the new granularity exposes.

    What does the Annual Survey of Unincorporated Sector Enterprises cover?

    1. The universe surveyed: It covers unincorporated establishments in manufacturing, trade and other services, which is the part of the economy usually described as the informal sector.
    2. What it leaves out: Agriculture is outside its scope, as are enterprises incorporated as companies.
    3. Coverage of this round: The report carries estimates for 757 districts.
    4. A caveat on district identity: MoSPI notes that the districts covered may not match the present administrative map, because boundaries, names and new districts have changed since.

    How wide is the spread between districts?

    1. The national benchmark: Across India women are 29% of informal workers.
    2. The bottom of the list: In Rudraprayag in Uttarakhand women are 6.7% of informal workers.
    3. A state boundary makes the difference: Nanded in Maharashtra, immediately across the border from the top ranked district, sits 288th with women at 31%.

    What regional pattern do the district numbers reveal?

    1. The top ten are regionally clustered: All ten districts with the highest female share lie in south India or the north east, in Telangana, Manipur, Meghalaya and Mizoram.
    2. Parity is rare: Women are at least half the informal workforce in only 25 districts, 22 of them in the south or the north east, with three in the east including Pakur in Jharkhand and Deogarh in Odisha.
    3. A third is a wider club: Women account for at least 33% of the informal workforce in 237 districts.

    Does a high female share come with better pay?

    1. The best payer among high share districts is modest: South West Khasi Hills in Meghalaya pays Rs 1.7 lakh per hired worker, about 35% above the national average of around Rs 1.3 lakh.
    2. The top paying district has few women: Dehradun pays Rs 4.6 lakh per hired worker, and women are 19% of its informal workforce.
    3. The pattern that follows: High female participation coincides with low earnings per worker rather than with better paid work.

    What do the ownership and concentration numbers add?

    1. Participation tracks ownership: Districts with the greatest female participation also carry the highest share of female owned proprietary establishments, and the leading district reaches almost 80% on that measure.
    2. Scale sits elsewhere: North 24 Parganas in West Bengal has the most informal workers, at 21.3 lakh, and the most establishments, at 16.6 lakh.
    3. Output is concentrated: The ten districts with the most establishments account for around 11% of total Gross Value Added (the value of output less the cost of inputs bought in, which is how a sector’s contribution is measured), and the top fifty for almost a third of it.
    4. The stated purpose of the release: MoSPI’s position is that the diversity of activity and local conditions makes granular statistics necessary for evidence based policymaking.

    Challenges to district level informal sector measurement

    1. Boundary churn breaks comparability: A district measured once cannot be tracked over time once it is split, merged or renamed before the next round. Eg. Telangana raised its district count from 10 to 33 in 2016.
      The Fix: Publish every round against a frozen reference map alongside the current one, so a district series survives reorganisation.
    2. Excluding agriculture removes most rural informal work: The survey frame leaves out the sector that still employs the largest number of informal workers. Eg. Agriculture remains the single largest employer in the Periodic Labour Force Survey’s distribution of workers.
      The Fix: Release the unincorporated estimates together with the labour force survey’s agricultural numbers as one district profile.
    3. A high female share can record distress rather than progress: Unpaid family labour and home based piece work enter the count as participation with no wage attached to it. Eg. Beedi rolling and garment stitching in home units are recorded as enterprise work paid at piece rates.
      The Fix: Report unpaid family helpers separately from hired workers for every district.
    4. Enterprise surveys miss the smallest and most mobile units: Vendors and units without fixed premises are hard to list, so they are undercounted at source. Eg. The survey and registration of street vendors required by the Street Vendors Act, 2014 remains incomplete in many towns.
      The Fix: Use municipal vending registers and welfare board rolls as a supplementary listing frame for mobile units.

    Conclusion

    The release turns a state level statistic into a district one, and that changes what an administrator can act on. The pattern it exposes is that where women work most in the informal economy, that work pays least, which is a question about the kind of enterprise available locally rather than about willingness to work. The milestone to watch is whether these estimates are repeated on the same frame, because a single snapshot cannot show whether participation and earnings are moving together or apart.

    Back2Basics: MoSPI and the National Sample Survey

    1. The ministry: MoSPI is the nodal body for India’s official statistical system and releases the national income and price statistics.
    2. The survey arm: The National Statistical Office conducts large sample surveys through the National Sample Survey, which began in 1950.
    3. The companion employment survey: The Periodic Labour Force Survey supplies employment and unemployment estimates, and it counts workers rather than enterprises.
    4. The advisory body: The National Statistical Commission, set up in 2005 on the Rangarajan Commission’s recommendation, advises on statistical priorities and standards.

    Matching Previous Year Question

    “[2023, GS3, 15 marks] Most of the unemployment in India is structural in nature. Examine the methodology adopted to compute unemployment in the country and suggest improvements.”

  • FCNR(B) deposits: Understanding who finally bears the foreign exchange risk

    Why in the News

    The Reserve Bank of India (RBI) opened a special swap facility in June to draw money from non resident Indians into FCNR(B) deposits. The full name is Foreign Currency Non Resident (Bank), and such a deposit is held and repaid in foreign currency rather than in rupees. The step answered pressure on the rupee from high oil prices and an aim of building up foreign exchange reserves. The facility protects banks against exchange rate loss on the principal. It does not cover the interest, which is owed in dollars and has to be arranged by the banks themselves. That split is what decides who finally carries the currency risk.

    What is an FCNR(B) deposit and what did the special swap facility offer?

    1. A deposit denominated in foreign currency: A non resident places dollars or another permitted currency with an Indian bank, and the bank repays in that same currency, so the depositor carries no rupee risk.
    2. The term of the money: These deposits typically run for three to five years, which is when the principal and the accumulated interest fall due.
    3. What the swap added: The bank passes the foreign currency to the central bank for rupees and receives a commitment to reverse the exchange at an agreed rate on maturity.
    4. The window is shut: Fresh deposits under the facility stopped on 31 August 2026.

    Why was the window opened, and what did it actually raise?

    1. The response overshot the target: Banks mobilised more than $127 billion through these deposits against an initial target of about $50 billion.
    2. Funding turned cheap: The scheme gave banks foreign currency at a lower cost than borrowing abroad on their own credit would have carried.
    3. Reserves rose with it: The foreign currency handed to the central bank added substantially to India’s reserve stock.

    What does protecting the principal cost the central bank?

    1. The hedging bill sits with the central bank: It bears the cost of covering the currency exposure on the principal, put at up to 3% a year by BofA Securities Research and taken at about 3% a year by SBI Research.
    2. The annual and cumulative numbers: On an assumed mobilisation of $65 billion to $70 billion at that rate, SBI Research calculated a notional cost of about $2.1 billion a year and about $10.5 billion over five years.
    3. Measured against the reserve stock: Against reserves of around $700 billion, the five year cost works out to 1.45% of the stock.

    What offsets that cost?

    1. The reserves themselves earn a return: BofA Securities Research estimated a yield of around 4.5% to 5% on the reserves generated, enough to more than cover the hedging cost across a five year holding.
    2. Placement is chosen for yield: Part of the money may be invested in United States government securities because those yields are higher.
    3. Part of the outgo is already recovered: SBI Research said the central bank had rebuilt $31.2 billion of its foreign currency assets by 7 August 2026, equal to 55% of the amount mobilised to that point.

    Why have most banks left the interest leg unhedged?

    1. The swap stops at the principal: Banks have to source the dollars for interest payments and manage that exposure on their own books.
    2. The split runs by ownership type: Foreign banks are largely hedging this exposure. Most state run banks and several private sector Indian lenders have left it open.
    3. Cost is the stated reason: Bankers cite the price of cover on a three to five year exposure, which is of the same order as the cost the central bank carries on the principal.
    4. The payment timing invites the gamble: Interest on these deposits is paid only at maturity, so some banks plan to buy dollars in the spot market when the payment actually falls due.

    What happens to an unhedged bank if the rupee weakens?

    1. The arithmetic of one payment: Interest of $1 million costs Rs 9.5 crore at Rs 95 to the dollar, and Rs 10 crore if the dollar reaches Rs 100 at maturity.
    2. Cover decides who absorbs it: A hedged bank is protected against that movement, and a lender that left the exposure open bears the higher rupee cost.
    3. The risk is correlated across lenders: A sharp fall in the rupee would push many banks to buy dollars at the same time, adding to dollar demand and to pressure on the currency.
    4. The exposure has not gone away: The scheme moved currency risk between parties rather than removing it from the system.

    Challenges to the FCNR(B) swap route to reserve building

    1. Reserves built this way are borrowed reserves: Non resident deposits count within India’s external debt, so the reserve stock rises with a matching liability against it. Eg. Non resident deposits are among the largest components in the Finance Ministry’s quarterly external debt statement.
      The Fix: Publish the debt creating share of any reserve addition alongside the headline reserve figure.
    2. Maturities bunch at one point in time: A window opened over a single quarter falls due over a single quarter, which concentrates the outflow. Eg. The concessional swap window of 2013 raised about $34 billion and came up for redemption together in late 2016.
      The Fix: Stagger the maturities permitted under a window across quarters rather than letting the market settle on one tenor.
    3. The open exposure sits with the thinnest buffers: Public sector lenders hold less capital against a valuation loss than the foreign banks that are covering the same risk. Eg. Several public sector banks required recapitalisation from the Union Budget through the second half of the 2010s.
      The Fix: Set a supervisory ceiling on the share of foreign currency interest liability a bank may leave uncovered.
    4. The facility substitutes for adjustment: Attracting deposits to steady the currency postpones the correction that a persistent current account gap eventually forces. Eg. The rupee continued to depreciate through the years after the 2013 defence of the currency ended.
      The Fix: Tie any such window to a stated reserve adequacy target, so it closes as a one time step instead of becoming a standing instrument.

    Conclusion

    The swap changed the address of the currency risk without retiring it. The central bank now holds an exposure that depositors were unwilling to take, and lenders hold the portion the central bank declined. Whether that is prudent rests on a rupee path nobody can commit to. The supervisory question to watch is whether banks will be required to cover the foreign currency leg they have chosen to leave open.

    Back2Basics: Non resident deposit accounts

    1. NRE account: A Non Resident External account is held in rupees, and both principal and interest are freely repatriable.
    2. NRO account: A Non Resident Ordinary account is held in rupees for income earned in India, and repatriation out of it is capped.
    3. Where the currency risk sits: In a rupee denominated non resident account the depositor bears the exchange risk, which is the reverse of a foreign currency denominated account.

    Matching Previous Year Question

    “[2019] Consider the following statements: 1. Most of India’s external debt is owed by governmental entities. 2. All of India’s external debt is denominated in US dollars. Which of the statements given above is / are correct? (a) 1 only (b) 2 only (c) Both 1 and 2 (d) Neither 1 nor 2 ANSWER: (d)”