| Question (2017, GS3): ““Industrial growth rate has lagged behind in the overall growth of Gross-Domestic-Product (GDP) in the post-reform period” Give reasons. How far the recent changes is Industrial Policy are capable of increasing the industrial growth rate? Linkage: The easing of the Manufacturing PMI to its lowest level since August 2021 due to weak domestic demand is a classic real-time symptom of industrial growth lagging behind overall economic expansion. It forces candidates to examine why Indian manufacturing struggles to maintain sustained momentum. |
Mentor Comment
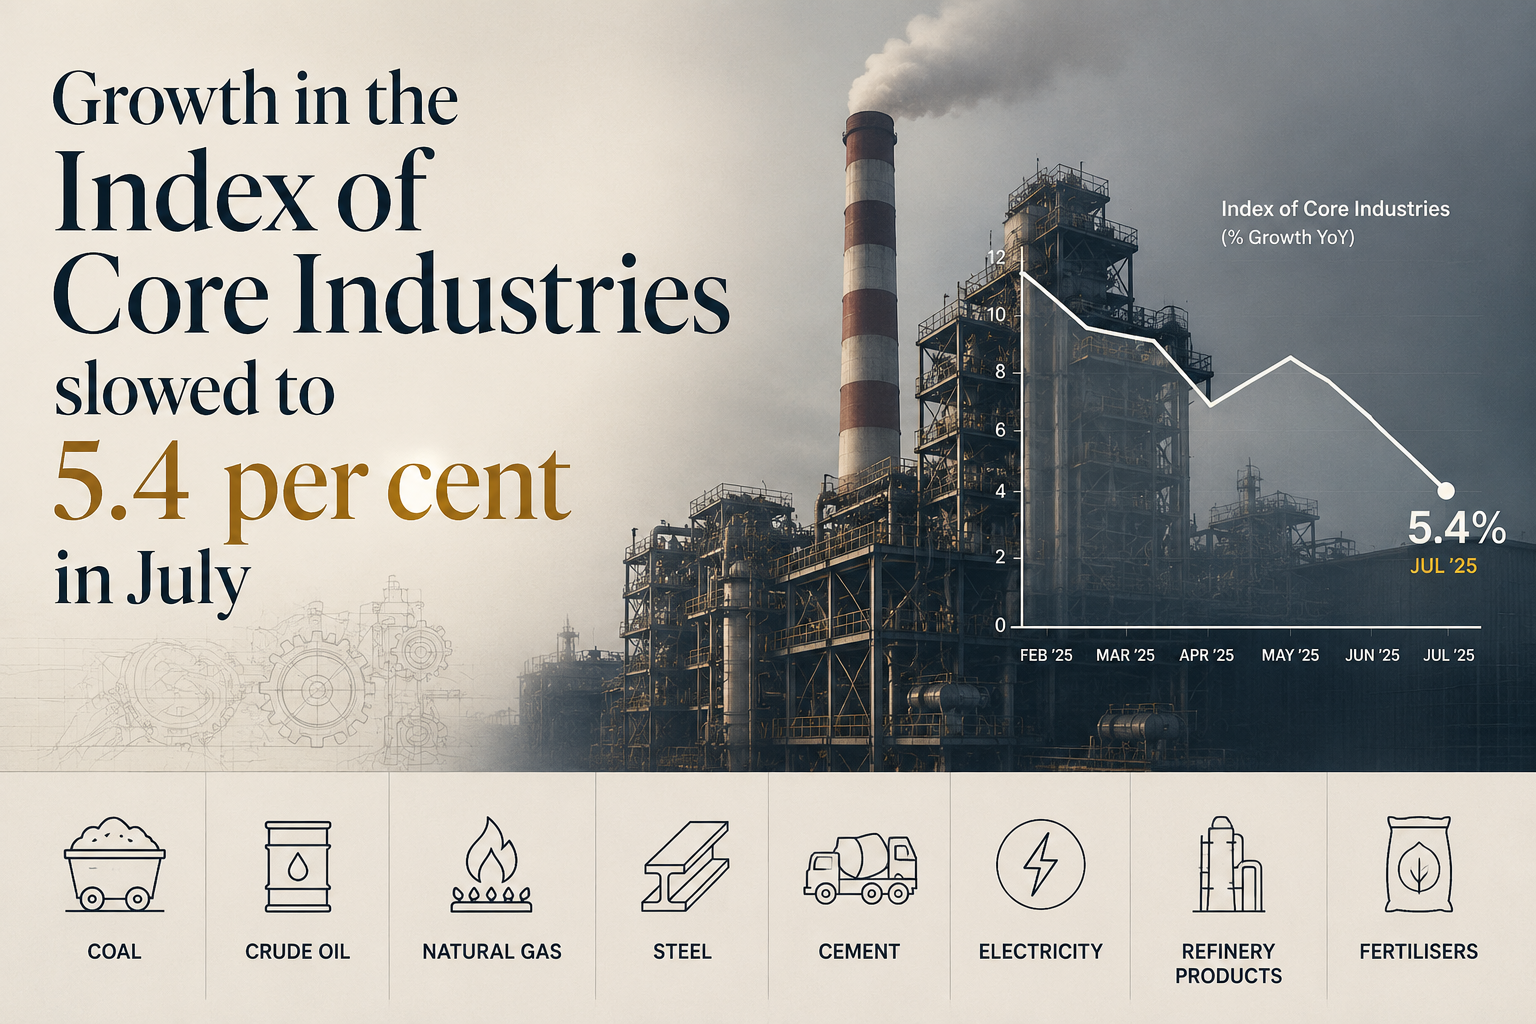
Growth in the Index of Core Industries slowed to 5.4 per cent in July from 6 per cent in the previous month. The Manufacturing Purchasing Managers’ Index eased in the same month to its lowest level since August 2021, on weak domestic demand conditions. July’s core sector growth was still the second highest rate in the last seven months. The tension sits between that headline and its composition: a large part of the growth rests on a statistical low base effect, the two genuinely strong sectors are cement and electricity, and the domestic crude oil and natural gas sectors have contracted continuously for at least the last 14 months.
What is the Index of Core Industries?
- What it measures: The Index of Core Industries measures the combined production of the country’s core infrastructure industries, covering coal, crude oil, natural gas, refinery products, fertilisers, steel, cement and electricity.
- Why it is watched: These industries carried a combined weight of about 40 per cent in the Index of Industrial Production, so the core index acts as an early read on industrial output before the fuller index is released.
- Current series: The index is compiled on a revised new series, for which comparable data currently extends back only about 14 months.
Why is the July core sector number weaker than it looks?
- Growth rests on a low base: A large part of even this slower growth is based on a statistical low base effect, where a contraction in the corresponding month of the previous year makes the current month’s output look like expansion.
- Coal illustrates the effect: The coal sector grew at an 11 month high of 7.6 per cent in July. That was measured against a contraction of 12.3 per cent in July of last year.
- Refinery products repeat the pattern: The refinery products sector snapped a three month streak of contraction to grow at 2.7 per cent. This too was measured against a contraction in July 2025.
- Iron ore’s strength is partly base driven: The iron ore sector grew at 29.5 per cent, slower than 44.5 per cent in June. Its comparison base is contractions of 16.4 per cent in June and 7.1 per cent in July of last year.
- The headline flatters the trend: A rate that is second highest in seven months coexists with an easing demand signal, which means the ranking of the number matters less than what produced it.
Which sectors are carrying the index and which are dragging it?
- Steel has slowed sharply: The steel sector decelerated to 2.9 per cent in July from 5.6 per cent in June and 15.7 per cent in July of last year. This is a genuine slowdown rather than a base effect.
- Hydrocarbons are a standing drag: The domestic crude oil and natural gas sectors have contracted continuously for at least the last 14 months for which the new series has data.
- Electricity remains strong but is decelerating: The electricity sector grew at 9 per cent in July. That was slower than two consecutive months of double digit growth in May and June, which were lifted by prevalent heatwave conditions in many parts of the country.
- Cement accelerated: The cement sector sped up to 13.1 per cent, the clearest genuine acceleration in the index.
- The bright spots are only two: Within the core index, cement and electricity were the only two sectors reading as bright spots, and such positive trends were few and far between.
Does the core sector number describe output or demand?
- The two indicators point in opposite directions: The core index recorded its second highest growth in seven months in the same month that the Manufacturing Purchasing Managers’ Index fell to its lowest since August 2021.
- They measure different things: The core index counts physical production in a set of infrastructure industries. The Manufacturing Purchasing Managers’ Index records what purchasing managers report about new orders and demand conditions.
- A base effect can mask a contraction: A sector recovering from a deep fall registers a high growth rate at a low level of output, so a rate can rise even as demand conditions ease.
- Weather and construction are not demand: The strongest readings came from electricity, lifted by heatwave conditions, and from cement, which tracks construction activity rather than broad consumer demand.
- The forward reading is slack: Easing demand conditions were already being predicted by other indicators before the core sector data appeared, so the July slowdown was not a surprise.
How is energy import dependence turning into a cost shock?
- Import volumes are rising: India’s crude oil imports rose 13.3 per cent in volume terms in July. Liquefied Natural Gas (LNG) imports grew a more marginal 1.5 per cent.
- Domestic supply is not filling the gap: Against the falling domestic base noted above, the economy’s appetite is being met from abroad rather than from home production.
- The bill has jumped: High oil prices meant the crude oil import bill jumped 41 per cent in July, so a 13.3 per cent volume rise translated into a far larger payment outgo.
- A tariff shock is queued behind it: The 100 per cent tariffs the United States is preparing to levy on countries such as India that import Russian oil will once again burden Indian exporters.
- Blending has not yet displaced imports: Moving to 20 per cent ethanol blending has not yet impacted oil imports materially, so the substitution effect is not visible in the July numbers.
Challenges to the Index of Core Industries as a growth signal
- Base effects distort the headline rate: A contraction in the year ago month converts a modest recovery into a high growth print, which misleads on the level of output. Eg. Coal’s 11 month high of 7.6 per cent in July sat on a 12.3 per cent contraction in July of the previous year. Fix. Publish index levels and two year compound rates alongside the year on year rate in every release.
- Coverage is narrow: The index tracks a small set of infrastructure industries and therefore misses most of the economy’s output. Eg. Services contribute over half of Gross Value Added and are entirely outside the core index. Fix. Publish the core index alongside a high frequency services activity indicator so the composite reading is visible.
- Weights favour public sector heavy industries: The largest weights sit in sectors dominated by public enterprises and administered pricing, so the index responds to policy decisions as much as to market demand. Eg. Refinery products and electricity output move with administered allocation and tariff decisions. Fix. Rebase and reweight the index on a fixed cycle with published sensitivity of the headline to each sector’s weight.
- Informal and small firm output is invisible: Production by micro and small enterprises is not captured, so a squeeze concentrated there does not register. Eg. Of about 64 million micro, small and medium enterprises, only around 14 per cent have access to formal credit and most stay outside statistical registers. Fix. Link the index to Goods and Services Tax e-way bill and electronic invoice data to capture small firm activity.
- Provisional data is heavily revised: Early estimates are released on partial returns and are revised in later months, so a policy read taken on the first print can reverse. Eg. Iron ore’s July reading of 29.5 per cent followed a June figure of 44.5 per cent, a swing large enough to change the quarterly picture on revision. Fix. Publish a standing revision history for each sector so the reliability of the first print is visible.
- It reads supply, not demand: The index counts what was produced, not what was bought, so it can rise while orders fall. Eg. July’s core growth of 5.4 per cent coincided with the Manufacturing Purchasing Managers’ Index at its weakest since August 2021. Fix. Present the core index and the demand side survey indicators in a single monthly dashboard rather than as separate releases.
Conclusion
The Indian economy looks set for a period of slack demand, higher costs and moderating growth. The July core sector reading does not contradict that: a large part of its growth is base driven, only cement and electricity grew genuinely strongly, and the sectoral spread set out above is narrow. The cost side is worsening independently, on the import bill and the tariff exposure already recorded. Whether the next few months show a genuine industrial recovery depends on domestic demand rather than on the base against which growth is measured.
Industrial Growth in India
- Manufacturing’s share is stuck: Manufacturing contributes around 17 per cent of Gross Domestic Product (GDP), far below the 25 per cent target set under Make in India.
- Global standing: India holds about 2.8 per cent of global manufacturing output against China’s roughly 29 per cent, with domestic manufacturing output nearing $1 trillion in 2025-26.
- Concentration: Maharashtra, Gujarat and Tamil Nadu account for about 40 per cent of net value added in manufacturing, and half the States have no operational Special Economic Zone.
Government Initiatives for Industrial Growth
- National Manufacturing Mission: Announced in the 2025-26 Budget, it unifies manufacturing policy and targets a 25 per cent GDP share with 143 million jobs by 2035.
- Production Linked Incentive Scheme: Covers 14 sunrise and strategic sectors with outcome linked incentives, drawing over ₹1.76 lakh crore in committed investment as of March 2025.
- Semiconductor Mission: A ₹76,000 crore framework under which 10 projects worth about ₹1.60 lakh crore have been approved.
- Industrial Corridors Programme: India approved 11 corridors covering 32 projects, with 12 new industrial nodes cleared in 2024 for plug and play industrial cities.
Challenges in Industrial Growth
- Compliance load falls on small firms: Micro, small and medium enterprises face over 1,450 annual compliances, which consumes management time that would otherwise go into expansion. Eg. Annual compliance costs for such firms run to ₹13 lakh to ₹17 lakh. Fix. Adopt third party certification in place of repeat inspections, as the Ajay Shankar Committee recommended.
- Regional concentration leaves capacity idle: Industrial value added clusters in three States, so national incentives do not translate into national capacity. Eg. Half of India’s States have no operational Special Economic Zone. Fix. Weight central incentive disbursal toward States below the national share of net value added.
- Technology transition is slow in strategic segments: Domestic capability lags in electronics, semiconductors and renewable energy components, which keeps high value assembly abroad. Eg. India remains heavily dependent on imports for semiconductors and advanced electronic components. Fix. Extend Production Linked Incentives to upstream segments such as advanced materials and green hydrogen rather than final assembly alone.
- Credit does not reach small manufacturers: Formal finance is unavailable to the great majority of small firms, so they cannot fund the fixed capital that raises productivity. Eg. The unmet credit demand of the micro, small and medium enterprise sector is estimated at about ₹20 lakh crore to ₹25 lakh crore. Fix. Expand cash flow based lending against Goods and Services Tax returns rather than collateral based assessment.
- Trade barriers raise export uncertainty: Tariff action by large markets can remove the price advantage of an entire export segment without notice. Eg. The United States imposed a 50 per cent tariff in August 2025, hitting about 55 per cent of India’s exports to that market. Fix. Deepen global value chain participation through trade agreements and diversify destination markets under a China plus one strategy.