
The Union Minister for Finance & Corporate Affairs, Smt. Nirmala Sitharaman presented the Economic Survey 2019-20 in the Parliament today. The Key Highlights of the Survey are as follows:
Wealth Creation: The Invisible Hand Supported by the Hand of Trust
[Covered in a separate newscard]
Survey posits that India’s aspiration to become a $5 trillion economy depends critically on:
- Strengthening the invisible hand of the market.
- Supporting it with the hand of trust.
Pro-business versus Pro-markets Strategy
- Survey says that India’s aspiration of becoming a $5 trillion economy depends critically on:
- Promoting ‘pro-business’ policy that unleashes the power of competitive markets to generate wealth.
- Weaning away from ‘pro-crony’ policy that may favour specific private interests, especially powerful incumbents.
- Pro-crony policies such as discretionary allocation of natural resources till 2011 led to rent-seeking by beneficiaries while competitive allocation of the same post 2014 ended such rent extraction.
Strengthening the invisible hand by promoting pro-business policies to:
- Provide equal opportunities for new entrants.
- Enable fair competition and ease doing business.
- Eliminate policies unnecessarily undermining markets through government intervention.
- Enable trade for job creation.
- Efficiently scale up the banking sector.
- Introducing the idea of trust as a public good, which gets enhanced with greater use.
- Survey suggests that policies must empower transparency and effective enforcement using data and technology.
Entrepreneurship at the Grassroots
- Entrepreneurship as a strategy to fuel productivity growth and wealth creation.
- India ranks third in number of new firms created, as per the World Bank.
- New firm creation in India increased dramatically since 2014:
- 2 % cumulative annual growth rate of new firms in the formal sector during 2014-18, compared to 3.8 % during 2006-2014.
- About 1.24 lakh new firms created in 2018, an increase of about 80 % from about 70,000 in 2014.
- Survey examines the content and drivers of entrepreneurial activity at the bottom of the administrative pyramid – over 500 districts in India.
- New firm creation in services is significantly higher than that in manufacturing, infrastructure or agriculture.
- Survey notes that grassroots entrepreneurship is not just driven by necessity.
- A 10 percent increase in registration of new firms in a district yields a 1.8 % increase in Gross Domestic District Product (GDDP).
Impact of education on entrepreneurship
- Literacy and education in a district foster local entrepreneurship significantly:
- Impact is most pronounced when literacy is above 70 per cent.
- New firm formation is the lowest in eastern India with lowest literacy rate (59.6 % as per 2011 Census).
- Physical infrastructure quality in the district influences new firm creation significantly.
- Ease of Doing Business and flexible labour regulation enable new firm creation, especially in the manufacturing sector.
- Survey suggests enhancing ease of doing business and implementing flexible labour laws can create maximum jobs in districts and thereby in the states.
Divestment in public sector undertakings
- The Survey has aggressively pitched for divestment in PSUs by proposing a separate corporate entity wherein the government’s stake can be transferred and divested over a period of time.
- The survey analysed the data of 11 PSUs that had been divested from 1999-2000 and 2003-04 and compared the data with their peers in the same industry.
- Further, the survey has said privatized entities have performed better than their peers in terms of net worth, profit, return on equity and sales, among others.
- The government can transfer its stake in listed CPSEs to a separate corporate entity.
- This entity would be managed by an independent board and would be mandated to divest the government stake in these CPSEs over a period of time.
- This will lend professionalism and autonomy to the disinvestment programme which, in turn, would improve the economic performance of the CPSEs.
Golden jubilee of bank nationalization: Taking stock
- The survey observes 2019 as the golden jubilee year of bank nationalization
- Accomplishments of lakhs of Public Sector Banks (PSBs) employees cherished and an objective assessment of PSBs suggested by the Survey.
- Since 1969, India’s Banking sector has not developed proportionately to the growth in the size of the economy.
- India has only one bank in the global top 100 – same as countries that are a fraction of its size: Finland (about 1/11th), Denmark (1/8th), etc.
- A large economy needs an efficient banking sector to support its growth.
The onus of supporting the economy falls on the PSBs accounting for 70 % of the market share in Indian banking:
- PSBs are inefficient compared to their peer groups on every performance parameter.
- In 2019, investment for every rupee in PSBs, on average, led to the loss of 23 paise, while in NPBs it led to the gain of 9.6 paise.
- Credit growth in PSBs has been much lower than NPBs for the last several years.
Solutions to make PSBs more efficient:
- Employee Stock Ownership Plan (ESOP) for PSBs’ employees
- Representation on boards proportionate to the blocks held by employees to incentivize employees and align their interests with that of all shareholders of banks.
- Creation of a GSTN type entity that will aggregate data from all PSBs and use technologies like big data, artificial intelligence and machine learning in credit decisions for ensuring better screening and monitoring of borrowers, especially the large ones.
Doubts regarding GDP Growth
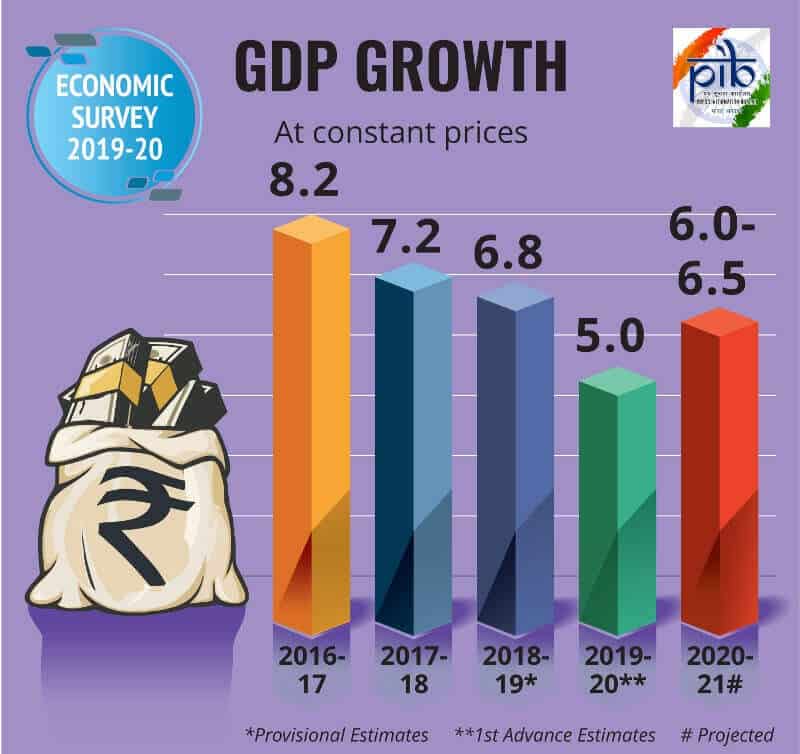
- GDP growth is a critical variable for decision-making by investors and policymakers. Therefore, the recent debate about accuracy of India’s GDP estimation following the revised estimation methodology in 2011 is extremely significant.
- As countries differ in several observed and unobserved ways, cross-country comparisons have to be undertaken by separating the effect of other confounding factors and isolating effect of methodology revision alone on GDP growth estimates.
- Models that incorrectly over-estimate GDP growth by 2.7 % for India post-2011 also misestimate GDP growth over the same period for 51 out of 95 countries in the sample.
Fiscal Developments
- Revenue Receipts registered a higher growth during the first eight months of 2019-20, compared to the same period last year, led by considerable growth in Non-Tax revenue.
- Gross GST monthly collections have crossed the mark of Rs. 1 lakh crore for a total of five times during 2019-20 (up to December 2019).
- Structural reforms undertaken in taxation during the current financial year:
- Change in corporate tax rate.
- Measures to ease the implementation of GST.
- Fiscal deficit of states within the targets set out by the FRBM Act.
- Survey notes that the General Government (Centre plus States) has been on the path of fiscal consolidation.
External Sector
Balance of Payments (BoP):
- India’s BoP position improved from US$ 412.9 bn of forex reserves in end March, 2019 to US$ 433.7 bn in end September, 2019.
- Current account deficit (CAD) narrowed from 2.1% in 2018-19 to 1.5% of GDP in H1 of 2019-20.
- Foreign reserves stood at US$ 461.2 bn as on 10th January, 2020.
Global trade:
- India’s merchandise trade balance improved from 2009-14 to 2014-19, although most of the improvement in the latter period was due to more than 50% decline in crude prices in 2016-17.
- India’s top five trading partners continue to be USA, China, UAE, Saudi Arabia and Hong Kong.
Exports:
- Top export items: Petroleum products, precious stones, drug formulations & biologicals, gold and other precious metals.
- Largest export destinations in 2019-20 (April-November): United States of America (USA), followed by United Arab Emirates (UAE), China and Hong Kong.
- The merchandise exports to GDP ratio declined, entailing a negative impact on BoP position.
- Slowdown of world output had an impact on reducing the export to GDP ratio, particularly from 2018-19 to H1 of 2019-20.
- Growth in Non-POL exports dropped significantly from 2009-14 to 2014-19.
Imports:
- Top import items: Crude petroleum, gold, petroleum products, coal, coke & briquittes.
- India’s imports continue to be largest from China, followed by USA, UAE and Saudi Arabia.
- Merchandise imports to GDP ratio declined for India, entailing a net positive impact on BoP.
- Large Crude oil imports in the import basket correlates India’s total imports with crude prices. As crude price raises so does the share of crude in total imports, increasing imports to GDP ratio.
Logistics industry of India:
- Currently estimated to be around US$ 160 billion.
- Expected to touch US$ 215 billion by 2020.
- According to World Bank’s Logistics Performance Index, India ranks 44th in 2018 globally, up from 54th rank in 2014.
Direct investments and remittances:
- Net FDI inflows continued to be buoyant in 2019-20 attracting US$ 24.4 bn in the first eight months, higher than the corresponding period of 2018-19.
- Net FPI in the first eight months of 2019-20 stood at US$ 12.6 bn.
- Net remittances from Indians employed overseas continued to increase, receiving US$ 38.4 billion in H1 of 2019-20 which is more than 50% of the previous year level.
External debt:
- Remains low at 20.1% of GDP as at end September, 2019.
- After significant decline since 2014-15, India’s external liabilities (debt and equity) to GDP increased at the end of June, 2019 primarily by increase in FDI, portfolio flows and external commercial borrowings (ECBs).
Monetary Management and Financial Intermediation
Monetary policy:
- Remained accommodative in 2019-20.
- Repo rate was cut by 110 basis points in four consecutive MPC meetings in the financial year due to slower growth and lower inflation.
- However, it was kept unchanged in the fifth meeting held in December 2019.
- In 2019-20, liquidity conditions were tight for initial two months; but subsequently it remained comfortable.
Prices and Inflation
Inflation Trends:
- Inflation witnessing moderation since 2014
- Consumer Price Index (CPI) inflation increased from 3.7 per cent in 2018-19 (April to December, 2018) to 4.1 per cent in 2019-20 (April to December, 2019).
- WPI inflation fell from 4.7 per cent in 2018-19 (April to December, 2018) to 1.5 per cent during 2019-20 (April to December, 2019).
Drivers of CPI – Combined (C) inflation:
- During 2018-19, the major driver was the miscellaneous group
- During 2019-20 (April-December), food and beverages was the main contributor.
- Among food and beverages, inflation in vegetables and pulses was particularly high due to low base effect and production side disruptions like untimely rain.
Cob-web Phenomenon (Cyclical fluctuations in inflation) for Pulses:
- Farmers base their sowing decisions on prices witnessed in the previous marketing period.
- Measures to safeguard farmers like procurement under Price Stabilization Fund (PSF), Minimum Support Price (MSP) need to be made more effective.
Volatility of Prices:
- Volatility of prices for most of the essential food commodities with the exception of some of the pulses has actually come down in the period 2014-19 as compared to the period 2009-14.
- Lower volatility might indicate the presence of better marketing channels, storage facilities and effective MSP system.
Essential Commodities Act is outdated
- The Centre’s imposition of stock limits in a bid to control the soaring prices of onions over the last few months actually increased price volatility, according to the ES.
- The finding came in a hard-hitting attack in the report against the Essential Commodities Act (ECA) and other “anachronistic legislations” and interventionist government policies, including drug price control, grain procurement and farm loan waivers.
- The Centre invoked the Act’s provisions to impose stock limits on onions after heavy rains wiped out a quarter of the kharif crop and led to a sustained spike in prices.
- However the Survey showed that there was actually an increase in price volatility and a widening wedge between wholesale and retail prices.
- The lower stock limits must have led the traders and wholesalers to offload most of the kharif crop in October itself which led to a sharp increase in the price volatility.
Agriculture

- Agricultural productivity is also constrained by lower level of mechanization in agriculture which is about 40 % in India, much lower than China (59.5 %) and Brazil (75 %).
- With regard to the agri sector, the Survey argued that the beneficiaries of farm loan waivers consume less, save less, invest less and are less productive.
- It added that the government procurement of foodgrains led to a burgeoning food subsidy burden and inefficiencies in the markets, arguing for a shift to cash transfers instead.
Food Management
- The share of agriculture and allied sectors in the total Gross Value Added (GVA) of the country has been continuously declining on account of relatively higher growth performance of non-agricultural sectors.
- GVA at Basic Prices for 2019-20 from ‘Agriculture, Forestry and Fishing’ sector is estimated to grow by 2.8 %.
Services Sector

Increasing significance of services sector in the Indian economy:
- About 55 % of the total size of the economy and GVA growth.
- Two-thirds of total FDI inflows into India.
- About 38 per cent of total exports.
- More than 50 % of GVA in 15 out of the 33 states and UTs.
Social Infrastructure, Employment and Human Development
- The expenditure on social services (health, education and others) by the Centre and States as a proportion of GDP increased from 6.2 % in 2014-15 to 7.7 % in 2019-20 (BE).
- India’s ranking in Human Development Index improved to 129 in 2018 from 130 in 2017:
- With 1.34 % average annual HDI growth, India is among the fastest improving countries
- Gross Enrolment Ratio at secondary, higher secondary and higher education level needs to be improved.
- Gender disparity in India’s labour market widened due to decline in female labour force participation especially in rural areas:
- Around 60 % of productive age (15-59) group engaged in full time domestic duties.
Sustainable Development and Climate Change
- India moving forward on the path of SDG implementation through well-designed initiatives
- SDG India Index:
- Himachal Pradesh, Kerala, Tamil Nadu, Chandigarh are front runners.
- Assam, Bihar and Uttar Pradesh come under the category of Aspirants.
- India hosted COP-14 to UNCCD which adopted the Delhi Declaration: Investing in Land and Unlocking Opportunities.
- COP-25 of UNFCCC at Mandrid:
- India reiterated its commitment to implement Paris Agreement.
- COP-25 decisions include efforts for climate change mitigation, adaptation and means of implementation from developed country parties to developing country parties.
- Forest and tree cover:
- Increasing and has reached 80.73 million hectare.
- 56 % of the geographical area of the country.
- The numbers of stubble-burning incidents in 2019 were the least in four years, the Economic Survey says.