💥Mains Ready By December. Smash Mains & Smash PYQ Admissions Open

Subject: Agriculture

  • Centre imposes sugar stockholding limit to rein in price increase

    Why in the News

    The Centre on 20 August 2026 imposed a stockholding limit on bulk consumers of sugar and simultaneously allowed duty free import of 10 lakh metric tonne of raw sugar till the end of October. Retail sugar prices had risen about 15 per cent in a month ahead of the festive demand peak, which has pulled a commodity the government had been steadily deregulating back under the controls of the Essential Commodities Act, 1955.

    What is a stockholding limit under the Essential Commodities Act, 1955?

    1. What it does: A stockholding limit is an order fixing the maximum quantity of a notified commodity that a specified class of trader, processor or bulk consumer may hold at one time, or the maximum period for which it may be held.
    2. The legal source: It is issued by the administering ministry under Section 3 of the Essential Commodities Act, 1955, which empowers the Centre to regulate production, supply, distribution, trade and commerce in an essential commodity.
    3. The economic purpose: By capping how long stock can sit with a buyer, the order forces held inventory back into circulation and removes the incentive to accumulate ahead of an expected price rise.
    4. Its temporary character: Such orders carry a stated duration or a stated coverage period, because a permanent cap would function as a structural restriction on trade rather than a price intervention.

    What is a Tariff Rate Quota?

    1. Definition: A Tariff Rate Quota permits a fixed quantity of a good to be imported at a reduced or zero duty within a stated period, with imports beyond that quantity attracting the normal tariff.
    2. Why it is used: It supplies a targeted volume to correct a domestic shortage without dismantling the tariff protection that the domestic industry otherwise enjoys.

    What is an Advance Authorisation?

    1. Definition: It is a scheme permitting duty free import of inputs that are physically incorporated into a product meant for export, subject to an export obligation.

    What are the Standard Input Output Norms?

    1. Definition: The Standard Input Output Norms (SION) are the notified input to output ratios that fix how much of an input may be imported duty free for a given quantity of export product.
    2. The norm for sugar: SION E-52 is the norm applicable to sugar.

    Who does the sugar stockholding order cover and what does it require?

    1. Confectioners: Confectionery manufacturers using sugar as a production input fall within the class of bulk consumers covered by the order.
    2. Soft drink manufacturers: Beverage manufacturers are the second named category of bulk consumer brought under the limit.
    3. Food processing industry: Food processing units using sugar as raw material are the third named category.
    4. Sweetmeat sellers: Sweetmeat sellers form the fourth named category in the order.
    5. Any other institutional buyer above the threshold: The order extends to any other institutional buyer consuming not less than ten metric tonne of sugar as average monthly consumption over the past one year, excluding the current month.
    6. The fifteen day rule: No bulk consumer using more than ten metric tonne of sugar per month as raw material for production, consumption or use may keep sugar in stock for any period exceeding 15 days for such consumption or use.
    7. The exemption: Government institutions are kept outside the purview of the order.

    How will compliance with the stock limit be verified?

    1. Mill level sales data: The monthly quantity of sugar sold by each sugar mill to a bulk consumer is to be verified, whether that sale was made directly or routed through dealers.
    2. Consumption determined from tax returns: The consumption of each bulk consumer is to be determined with reference to the Goods and Services Tax returns filed by the sellers or the buyers, or both.
    3. The Harmonised System of Nomenclature code: The determination uses the relevant Harmonised System of Nomenclature code applicable to sugar, which is the standardised commodity classification used in tax and customs filings.
    4. Why this mechanism matters: Verification runs off filings the buyer already makes for tax purposes rather than off a separate physical inspection regime, which removes the need for a new inspectorate to enforce the cap.

    What do the price figures show about the trigger for the order?

    1. The current level: Sugar retail prices touched Rs 5,152.44 per quintal on Thursday, 20 August 2026, on the price portal maintained by the Department of Consumer Affairs.
    2. The one month rise: That level is a 15.12 per cent rise over Rs 4,475.84 per quintal a month earlier.
    3. The one year rise: It is a 19.68 per cent rise over Rs 4,305.05 per quintal a year earlier.
    4. The rate of acceleration: Close to four fifths of the annual increase occurred within the final month of the series, which points to a short run supply and holding response rather than a slow structural rise.
    5. The seasonal context: The spike lands with the festive season approaching, when sweetmeat, confectionery and beverage demand for sugar is at its annual peak.

    Why has the Centre paired stock limits with duty free imports?

    1. A two pronged approach: The government has described the intervention as a two pronged approach, acting on domestic holding and on import supply at the same time.
    2. Stock limits address holding: The 15 day cap targets sugar already inside the country that is being held by bulk consumers rather than converted into output.
    3. Imports address volume: The Ministry of Commerce and Industry amended the import policy for raw sugar to allow 10 lakh metric tonne of duty free imports under Tariff Rate Quota till 31 October 2026, which adds physical supply that stock limits alone cannot create.
    4. The conversion option: A one time option allows conversion of Advance Authorisations already issued under SION E-52 to the Tariff Rate Quota scheme, for the quantity of raw sugar actually imported under them up to the date of the notification, subject to specified conditions.
    5. Why one instrument alone would fail: A stock limit without added supply merely redistributes a shortage across the chain, while imports without a holding cap can be absorbed into inventory instead of reaching the retail price.

    Challenges to using stock limits to control sugar prices

    1. Signalling effect on the trade: An Essential Commodities Act order signals that the Centre will intervene again, which discourages legitimate seasonal inventory building by processors. Eg. Stock limits imposed on pulses in 2015 were followed by traders shifting holdings to unregulated intermediaries rather than releasing them to the market.
    2. Enforcement rests with State machinery: The order is issued by the Centre but is enforced through State civil supplies departments whose inspection capacity varies widely. Eg. Enforcement of edible oil stock limits notified in 2021 differed sharply across States, with several reporting negligible verification.
    3. Displacement rather than release: A cap on bulk consumers does not bind mills, dealers or unregistered buyers, so stock can move down the chain instead of into consumption. Eg. The present order exempts government institutions and does not fix a limit on the mills themselves.
    4. The ethanol diversion trade off: Sugar diverted to ethanol under the blending programme reduces the quantity available for the sweetener market, and the diversion decision is taken separately from price management. Eg. Sugar diversion to ethanol has crossed 35 lakh tonne in recent seasons, which directly reduces the sugar balance sheet.
    5. Import lead time: Duty free import permission does not translate into arrivals within the price window it is meant to address, because contracting, shipping and refining take weeks. Eg. The present window closes on 31 October 2026, which leaves a narrow period for contracting and delivery ahead of the festive peak.
    6. Producer price consequences: Import liberalisation and stock caps depress mill realisations, which feeds into delayed cane payments to farmers. Eg. Cane arrears in Uttar Pradesh have historically risen in seasons when mill realisations were compressed by policy interventions.

    Conclusion

    The Centre has notified a 15 day stockholding cap on bulk sugar consumers under Section 3 of the Essential Commodities Act, 1955, and separately amended the raw sugar import policy to allow 10 lakh metric tonne of duty free import. The order stands issued and in force, with compliance to be determined from Goods and Services Tax filings using the sugar Harmonised System of Nomenclature code. The next stated milestone is 31 October 2026, when the duty free Tariff Rate Quota import window closes.

    Sugar Sector in India

    1. Scale: India is among the world's largest producers of sugar and is the largest consumer, with sugarcane occupying a large share of the country's irrigated cropped area.
    2. Producing States: Uttar Pradesh, Maharashtra and Karnataka together account for the bulk of national sugar output, with Tamil Nadu, Gujarat and Andhra Pradesh forming the second tier.
    3. Livelihood base: Around five crore sugarcane farmers and their dependants, along with workers employed in mills and ancillary units, depend on the sector.
    4. A multi point regulated commodity: The sector is regulated at the cane price, at the mill's monthly sale quantity, at the mill's minimum selling price and at the export and import margin, which makes it one of the most administered agricultural value chains in India.
    5. Cane price mechanism: The Centre fixes a Fair and Remunerative Price on the recommendation of the Commission for Agricultural Costs and Prices, and several States additionally announce a higher State Advised Price.
    6. The ethanol link: Sugar and cane juice are diverted to ethanol production under the Ethanol Blended Petrol Programme, which makes the sugar balance sheet directly sensitive to fuel blending policy.

    Laws and Rules Governing Sugar and Essential Commodities

    1. Essential Commodities Act, 1955: Empowers the Centre to control the production, supply, distribution, trade and commerce of commodities notified as essential.
    2. Section 3 is the operative provision under which stock limits, licensing and price control orders are issued.
    3. The Essential Commodities (Amendment) Act, 2020 removed cereals, pulses, oilseeds, edible oils, onion and potato from regulation except in extraordinary circumstances, and was repealed by the Farm Laws Repeal Act, 2021.
    4. Sugarcane (Control) Order, 1966: Provides for the fixation of the minimum price of sugarcane payable by producers and for cane area reservation and bonding with mills.
    5. Sugar (Control) Order, 1966: Empowers the Centre to regulate the production, sale, storage and movement of sugar by mills, including the monthly release quota.
    6. Prevention of Black-marketing and Maintenance of Supplies of Essential Commodities Act, 1980: Provides for preventive detention of persons acting in a manner prejudicial to the supply of essential commodities.
    7. Foreign Trade (Development and Regulation) Act, 1992: Provides the authority under which the Directorate General of Foreign Trade amends the import policy and administers Tariff Rate Quotas.
    8. Customs Tariff Act, 1975: Fixes the tariff rates against which a duty free quota concession operates.
    9. Food Safety and Standards Act, 2006: Governs quality and labelling standards for sugar as a food product.

    Government Initiatives for the Sugar Sector

    1. Ethanol Blended Petrol Programme: Channels surplus sugar and cane juice into fuel ethanol, giving mills an alternative revenue stream and reducing the sugar surplus that depresses domestic prices.
    2. Minimum Selling Price for mills: A floor price below which mills may not sell sugar in the domestic market, introduced to prevent distress sales from eroding the mills' capacity to pay cane dues.
    3. Fair and Remunerative Price: The statutory minimum price payable to cane growers, announced each season on the recommendation of the Commission for Agricultural Costs and Prices.
    4. Soft loan and interest subvention schemes for mills: Extended to sugar mills to clear cane price arrears and to fund ethanol distillation capacity.
    5. PM JI-VAN Yojana: Supports commercial second generation ethanol projects using agricultural residue, widening the ethanol feedstock base beyond cane.
    6. Price Monitoring Division: Maintains daily retail and wholesale price data for essential commodities on the Department of Consumer Affairs portal, which is the basis on which interventions are triggered.

    Key Facts about Sugar in India

    1. The sugar season: The Indian sugar season runs from October to September, not the financial year, which is why import and stock windows are set against October.
    2. Global position: India is the world's largest consumer of sugar and alternates with Brazil at the top of the global production table.
    3. Minimum Selling Price level: The Minimum Selling Price for mills has stood at Rs 31 per kilogram since it was last revised in February 2019.
    4. Cooperative dominance: A large share of the sugar mills in Maharashtra operate in the cooperative sector, which links the industry to State level politics.
    5. Ethanol blending milestone: India reached the 20 per cent ethanol blending level in petrol in 2025, ahead of the original 2030 target.
    6. Byproducts: Bagasse is used for cogeneration of power and press mud for biofertiliser, so a mill's revenue does not depend on sugar alone.

    Challenges in Agricultural Price Stabilisation in India

    1. Leakage and diversion in the public distribution chain: Grain and sugar released at subsidised rates are diverted into the open market before reaching the entitled household. Eg. Sugar released for the public distribution system in several States has been recovered from open market traders during civil supplies raids.
    2. Exclusion errors in beneficiary identification: Households entitled to subsidised supply are left out because the beneficiary list is anchored to an outdated population base. Eg. National Food Security Act, 2013 coverage continues to be calculated on the 2011 Census population, which excludes households added since.
    3. Storage and warehousing deficiency: Inadequate scientific storage causes physical loss between procurement and distribution, tightening supply independent of production. Eg. Foodgrain stored in cover and plinth facilities during the monsoon has repeatedly been reported as damaged in Comptroller and Auditor General audits.
    4. Regional disparity in procurement: Procurement infrastructure is concentrated in a few States, so price support reaches producers unevenly. Eg. Wheat and paddy procurement remains concentrated in Punjab, Haryana and Madhya Pradesh, leaving eastern State growers dependent on traders.
    5. Fiscal burden of the intervention: Price support, buffer carrying cost and subsidised distribution together consume a large and rising share of the food subsidy bill. Eg. The food subsidy has remained among the largest single line items in the Union Budget's revenue expenditure.
    6. The commodity price cycle: High prices in one season induce acreage expansion and a glut in the next, so annual interventions treat a cycle that policy itself reinforces. Eg. The sugar cycle in India has historically alternated between surplus years requiring export subsidy and deficit years requiring import concession.
    7. Weak monitoring data: Price intervention depends on retail price reporting from a limited set of centres, which lags the actual market. Eg. The Department of Consumer Affairs price portal draws daily quotations from a fixed set of reporting centres, which may not capture local scarcity.

    Back2Basics: Essential Commodities Act, 1955

    1. Purpose: It provides for the control of production, supply and distribution of, and trade and commerce in, commodities declared essential in the interest of the general public.
    2. Administering ministry: It is administered by the Department of Consumer Affairs and the Department of Food and Public Distribution under the Ministry of Consumer Affairs, Food and Public Distribution.
    3. The essential commodities list: The Schedule lists the commodities covered, including drugs, fertilisers, foodstuffs, hank yarn, petroleum and products, raw jute and jute textiles, and seeds of food crops.
    4. Power to amend the list: The Centre may add or remove a commodity from the Schedule in consultation with the State Governments, which allows the coverage to change without amending the Act.
    5. Section 3: Empowers the Centre to issue orders regulating or prohibiting production, supply, distribution, storage, transport and disposal of an essential commodity.
    6. Section 7: Prescribes penalties for contravention of an order made under Section 3, including imprisonment and forfeiture of the stock involved.
    7. Delegation to States: The Centre delegates enforcement powers to State Governments, which issue their own control orders and conduct inspections.

    Way Forward

    1. Attach an explicit sunset to the stock order: State the closing date of the stockholding limit in the order itself, so that a price stabilisation measure does not harden into a standing restriction on processors.
    2. Publish stock disclosure in real time: Extend the online stock declaration portal used for pulses and edible oils to sugar, so that holdings across mills, dealers and bulk consumers are visible before an intervention is needed.
    3. Coordinate ethanol diversion with the sugar balance sheet: Fix the season's ethanol diversion cap after the opening stock and expected production are known, rather than treating fuel policy and food policy as separate decisions.
    4. Move cane pricing to a revenue sharing formula: Adopt the revenue sharing approach recommended by the Rangarajan Committee so that the cane price moves with sugar and byproduct realisations instead of being fixed independently of them.
    5. Widen the price reporting base: Expand the Price Monitoring Division's reporting centres and integrate mandi level data, so intervention is triggered on a fuller picture of local scarcity.
    6. Use warehouse receipt financing: Encourage negotiable warehouse receipts so that mills can raise working capital against stored sugar without distress selling, which reduces the volatility that stock limits are later called on to correct.
    7. Time the import window to the demand peak: Align duty free import windows with the contracting and shipping lead time for raw sugar, so that permitted volume actually lands before the festive demand period.

    Matching Previous Year Question

    “[2024, GS3, 15] Elucidate the importance of buffer stocks for stabilizing agricultural prices in India. What are the challenges associated with the storage of buffer stock? Discuss.”

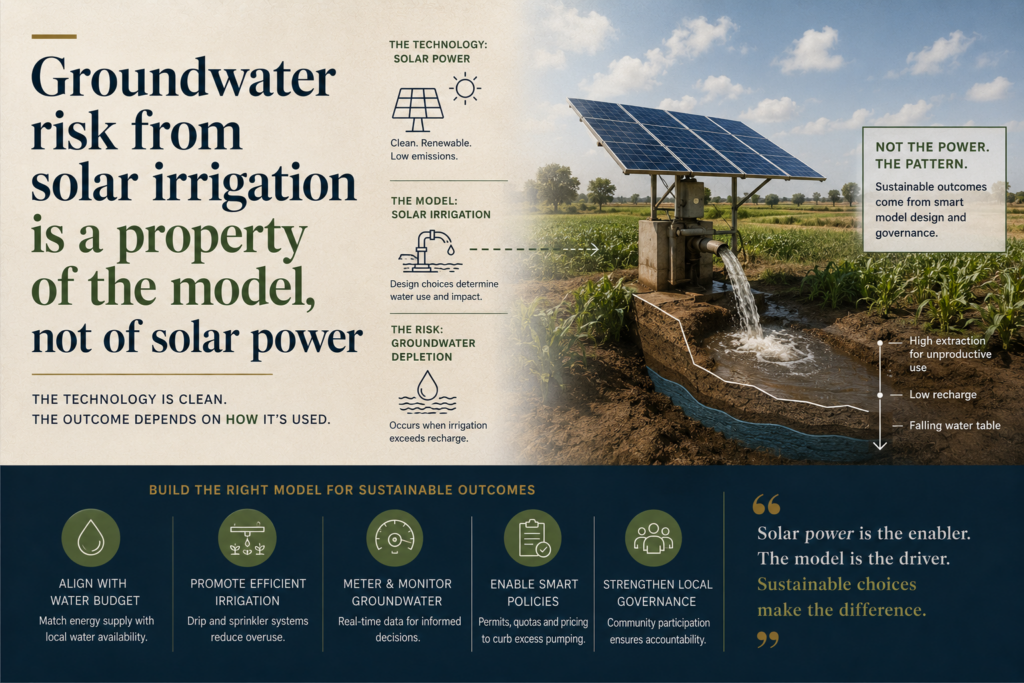
  • Groundwater risk from solar irrigation is a property of the model, not of solar power

    Why in the News

    India’s agricultural solar programme has installed over 2.5 million solar pumps in five years, and the government is now preparing PM-KUSUM 2.0. The standard objection is that free solar power removes every incentive to limit pumping and will therefore deepen the groundwater crisis. That objection treats solar irrigation as a single model, when the groundwater outcome is determined by ownership structure, pricing incentive and local hydrogeology.

    What is PM-KUSUM?

    1. About: The Pradhan Mantri Kisan Urja Suraksha evam Utthan Mahabhiyan (PM-KUSUM) is India’s agricultural solar programme, administered by the Ministry of New and Renewable Energy.
    2. Delivery so far: It has installed over 2.5 million solar pumps over the past five years, made affordable for smallholder farmers through subsidies.
    3. Three routes: It supports decentralised grid connected solar plants on barren land, standalone off grid solar pumps, and the solarisation of existing grid connected agricultural pumps.
    4. Next stage: The government is preparing PM-KUSUM 2.0, whose design challenge is to advance the clean energy transition without worsening an already over exploited groundwater base.

    What is a feed in tariff?

    1. About: A feed in tariff is a guaranteed per unit price at which a distribution utility buys electricity that a small generator exports to the grid.
    2. Why it matters here: A high enough tariff converts every unit of electricity not used for pumping into cash income, so saving water becomes profitable rather than merely virtuous.

    Why is the standard objection to solar irrigation incomplete?

    1. The objection itself: Heavily subsidised or free electricity has driven unsustainable groundwater abstraction, falling water tables, depleting aquifers and growing fiscal burdens on energy utilities, and solar is assumed to extend that pattern.
    2. First gap, the single model assumption: The debate treats solar irrigation as one model, typically a farmer running a standalone pump with no incentive to conserve water, when models differ by design, ownership structure and pricing incentive.
    3. Second gap, energy as the only variable: The debate discounts local hydrogeology, cropping patterns, marginal returns to irrigation and soil type, all of which shape irrigation behaviour independently of the energy source.
    4. Third gap, evaluation in a silo: Solar irrigation is judged as either a water intervention or an energy intervention, when its consequences span water, energy and food together.
    5. The reframed question: The question is not whether solar irrigation is inherently good or bad for groundwater, but what kind of model is deployed, where, and with what incentives.

    How do ownership and pricing change the groundwater outcome?

    1. Grid connected models create a price for restraint: Models that let farmers sell surplus solar electricity back to the grid give a direct financial reward for using less water.
    2. Gujarat’s Suryashakti Kisan Yojana: Around 100 agricultural feeders were transitioned to solar energy under the scheme.
    3. Measured behaviour change: Solar farmers showed significantly slower growth in energy consumption and in irrigation application than non solar farmers, indicating more sustainable water use.
    4. The tariff that produced it: The scheme offered around Rs 7 per unit as a feed in tariff, a meaningful incentive to conserve electricity and export energy.
    5. Income effect: By exporting energy, farmers earned an average of roughly Rs 21,900 annually, converting them from energy consumers into energy producers.
    6. Standalone pumps vary too: Even for standalone off grid pumps under PM-KUSUM, utilisation and the extent to which the pump replaces diesel rather than grid electricity vary widely with installed capacity, the depth of the water table and years of operating experience.

    What does the Bangladesh model show about pricing solar water?

    1. The dominant model there: Bangladesh’s most common arrangement is the fee for service centralised solar model, in which a pump owner supplies water to multiple farmers within a fixed command area.
    2. The revenue logic: The owner earns from selling water, so the pump is operated as a business rather than as a private convenience.
    3. The measured result: Farmers using solar irrigation did not apply more water than farmers using diesel, even though solar irrigation was 20 to 30 percent cheaper.
    4. The mechanism behind it: Excessive irrigation by one farmer reduces the operator’s ability to serve others, so efficient and equitable groundwater use becomes a condition of the business remaining financially sustainable.
    5. What the case demonstrates: A cheaper energy source did not raise water use once the water itself carried a price and a rationing constraint.

    Why does the same pump produce different outcomes across regions?

    1. Hard rock aquifer regions: Where storage capacity is limited and cropping is rainfed, each additional unit of irrigation water yields high marginal benefit, and water use changed little between solar and non solar users regardless of the energy source.
    2. Punjab and Haryana: Irrigation is already widespread and dominated by water intensive rice and wheat, leaving little scope to expand irrigated area, so solar is unlikely to drive further over exploitation.
    3. The real question in those States: Whether solar can make water, energy and food systems more sustainable by replacing subsidised fossil fuel electricity with grid connected solar, cutting subsidy costs and emissions together.
    4. Eastern India: Irrigation expansion has been constrained by access to energy rather than to water, with large rainfed areas, high diesel costs and unreliable power.
    5. Policy consequence: Solar irrigation policy must follow a differentiated regional approach with context specific model choice, paired with stronger groundwater monitoring and adaptive management to catch emerging stress early.

    What does solar irrigation change beyond groundwater?

    1. Emissions from pumping: Groundwater irrigation in India is estimated to generate between 45 and 62 million tonnes of carbon dioxide a year.
    2. Fiscal burden: Agricultural electricity subsidies across States amount to over Rs 1 lakh crore a year.
    3. Per farmer mitigation: Estimates from Gujarat suggest each grid connected solar farmer offsets approximately 12.3 tonnes of carbon dioxide annually through on farm solar use and electricity exported to the grid.
    4. Payback on public money: Subsidies covered nearly one fourth of government investments within the first two years.
    5. Scale of the opportunity: Applied across India’s more than 25 million agricultural pumps, the mitigation and fiscal implications are substantial.

    Should policy prioritise saving water or expanding access?

    1. The case for saving water: In water stressed regions, grid connected solar can be expanded through individual pumps or by taking entire agricultural feeders solar, with both models rewarding farmers for saving water.
    2. The case for expanding access: Where farmers still lack reliable irrigation, the priority is expanding access rather than saving water.
    3. The instrument each case needs: Standalone solar pumps remain the preferred option in areas with limited irrigation, poor grid access and low groundwater risk.
    4. The distributional point: Emphasis should shift from individual ownership to scaling through water user associations, water selling entrepreneurs and farmer cooperatives in India’s most irrigation deprived regions.
    5. Why the tension is real: A single national design cannot simultaneously suppress pumping in Punjab and expand it in Bihar, so the same programme must carry two opposite incentive structures.

    Why has the current design of both models underperformed?

    1. Weak uptake of surplus sale: The approach of paying farmers to save water by selling surplus electricity to the grid has seen limited uptake.
    2. Feeder transitions do not change behaviour: Feeder level transitions to solar have performed better on delivery, but in their current form do little to change pumping behaviour.
    3. What individual pumps need: Simpler grid connection procedures and attractive buyback prices that reflect the local value of water and crops.
    4. What distribution companies need: Distribution companies (DISCOMs), which buy and supply the power, must themselves be incentivised to support the individual pump model.
    5. What feeder solarisation needs: Pairing with water saving incentives such as support for micro irrigation and direct cash payments for reduced pumping, on the model of Punjab’s Pani Bachao Paisa Kamao and Haryana’s Mera Pani Meri Virasat schemes, so the gain is not confined to the distribution company.

    Challenges to PM-KUSUM

    1. Farmer contribution barrier: Even after central and State subsidy, the residual farmer share blocks the poorest applicants. e.g. smallholders in Bihar and Jharkhand, where the same pump costs a larger share of annual income than in Gujarat.
    2. Slow solarisation of existing pumps: Retrofitting grid connected pumps depends on a distribution company agreeing to buy the surplus at a workable price. e.g. the limited uptake of the surplus sale route recorded in the current programme.
    3. Feeder solarisation without behavioural conditions: Solarising a feeder cuts the utility’s power purchase cost without altering how much a farmer pumps. e.g. feeder transitions that improved supply economics while leaving abstraction unchanged.
    4. Unmetered farm supply: Without metering, neither pumping nor saving can be measured, so a water saving payment has no basis. e.g. Punjab, where agricultural supply is largely flat rate and unmetered.
    5. Land availability for decentralised plants: Barren and fallow land near substations is scarce in densely cultivated districts. e.g. canal command areas of western Uttar Pradesh with almost no uncultivated parcels.
    6. After sales service: A solar pump with no local technician becomes a stranded asset. e.g. standalone pumps idling in remote blocks for want of repair and spare parts.
    7. Equity of ownership: Individual ownership concentrates the benefit in farmers who already own a borewell and a landholding. e.g. tenant cultivators and landless water buyers, who gain nothing from a pump subsidy tied to land title.

    Conclusion

    The groundwater question about solar irrigation has been asked at the wrong level, because the outcome is set by ownership structure, pricing incentive and local hydrogeology rather than by the energy source. Gujarat’s feed in tariff and Bangladesh’s fee for service model both show that water use falls once restraint carries a price, while standalone pumps in energy constrained Eastern India are correctly an access instrument rather than a conservation one. PM-KUSUM 2.0 therefore has to carry two opposite incentive structures within one programme, tightened in water stressed States and loosened where irrigation is scarce. The unresolved condition is measurement, since no water saving payment can operate on a farm supply that is neither metered nor monitored.

    “[2025, GS3, 15 marks] Examine the factors responsible for depleting groundwater in India. What are the steps taken by the government to mitigate such depletion of groundwater?”

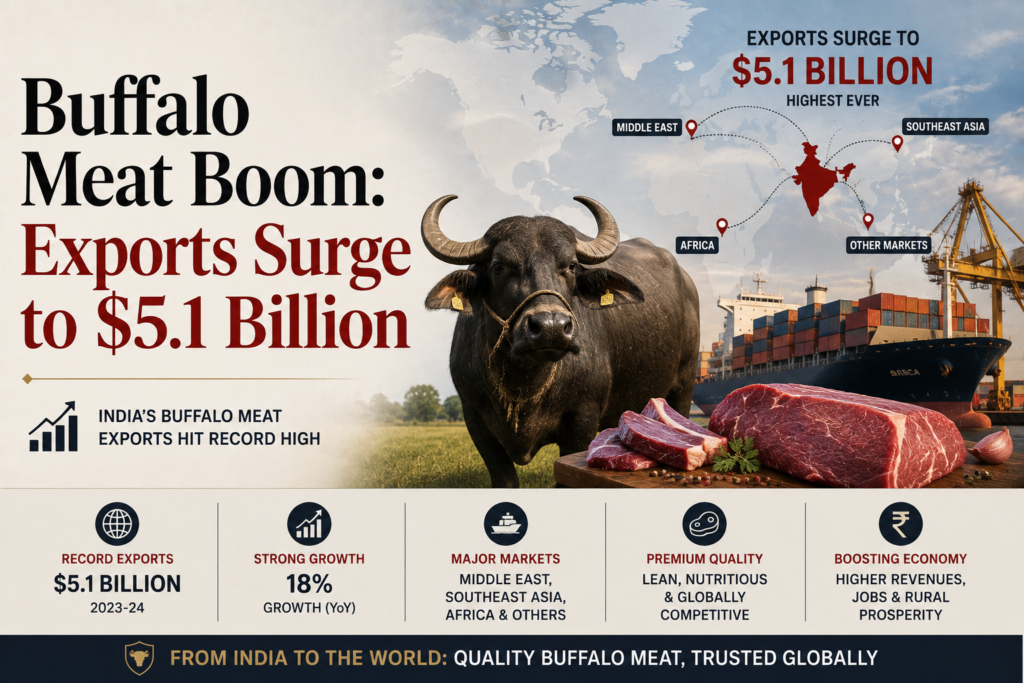
  • Buffalo Meat Boom: Exports Surge to $5.1 Billion

    Why in the News

    India’s buffalo meat exports rose 25.6% to $5.1 billion in 2025-26, with unit value rising to $3,591 per tonne. Exports grew another 66.6% in Q1 2026-27.

    Meat Export Development Fund

    • Purpose: Export promotion fund for meat, financed through an exporter levy.
    • Levy: APEDA charges ₹250 per tonne on frozen and chilled buffalo meat exports since 29 October 2025.
    • Uses: Market promotion, trade fairs, buyer-seller meets and addressing non-tariff barriers.
    • Model: Based on the Basmati Rice Fund (2008).

    Carabeef

    • Meaning: Meat of the water buffalo, distinct from cattle beef.
    • India does not permit beef exports; buffalo meat exports are allowed under specified categories.

    Key Export Trends

    • 2025-26: $5.1 billion, crossing $5 billion for the first time.
    • Q1 2026-27: Nearly $1.5 billion.
    • Unit value rose from $3,236/tonne (2024-25) to $3,591 (2025-26) and $4,392 (Q1 2026-27).
    • India is the third-largest bovine meat exporter, after Brazil and Australia.

    Regulatory Architecture

    • Exports allowed only through APEDA-registered plants meeting safety and hygiene standards.
    • 83 integrated abattoir-cum-processing plants, besides standalone slaughterhouses and processing units.
    • Periodic and surprise inspections ensure compliance.
    • Focus is shifting from bulk frozen blocks to processed and retail-ready products.
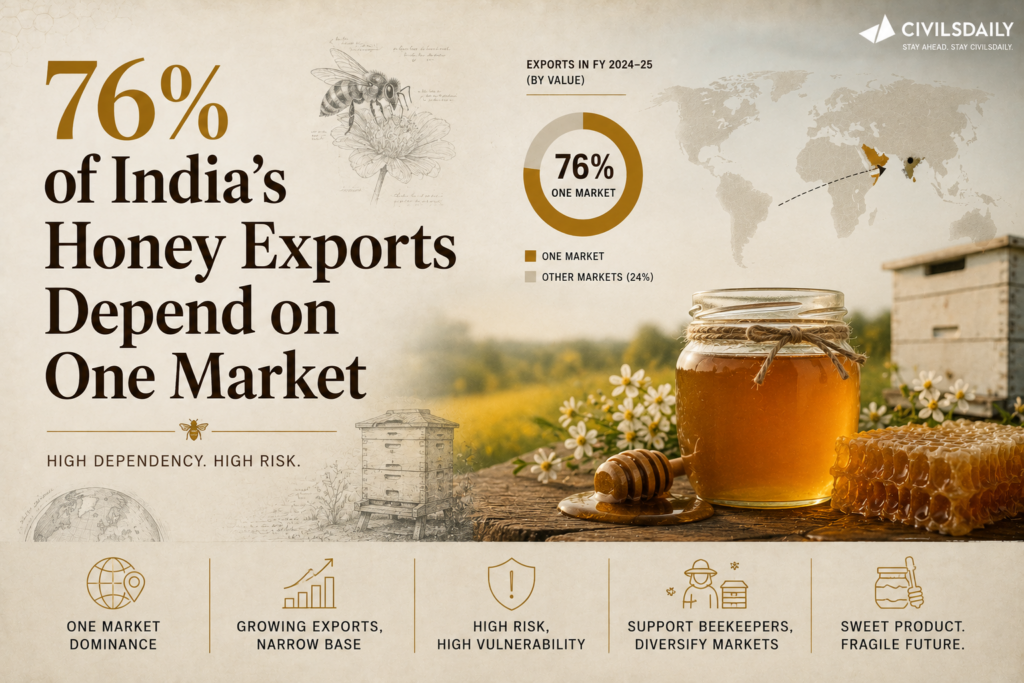
  • 76% of India’s Honey Exports Depend on One Market

    Why in the News

    India is the 2nd largest honey producer and 3rd largest exporter by value. However, around 76% of exports go to the U.S., while India’s honey has a relatively low unit value of about $1,858/tonne.

    What is Apiculture?

    • Apiculture is the scientific rearing of honey bees in artificial hives for honey, hive products and pollination.
      • Apis mellifera: Italian bee
      • Apis cerana indica: Indian hive bee
      • Apis dorsata: Rock bee
      • Apis florea: Little bee
    • Products include honey, beeswax, propolis, royal jelly, pollen and bee venom.

    Key Facts

    • Production: ~76,000 tonnes (2013-14) → ~1.51 lakh tonnes (2025-26)
    • India: 2nd largest producer globally
    • ~70% production exported
    • U.S.: ~76% of India’s honey exports
    • Pollination: Bees contribute to 87 of 115 major food crops.
    • Domestic consumption: only ~37 g/person/year

    What is NMR Testing?

    • Nuclear Magnetic Resonance (NMR) testing analyses the molecular profile of honey to detect: Added sugar syrups, Botanical origin, and Geographical origin. It is increasingly important for accessing premium export markets.

    Major Challenges

    • Adulteration: Sugar syrup contamination
    • Limited NMR testing infrastructure
    • Pesticide and antibiotic residue concerns
    • Heavy dependence on the U.S. market
    • Low-value bulk exports
    • Weak traceability and branding
    • Competition from China and premium brands such as New Zealand’s Manuka honey

    Way Forward

    • Expand NMR-capable laboratories
    • Develop cluster-based processing and packaging
    • Promote GI-tagged honey
    • Strengthen Farmer Producer Organisations (FPOs)
    • Diversify into beeswax, propolis and royal jelly
    • Strengthen the National Beekeeping and Honey Mission
    • Promote domestic honey consumption
    • Protect bee health through scientific beekeeping and pesticide management

    “[2018, GS3, 15 marks] Assess the role of National Horticulture Mission (NHM) in boosting the production, productivity and income of horticulture farms. How far has it succeeded in increasing the income of farmers?”
    [2023] Which of the following organisms perform waggle dance for others of their kin to indicate the direction and the distance to a source of their food?

    [A] Butterflies

    [B] )Dragonflies

    [C] Honeybees

    [D] Wasps

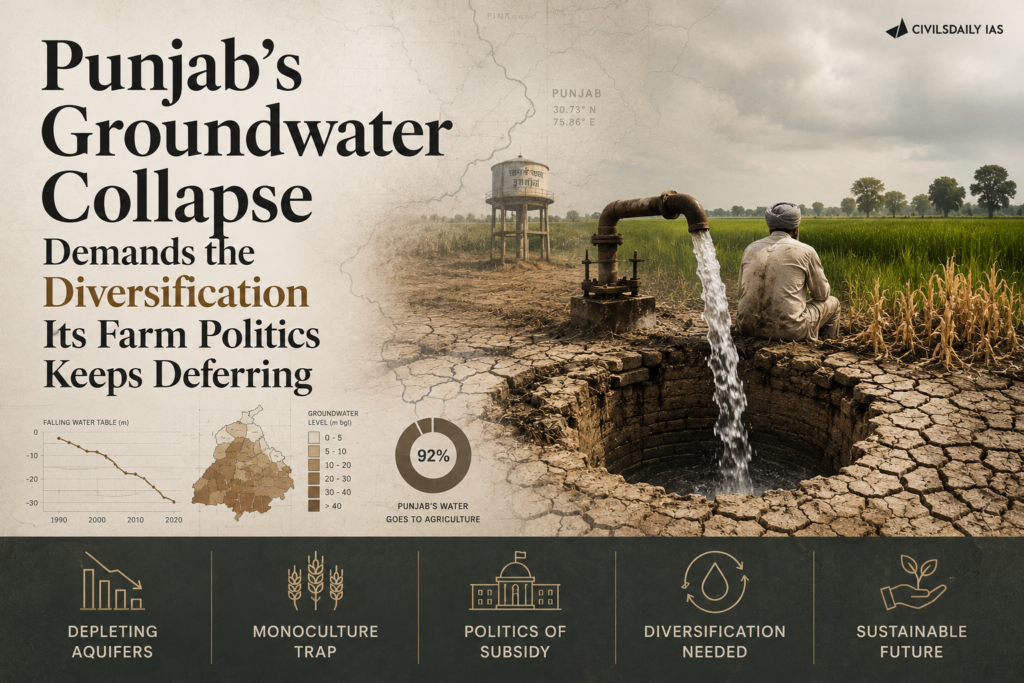
  • Punjab’s groundwater collapse demands the diversification its farm politics keeps deferring

    Why in the News

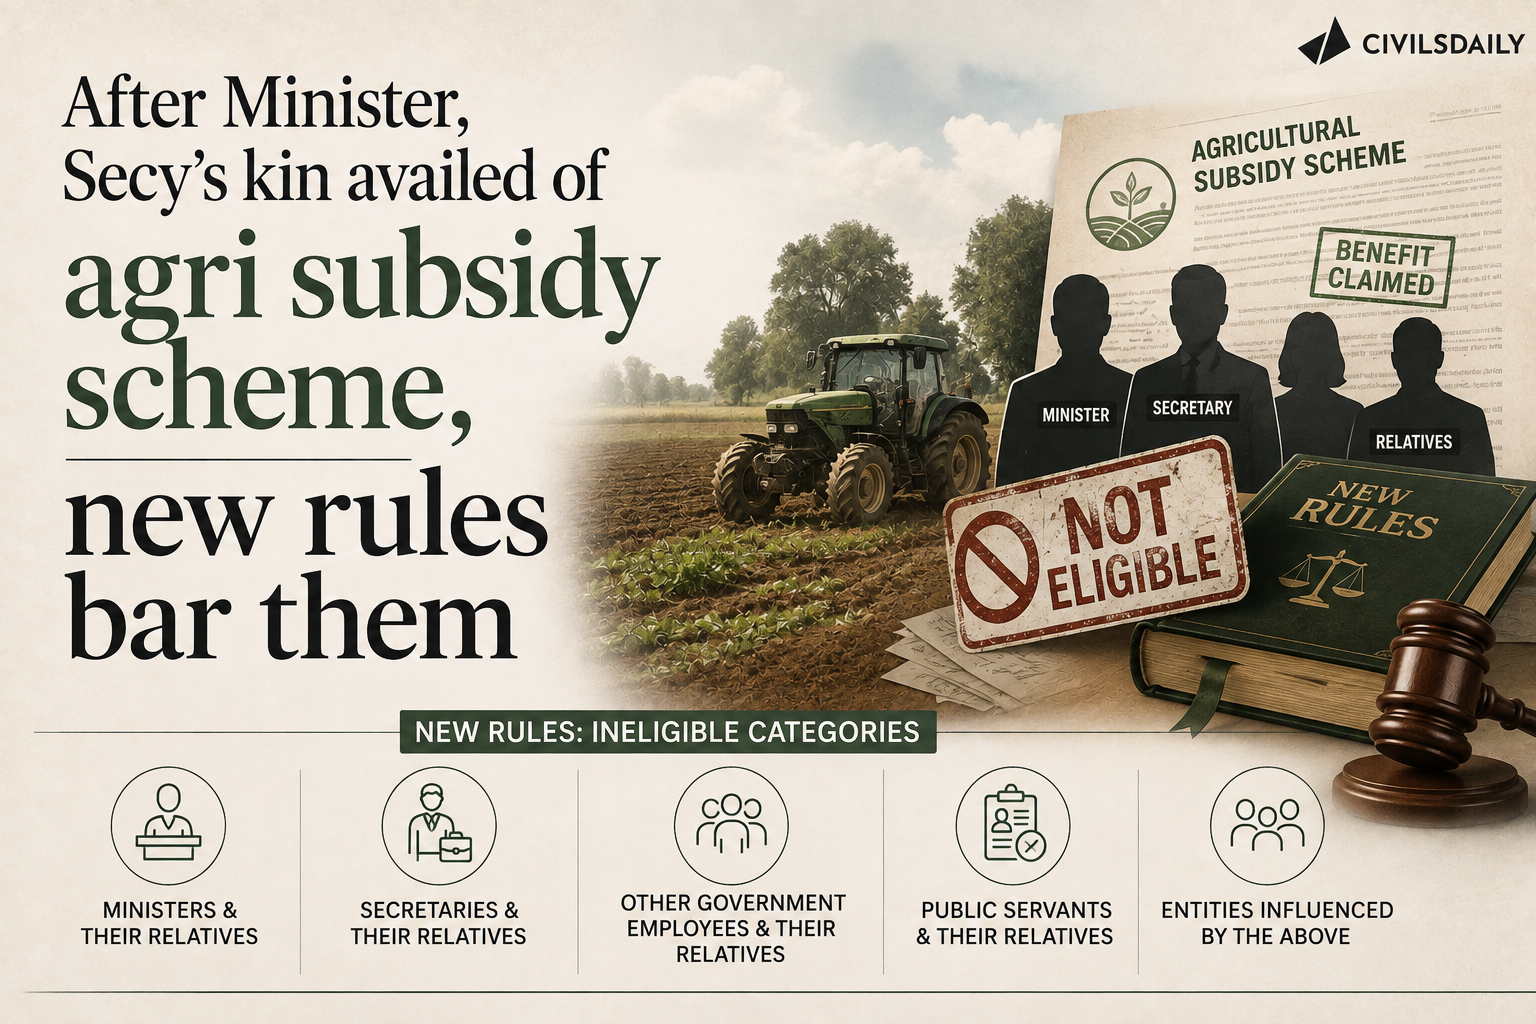
    The acreage under water intensive paddy in Punjab touched a record high this year, even as the water table continues to fall and experts warn of impending desertification. The State that built its agrarian success on assured irrigation is now consuming the resource that made it possible, while governments across party lines keep supplying free water and power rather than executing the diversification plans already drafted.

    What is crop diversification?

    1. About: Crop diversification is the shift of cropped area away from one or two dominant crops toward a wider mix of crops within the same season or rotation.
    2. How it works: A cultivator replaces part of the area under a water intensive or soil depleting crop with pulses, oilseeds, maize, cotton or horticulture.
    3. Rationale: It reduces the drawdown on a single natural resource and spreads market and weather risk across several crops.
    4. The precondition: It requires an assured market or procurement for the replacement crop, since the displaced crop already has one.

    Who was Ajit Singh?

    1. About: Ajit Singh was a peasant leader of colonial Punjab and the uncle of Bhagat Singh, and one of the main architects of the Pagdi Sambhal Jatta agitation against British agricultural laws.
    2. Exile and return: Hounded by the British, he spent nearly four decades abroad, engaging with revolutionaries including Lala Har Dayal and Subhas Chandra Bose, and was imprisoned in Germany after the Second World War before Jawaharlal Nehru secured his release in early 1947.
    3. Death: He died at Dalhousie at about 3.30 am on 15 August 1947, aged 66, his last words recorded as “Jai Hind”.

    What were the canal colonies of western Punjab?

    1. About: The canal colonies, known locally as the Baar, were settlements created in western Punjab after the British built an extensive canal network in the late nineteenth and early twentieth centuries.
    2. Why they were created: Large parts of western Punjab had remained uncultivated for centuries for want of irrigation, and the canals made cultivation possible for the first time.

    What is a murabba?

    1. About: A murabba is a square land allotment of 25 acres, the standard unit granted to settlers in the canal colonies.
    2. Who received them: Cultivators from what is now Indian Punjab, including retired soldiers, were moved into the colonies and allotted murabbas.

    What is abiana?

    1. About: Abiana is the water charge levied on cultivators for the use of canal irrigation.
    2. Why it mattered: A hike in abiana was one of the three grievances that triggered the 1907 Pagdi Sambhal Jatta agitation.

    What was the Pagdi Sambhal Jatta movement?

    1. About: Pagdi Sambhal Jatta was a peasant agitation of 1907 in colonial Punjab against three British laws that threatened farmers’ rights over their land and raised the water charge.
    2. How it got its name: Lala Banke Dayal’s poem of that title was recited at a rally in Lyallpur in March 1907, giving the movement its name and its anthem.

    What is desertification?

    1. About: Desertification is the degradation of land in dry, semi dry and dry sub humid areas, driven by climatic variation and human activity, until it loses its biological productivity.
    2. How it applies to Punjab: Sustained groundwater extraction beyond the recharge rate turns irrigated land progressively unproductive, which is the process experts have warned of in Punjab.

    What is Vibhajan Vibhishika Smriti Diwas?

    1. About: Vibhajan Vibhishika Smriti Diwas, or Partition Horrors Remembrance Day, is observed on 14 August each year since 2021.
    2. Purpose: It commemorates the displacement and loss suffered during the Partition of 1947.

    How did canal irrigation create Punjab’s agrarian identity?

    1. Arid land before irrigation: Large parts of western Punjab stayed uncultivated for centuries for want of irrigation.
    2. The canal network was the first input: The British built an extensive canal system across the region in the late nineteenth and early twentieth centuries.
    3. Settlers were the second input: Water alone was not enough, so cultivators from what is now Indian Punjab, including retired soldiers, were moved into the new tracts.
    4. Land allotted as murabbas: Each settler household received a murabba of 25 acres in the colonies.
    5. Settlements numbered, not named: New colonies were given administrative numbers such as Chak 8, Chak 20 and Chak 503, often carrying the name of the migrants’ original village, as in Chak 503 Narangwal.
    6. Reclamation took years: The land was arid and took years of sustained work before it turned fertile, which is why its loss at Partition was felt as the loss of built capital.

    What does Punjab’s tradition of agrarian resistance consist of?

    1. The 1907 movement: Ajit Singh led the Pagdi Sambhal Jatta agitation alongside Lala Lajpat Rai against three British laws that threatened farmers’ rights and hiked the water charge or abiana.
    2. Scale of mobilisation: Ajit Singh addressed 19 of the 33 meetings recorded by British intelligence.
    3. The anthem: Lala Banke Dayal’s poem was recited at a rally in Lyallpur in March 1907 and gave the movement its name.
    4. The outcome: The British withdrew the farm laws, and both leaders were imprisoned in Mandalay, Burma.
    5. Recognition: Bal Gangadhar Tilak hailed Ajit Singh as the “king of Punjab peasantry” on his return.
    6. The tradition carried forward: The same slogan was raised during the 2020-21 farmers’ agitation against the since repealed central farm laws.

    Why has the adversary shifted from colonial law to resource depletion?

    1. The threat is now internal: The challenge today is not colonial rule but the depletion of the resource that made Punjab’s agrarian success possible.
    2. Warnings are long standing: Experts have warned of impending desertification in Punjab for years.
    3. The trend is worsening, not stabilising: Acreage under water intensive paddy cultivation touched a record high this year.
    4. The water table keeps falling: The aquifer continues to drop even as extraction expands with every additional paddy season.
    5. The cost is deferred, not avoided: Groundwater does not recharge at the rate at which it is being pumped, so each season transfers the shortfall to a later one.

    Why has a known diagnosis not produced action?

    1. The solutions are already documented: Economist S S Johl outlined diversification measures during the tenure of the previous Congress government in the State.
    2. Later plans exist as well: The current State government has also prepared plans on the water issue.
    3. Implementation is the gap: Execution of both sets of plans remains negligible.
    4. The problem is not knowledge: Punjab knows precisely what has to be done and consistently fails to do it, which makes this an execution failure rather than a policy vacuum.

    Why do free water and assured paddy procurement keep expanding the crop that is emptying the aquifer?

    1. The case for the free provision: Free water and free power for tubewells lower the cash cost of cultivation for a farm sector carrying heavy debt.
    2. The political arithmetic: State governments cutting across party lines have continued the free provision for political reasons, since withdrawing it carries an immediate electoral cost.
    3. Assured procurement completes the lock in: Paddy and wheat carry guaranteed purchase at a minimum support price, and no alternative crop offers comparable certainty.
    4. The other side of the ledger: Free power removes the price signal on extraction, so pumping continues well past the rate at which the aquifer can recharge.
    5. Two legitimate claims in conflict: Farm income security and aquifer survival both carry a genuine claim, and current policy settles the question entirely in favour of the first.
    6. The cost appears nowhere: The support shows up as a power subsidy line in the State budget, while the depletion appears in no account until wells begin to fail.

    Why have farmer unions’ priorities not tracked the water crisis?

    1. Attention directed at trade: Farmer unions have mobilised strongly against free trade agreements.
    2. The nearer threat is unaddressed: The same unions have overlooked aquifer depletion as a looming calamity of comparable scale.
    3. Individual adaptation is happening: Some individual farmers have adopted alternatives to paddy on their own initiative.
    4. Collective adaptation is not: Most cultivators remain caught within an unsustainable farming model that no organised body is challenging.

    What does the stated way forward require?

    1. Reduce paddy dependence: Cut the area under water intensive paddy cultivation.
    2. Guarantee markets for the substitutes: Ensure assured markets for diversified crops so that the switch is not a loss of income.
    3. Invest in micro irrigation: Move field irrigation from flood delivery to drip and sprinkler systems.
    4. Build food processing capacity: Create processing demand that gives non paddy crops a committed buyer.
    5. Align policy with ecology: Set agricultural policy against ecological limits rather than electoral compulsions.

    Challenges to crop diversification in Punjab

    1. Absence of assured procurement for alternative crops: Only paddy and wheat carry guaranteed purchase, so any switch transfers price risk to the farmer. e.g. maize in Punjab routinely selling below its minimum support price for want of a procurement agency.
    2. Free power removes the cost of extraction: Zero marginal cost pumping eliminates any incentive to economise on water. e.g. blocks in Sangrur, Barnala and Moga classified as over exploited by the Central Ground Water Board while tubewell use continues unchecked.
    3. Sunk investment in the paddy and wheat rotation: Farm assets are built around a single cycle and cannot be repurposed. e.g. combine harvesters, paddy transplanters and laser levelled fields configured for that rotation alone.
    4. Labour and machinery calendar locked to paddy: The seasonal labour supply arrives for a specific operation window. e.g. migrant labour arriving in June for transplanting, a cycle no substitute crop matches.
    5. Groundwater regulation limited to sowing dates: Existing law delays transplanting without reducing total irrigated area. e.g. the Punjab Preservation of Subsoil Water Act, 2009, which shifted the transplanting date later but left acreage untouched.
    6. Weak processing and cold chain for horticulture: Perishable substitutes fail without storage and processing capacity nearby. e.g. kinnow growers in Abohar and Fazilka facing distress sales in glut years.
    7. Residue burning tied to the compressed paddy to wheat window: The delayed transplanting date leaves too little time between harvest and the next sowing. e.g. the October and November stubble fires across Sangrur, Bathinda and Patiala every year.

    Conclusion

    Punjab’s crisis is not the absence of a diversification plan but the presence of a policy structure that pays cultivators to keep growing paddy. Free water and power remove the cost of extraction while assured procurement removes the risk of continuing, so a record paddy acreage now coexists with a falling water table and warnings of desertification. Diversification will begin only when an alternative crop carries the same market certainty that paddy already has. Until then the tradition of agrarian resistance will keep facing outward while the aquifer empties.

    Groundwater Irrigation in India

    1. About: Groundwater irrigation is the extraction of water from aquifers through wells and tubewells for crop cultivation, as distinct from surface canal irrigation.
    2. India’s standing: India is the largest user of groundwater in the world, extracting more than the United States and China combined.
    3. Share of irrigation: Groundwater accounts for roughly 60 per cent of irrigated area and about 85 per cent of rural drinking water supply.
    4. The assessment system: The Central Ground Water Board and State agencies jointly assess blocks annually and classify them as safe, semi critical, critical or over exploited.
    5. Regional concentration of stress: Punjab, Haryana, Rajasthan, western Uttar Pradesh and parts of Tamil Nadu carry the highest proportion of over exploited units.
    6. The energy link: Subsidised or free electricity for agricultural pumping is the single largest driver of extraction, since it removes the marginal cost of drawing water.

    Constitutional Framework Governing Water in India

    1. Entry 17, State List, Seventh Schedule: Places water supply, irrigation, canals, drainage, embankments and water storage under State legislative competence.
    2. Entry 56, Union List, Seventh Schedule: Empowers Parliament to regulate inter State rivers and river valleys where it declares such regulation expedient in the public interest.
    3. Article 262: Allows Parliament to provide for adjudication of inter State river water disputes and to bar the jurisdiction of courts in such disputes.
    4. Article 21: Interpreted by the Supreme Court to include the right to clean and adequate water as part of the right to life.
    5. Article 48A: Directs the State to protect and improve the environment, which courts have read as covering groundwater conservation.
    6. Article 243G and the Eleventh Schedule: Assign minor irrigation, water management and watershed development to panchayats.

    Laws and Rules Governing Groundwater Use

    1. Indian Easements Act, 1882: Treats groundwater as attached to land ownership, which is the legal root of unrestricted extraction by landowners.
    2. Environment (Protection) Act, 1986: Provides the authority under which the Central Ground Water Authority was constituted to regulate and control groundwater development.
    3. Water (Prevention and Control of Pollution) Act, 1974: Governs the quality dimension of water resources through the pollution control boards.
    4. Punjab Preservation of Subsoil Water Act, 2009: Bars paddy nursery sowing and transplanting before notified dates, in order to shift the crop’s peak water demand closer to the monsoon.
    5. Model Bill for Conservation, Protection and Regulation of Groundwater, 2016: Circulated to States to establish groundwater as a public trust and to create local level groundwater security plans.
    6. Electricity Act, 2003: Governs agricultural power tariffs and the State subsidy mechanism that determines the cost of pumping.
    7. Guidelines for groundwater extraction, 2020: Prescribe the no objection certificate regime for industrial, infrastructure and mining users of groundwater.

    Back2Basics: Central Ground Water Board

    1. What it is: The Central Ground Water Board (CGWB) is the national apex agency for groundwater assessment, exploration, monitoring and management.
    2. Year established: Constituted in 1970, on the reorganisation of the Exploratory Tubewells Organisation.
    3. Parent ministry: It functions under the Department of Water Resources, River Development and Ganga Rejuvenation, Ministry of Jal Shakti.
    4. Headquarters: Faridabad, Haryana, with regional offices across the country.
    5. Mandate: It develops and disseminates technologies and monitors and implements national policies for the scientific and sustainable development of groundwater.
    6. Key outputs: It publishes the annual Dynamic Ground Water Resource Assessment and the groundwater year book, and it categorises assessment units by stage of extraction.
    7. Regulatory arm: The Central Ground Water Authority, constituted under Section 3(3) of the Environment (Protection) Act, 1986, exercises the regulatory powers over extraction.

    Government Initiatives for Groundwater and Crop Diversification

    1. Atal Bhujal Yojana: A community led groundwater management scheme in water stressed blocks across seven States, with incentives linked to measured improvement in the water table.
    2. Pradhan Mantri Krishi Sinchayee Yojana, Per Drop More Crop: Funds drip and sprinkler micro irrigation to raise water use efficiency at the farm level.
    3. Crop Diversification Programme: Operates in the original Green Revolution States of Punjab, Haryana and western Uttar Pradesh to shift area from paddy to alternative crops.
    4. Pani Bachao Paisa Kamao: A Punjab scheme paying farmers for electricity saved against a benchmark, converting free power into a metered incentive to pump less.
    5. Direct Seeded Rice incentive: A per acre payment in Punjab for sowing paddy directly rather than transplanting into puddled fields, cutting water use substantially.
    6. Jal Shakti Abhiyan, Catch the Rain: A national campaign for rainwater harvesting and recharge structure creation in water stressed districts.
    7. National Food Security Mission and the National Mission on Edible Oils: Support pulses and oilseeds as area substitutes for paddy through seed, input and market interventions.

    Key Facts about Groundwater and Punjab Agriculture

    1. Extraction stage: Punjab has the highest stage of groundwater extraction among Indian States, exceeding the annual recharge by a wide margin.
    2. Over exploited units: A large majority of Punjab’s assessment blocks are classified as over exploited by the Central Ground Water Board.
    3. Tubewell density: Punjab operates well over a million agricultural tubewells, nearly all running on subsidised or free power.
    4. Paddy water requirement: Transplanted paddy consumes several thousand litres of water per kilogram of grain, the highest among Punjab’s field crops.
    5. Procurement share: Punjab and Haryana together account for a dominant share of central wheat procurement and a large share of rice procurement.
    6. Green Revolution origin: Punjab was the first State where high yielding wheat varieties were introduced in the mid 1960s, establishing the wheat and paddy rotation.
    7. The 2009 legal shift: The Punjab Preservation of Subsoil Water Act, 2009 pushed paddy transplanting to mid June to align it with the monsoon onset.

    Challenges in Groundwater Management in India

    1. Legal treatment of groundwater as private property: Ownership attached to land under the Indian Easements Act, 1882 makes extraction limits hard to enforce. e.g. the absence of any cap on the number of tubewells a landowner may sink in most States.
    2. Free or heavily subsidised farm power: Zero marginal cost pumping removes the economic brake on extraction. e.g. Punjab, Haryana and Tamil Nadu supplying agricultural power free or at a nominal flat rate.
    3. Minimum support price incentives skewed to water intensive crops: Assured procurement concentrates in paddy and wheat and pulls area toward them. e.g. paddy area in Punjab reaching a record high in 2026 despite falling water tables.
    4. Weak metering and monitoring of extraction: Without volumetric measurement, regulation cannot be calibrated. e.g. the very small share of agricultural connections in the northern States that carry functioning energy meters.
    5. Aquifer contamination alongside depletion: Falling water tables concentrate geogenic contaminants and draw in poor quality water. e.g. arsenic in the Gangetic plains and fluoride in parts of Rajasthan and Telangana.
    6. Fragmented institutional responsibility: Water is a State subject while the regulatory authority is central, producing overlapping mandates. e.g. Central Ground Water Authority notifications applying to industry while agricultural extraction stays outside their reach.
    7. Poor uptake of micro irrigation: Capital cost and small holding size limit the spread of drip and sprinkler systems. e.g. micro irrigation covering only a small fraction of Punjab’s net sown area despite years of subsidy.

    Way Forward

    1. Extend assured procurement to substitute crops: Guarantee purchase of maize, pulses and oilseeds in Punjab at announced prices so the switch out of paddy carries no income penalty.
    2. Convert free power into a measured entitlement: Scale the Pani Bachao Paisa Kamao model, paying farmers for unused power rather than withdrawing the subsidy outright.
    3. Meter agricultural extraction: Install energy or volumetric meters on tubewells to make regulation and incentive design possible.
    4. Fund micro irrigation at scale: Raise the subsidy and credit support for drip and sprinkler systems to cover small holdings.
    5. Build processing and cold chain capacity: Locate processing units for maize, kinnow, potato and dairy in Punjab to create local demand for diversified output.
    6. Enact a groundwater law based on public trust: Adopt the Model Bill for Conservation, Protection and Regulation of Groundwater so extraction rights derive from a shared resource rather than land title.
    7. Link central assistance to measured water table outcomes: Extend the Atal Bhujal Yojana incentive design, so State transfers respond to verified improvement in the aquifer.

    “[2021, GS3, 15 marks] What are the present challenges before crop diversification? How do emerging technologies provide an opportunity for crop diversification?”

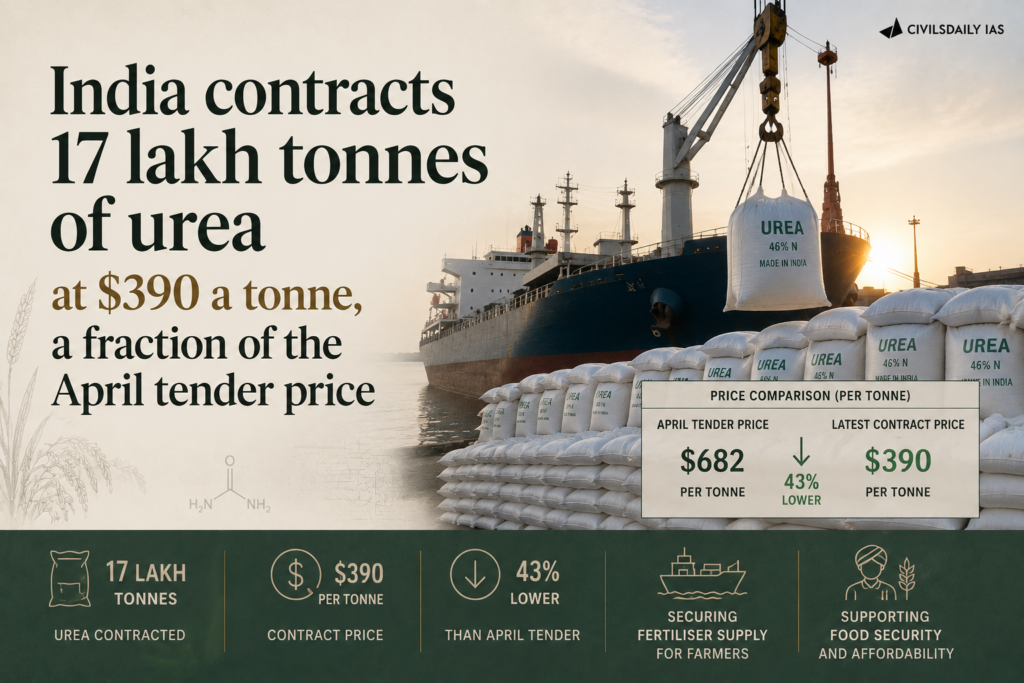
  • India contracts 17 lakh tonnes of urea at $390 a tonne, a fraction of the April tender price

    Why in the News?

    India has contracted 17 lakh tonnes (1.7 mt) of imported urea at landed prices of $390.25 to $393.65 per tonne, marking a ~58% drop from the peak rates of $935 to $959 per tonne seen in the April 2026 tender. This sharp collapse highlights how heavily India’s fertiliser subsidy bill depends on external factors, ranging from West Asian energy disruptions to Chinese inventory accumulation.

    Global Urea Import Tender Mechanism

    • Nominated State Agencies: Import tenders are invited by designated state-owned canalising agencies like Rashtriya Chemicals and Fertilizers (RCF) and Indian Potash Limited (IPL).
    • Landed Price (CFR): Offers are quoted on a landed basis—covering both material cost and ocean freight to destination ports. This shifts shipping risk to the supplier.
    • Geographical Distribution: Tenders split required tonnages between the East Coast and West Coast to optimize port discharge and domestic logistics.
    • Market Signals: Bids from multiple global traders (e.g., Ameropa Group) establish the benchmark. High oversubscription indicates a loose global supply market.

    Price Trajectory & Global Supply Dynamics

    1. April Peak ($935–$959/tonne): Driven by peak war risk premiums, high global fuel prices, and Strait of Hormuz shipping anxieties.
    2. May Moderation ($444.9–$449.3/tonne): Easing immediate supply shocks.
    3. July/August Drop ($390.25–$393.65/tonne): Triggered by:
      • China’s Surplus Inventory: Domestic in-plant inventories in China surged 76% year-on-year, turning it into a major swing supplier.
      • Re-routed Supplies: Iranian material reaching markets through China.
      • Alternative Sourcing: Diversification of LNG feedstock by agencies like GAIL and IOC away from Hormuz transit routes toward the US, Oman, Norway, Angola, Congo, Indonesia, and Trinidad.

    Current Supply & Demand Position

    • Adequate Reserves: Imports reached 25.08 lakh tonnes in Q1 (April–June 2026) compared to 8.38 lakh tonnes in the previous year.
    • Domestic Production: Expanded to 71.53 lakh tonnes in Q1 2026.
    • Cropping Seasons Covered: Sufficient availability reported across both the ongoing Kharif (monsoon) season and upcoming Rabi (winter/spring) sowing.

    Challenges in India’s Fertiliser Policy

    • Subsidy Exposure: Urea sells at a statutorily controlled Maximum Retail Price (MRP), meaning any surge in landed cost directly increases the exchequer’s subsidy burden.
    • Nutrient Imbalance: Controlled urea pricing versus decontrolled phosphatic and potassic nutrients encourages over-application of nitrogen (N), skewing the ideal 4:2:1 (N:P:K) ratio.
    • Phosphate Vulnerability: While urea and LNG supply sources have been widened, Di-ammonium Phosphate (DAP) and raw intermediates (phosphoric acid, ammonia, sulphur) remain vulnerable to concentrated import sources and price spikes.
    • Feedstock Dependence: Domestic plants remain tied to imported LNG, linking production costs directly to international gas trends.

    Statutory & Regulatory Framework

    • Essential Commodities Act, 1955: Empowers the Union Government to regulate production, stock limits, supply, and pricing of fertilisers.
    • Fertiliser (Control) Order, 1985 & Movement Control Order, 1973: Governs quality standards, dealer registrations, and inter-state distribution.
    • New Urea Policy, 2015: Promotes energy efficiency in production units and mandates 100% Neem Coating of domestic urea to prevent industrial diversion.
    • Nutrient Based Subsidy (NBS) Scheme, 2010: Provides a fixed annual per-kg subsidy on N, P, K, and S for decontrolled fertilisers (DAP, MOP, Complex).
    • Direct Benefit Transfer (DBT): Releases subsidies to manufacturers only after Aadhaar-authenticated point-of-sale (PoS) transactions at retail outlets.

    Key Government Initiatives

    • PM PRANAM: Encourages States to reduce chemical fertiliser usage by sharing the resulting subsidy savings.
    • One Nation One Fertiliser: Standardises all subsidised crop nutrients under the single Bharat brand.
    • Nano Urea: Liquid alternative developed by IFFCO to lower overall bulk tonnage requirements.
    • Plant Revivals: Reactivation of closed units (Ramagundam, Gorakhpur, Sindri, Barauni, Talcher) to boost domestic capacity.
    • Coal Gasification: Talcher plant designed to produce urea using coal gasification rather than natural gas, cutting gas import reliance.

    Key Concepts

    • Urea: Solid nitrogenous fertiliser (carbamide) carrying 46% Nitrogen—the highest among solid fertilisers.
    • Di-ammonium Phosphate (DAP): Phosphatic fertiliser containing 18% Nitrogen and 46% Phosphorus.
    • Fertiliser Association of India (FAI): Industry body (est. 1955) providing production, import, and consumption stats for supply planning.
    • Muriate of Potash (MOP): Fully import-dependent nutrient; India has no commercial potash reserves.

    [2020] With reference to chemical fertilizers in India, consider the following statements:
    1. At present, the retail price of chemical fertilizers is market-driven and not administered by the Government.
    2. Ammonia, which is an input of urea, is produced from natural gas.
    3. Sulphur, which is a raw material for Phosphoric acid fertilizer, is a by-product of oil refineries.
    Which of the statements given above is/are correct?
    (a) 1 only
    (b) 2 and 3 only
    (c) 2 only
    (d) 1, 2 and 3
    Answer: (b)”

  • A timely reset for the Food Security Act

    The draft National Food Security (Amendment) Bill, 2026 proposes to link Antyodaya Anna Yojana (AAY) entitlements to household size, opening a new phase in India’s food security debate. The reset exposes a triple tension: correcting the inequity of a flat household ration without reducing existing foodgrain access, while building a pathway from cereal security toward nutrition security amid a rising burden of diabetes and other non-communicable diseases.

    What is the National Food Security Act, 2013?

    1. Definition: The National Food Security Act, 2013 (NFSA) legally guarantees subsidised foodgrains to a large share of the population through the Public Distribution System, treating food as a legal entitlement rather than welfare.
    2. Coverage design: It allows coverage of up to 75% of the rural and 50% of the urban population, split into Priority Households and Antyodaya Anna Yojana households.

    What is the Antyodaya Anna Yojana (AAY) category?

    1. Definition: AAY covers the poorest of the poor households and provides a flat 35 kg of foodgrains per household per month, regardless of household size.
    2. Contrast: Priority Households instead receive 5 kg of foodgrains per person per month, a per-head rather than per-household entitlement.

    Why does the flat AAY entitlement create inequity?

    1. Small households protected: The flat 35 kg shields smaller and highly vulnerable families, such as a widow or an older person living alone.
    2. Large households squeezed: A seven-member AAY household receives only 5 kg per person and an eight-member household about 4.4 kg, below the Priority Household entitlement.
    3. The distortion: Support per person falls as household size rises, inverting the intended pro-poor design.

    What does the draft amendment propose?

    1. Per-person formula: The draft proposes 7 kg of foodgrains per person, capped at 35 kg per household.
    2. Winners and losers: It would reduce support for households with one to four members by 20% to 80%, leave those with five or more members unchanged, and give no AAY household any additional foodgrain.
    3. The design flaw: By reducing rather than raising any allocation, it corrects inequity by levelling down.

    Why does the proposal risk reducing existing access?

    1. Tamil Nadu illustration: The State reports that 15.75 lakh of its 18.64 lakh AAY households, or 84.5%, have fewer than five members.
    2. Allocation cut: The proposal would reduce the State’s monthly AAY allocation from 65,261 tonnes to 42,040 tonnes, a fall of about 35.6%.
    3. Composition matters: A smaller household may include a person with a disability, a widow or an older person living alone, so headcount alone is a poor proxy for need.

    Why must coverage, not just the formula, be reformed?

    1. Outdated ceiling: The NFSA’s 81.35-crore beneficiary ceiling remains based on Census 2011, though about 80 crore people currently receive free foodgrains.
    2. Coverage erosion: Against an estimated population of 146.4 crore in 2025, the ceiling covers only 55.6% of people.
    3. Recalculation needed: The ceiling should be recalculated when Census 2027 figures become available, with accessible inclusion and appeal mechanisms in the interim.

    Why is grain alone not nutrition security?

    1. Uneven child nutrition: NFHS-6 (2023-24) found stunting among under-fives fell from 35.5% to 29.3%, but wasting barely moved from 19.3% to 19.0% and underweight from 32.1% to 31.8%.
    2. Diet inadequacy: Only about 15% of children aged six to 23 months receive a minimally adequate diet.
    3. Double burden: The ICMR-India Diabetes study estimated 101 million Indians had diabetes and 136 million had prediabetes in 2021.
    4. Life-course risk: Maternal undernutrition and low birth weight raise the risk of non-communicable diseases later in life.

    Should the PDS cereal basket be blamed for diabetes risk?

    1. Not a direct cause: Foodgrain entitlement should not itself be equated with diabetes risk.
    2. The real concern: A predominantly cereal-based basket, combined with diets already high in carbohydrates and low in protein, can reinforce dietary imbalance.
    3. Evidence: A 2025 ICMR-INDIAB study of 18,090 adults found carbohydrates supplied 62.3% of daily energy and protein 12%, with the highest carbohydrate intake carrying 30% higher odds of newly diagnosed type 2 diabetes.
    4. Millets caution: Replacing refined cereals with whole-wheat or millet flour was not linked to lower risk when the carbohydrate share stayed high, so more grain or millets alone is not a complete nutrition policy.

    How can diets be diversified without cutting cereals?

    1. Balanced target: The ICMR-NIN 2024 guidelines recommend cereals and millets provide at most 45% of energy, with more from pulses, milk, nuts, vegetables and fruits.
    2. What the PDS can do: The PDS can best supply affordable, shelf-stable foods, with States supported to offer pulses, local rice, wheat, millet choices and healthy edible oils.
    3. Procurement link: Local production and consumption should guide supply chains and effective Minimum Support Price procurement for pulse, millet and oilseed growers.
    4. Programme convergence: Sustained investment should link the PDS, Anganwadi services and Pradhan Mantri Poshan Shakti Nirman (PM POSHAN), providing eggs, milk or suitable alternatives where feasible.
    5. Separate budgeting: Dietary diversification must be separately budgeted, not financed by reducing cereal entitlements, against a food subsidy allocation of Rs 2,27,629 crore in the 2026-27 Union Budget.
    6. Phased pilots: Additions should be tested through State pilots assessing consumption, dietary diversity, anaemia, glycaemic risk, wastage and exclusion.

    How does the delivery network enable this reform?

    1. Digitised last mile: By the end of 2025, 5.50 lakh of 5.51 lakh fair price shops used electronic point-of-sale devices.
    2. Portability: One Nation One Ration Card covered nearly all NFSA beneficiaries, supporting portability and monitoring.
    3. Safeguards needed: Systems must include reliable offline alternatives, assisted or doorstep access for people with limited mobility, and a guarantee that authentication failure will not deny entitled foodgrains.
    4. Nutrition referral: Fair price shops could carry multilingual receipts and messages and, where feasible, link willing adults to diabetes and hypertension services, with over 1.86 lakh Ayushman Arogya Mandirs and 41.3 crore diabetes screenings recorded by June 2026.

    What three safeguards should anchor the reform?

    1. No-loss guarantee: Any per-person formula should preserve the existing 35 kg monthly entitlement for every AAY household.
    2. Periodic review: The adequacy of the 35 kg ceiling should be reviewed for larger and high-dependency households using consumption, nutritional and fiscal evidence.
    3. Separately financed diversification: Dietary diversification must be separately financed and progressively implemented without reducing existing cereal entitlements.

    Conclusion

    The proposed amendment is an opportunity to correct the inequity of a flat AAY ration, but only if it preserves the 35 kg entitlement, assesses the needs of larger households, and finances a gradual transition toward more diverse and nutritious diets. India’s next food security reform must protect people from hunger while addressing the dietary drivers of diabetes, judged not by tonnes of grain moved but by whether vulnerable families can eat enough, eat healthier and obtain their entitlements with dignity.

    Food Security in India (Foundational Context)

    1. About: Food security means physical, economic and social access to sufficient, safe and nutritious food for an active, healthy life.
    2. Scale: The NFSA covers about 80 crore people through the world’s largest food-based safety net.
    3. Progress: The share of households unable to afford the ICMR-NIN recommended diet fell from about 52% in 2011-12 to about 25% in 2023-24, at 25% rural and 21% urban.

    Back2Basics: National Food Security Act, 2013

    1. Coverage: Up to 75% of rural and 50% of urban population.
    2. Entitlement: 5 kg per person per month for Priority Households; 35 kg per household for AAY households.
    3. Woman as head: The eldest woman aged 18 or above is the head of household for ration card issuance.
    4. Maternity and child benefits: Entitlements for pregnant and lactating women and for children through supplementary nutrition programmes.
    5. Grievance redress: State and district-level redress and vigilance mechanisms.

    Statutory Framework Governing Food Security

    1. Article 21: The right to life, read to include the right to food.
    2. Article 47 (DPSP): Duty of the State to raise nutrition levels and the standard of living.
    3. National Food Security Act, 2013: Legal entitlement to subsidised foodgrains.
    4. Essential Commodities Act, 1955: Regulation of production, supply and distribution of essential commodities.

    Government Initiatives for Food and Nutrition Security

    1. Public Distribution System: Distribution of subsidised foodgrains through fair price shops.
    2. PM POSHAN: Hot cooked meals for schoolchildren.
    3. Anganwadi and ICDS: Supplementary nutrition for young children and pregnant or lactating women.
    4. One Nation One Ration Card: Portable ration access across States.
    5. Pradhan Mantri Garib Kalyan Anna Yojana: Free foodgrains scheme scaling the NFSA entitlement.

    Key Facts about Food Security

    1. PoS coverage: 5.50 lakh of 5.51 lakh fair price shops digitised by end 2025.
    2. Diabetes burden: 101 million diabetics and 136 million prediabetics estimated in 2021.
    3. Guideline: ICMR-NIN 2024 caps cereals and millets at 45% of dietary energy.

    Challenges in Food and Nutrition Security

    1. Cereal-heavy basket: High carbohydrate share crowding out protein and micronutrients.
    2. Double burden: Coexistence of undernutrition and rising non-communicable diseases.
    3. Outdated coverage: Beneficiary ceiling frozen at Census 2011.
    4. Exclusion errors: Authentication failures and mobility barriers at the last mile.
    5. Fiscal pressure: Large and rising food subsidy bill.
    6. Procurement skew: MSP concentrated in rice and wheat over pulses and oilseeds.

    Way Forward

    1. No-loss safeguard: Legally protect the 35 kg AAY entitlement in any new formula.
    2. Update coverage: Recalculate the ceiling on Census 2027 with accessible appeals.
    3. Diversify diets: Separately fund pulses, millets and healthy oils in the PDS.
    4. Converge programmes: Link PDS, Anganwadi and PM POSHAN for nutrition delivery.
    5. Pilot before scale: Test additions through phased State pilots measuring nutrition and fiscal outcomes.

    Previous Year Question

    [2018] With reference to the provisions made under the National Food Security Act, 2013, consider the following statements:

    1. The families coming under the category of ‘below poverty line (BPL)’ only are eligible to receive subsidised food grains.

    2. The eldest woman in a household, of age 18 years or above, shall be the head of the household for the purpose of issuance of a ration card.

    3. Pregnant women and lactating mothers are entitled to a ‘take-home ration’ of 1600 calories per day during pregnancy and for six months thereafter.

    Which of the statements given above is/are correct?

    (a) 1 and 2

    (b) 2 only

    (c) 1 and 3

    (d) 3 only

    [2021 GS3 15m] What are the salient features of the National Food Security Act, 2013? How has the Food Security Bill helped in eliminating hunger and malnutrition in India?”

  • Proposed food security amendment could hurt the poorest

    Why in the News

    The Union government has proposed replacing the fixed 35kg monthly foodgrain quota for Antyodaya Anna Yojana households with a 7kg per-person entitlement. This proposed amendment to the National Food Security Act, 2013 could hurt the poorest households by converting a fixed household ration into a per capita entitlement. The tension is between per capita fairness on paper and the real needs of small, elderly, and vulnerable households.

    What is the Antyodaya Anna Yojana (AAY)?

    1. Targeting: AAY covers the poorest of the poor households under the food security system.
    2. Entitlement: Each AAY household currently receives 35 kg of foodgrain per month, regardless of size.
    3. Zero Cost: Foodgrains are provided completely free of charge to all AAY beneficiaries.
    4. Distribution Channel: Handled via the Targeted Public Distribution System (TPDS) through local fair price shops.
    5. Portability: Access is supported nationwide via systems like One Nation One Ration Card

    Key Beneficiary Groups

    1. Widows, terminally ill, disabled persons, or persons aged 60+ with no support
    2. Single women or men with no regular income or livelihood
    3. Primitive tribal groups
    4. Landless agricultural laborers, marginal farmers, and rural artisans
    5. Daily wage earners and slum dwellers in the informal sector

    What does the proposed amendment change?

    1. Per capita shift: The household entitlement would be replaced by a per capita quota of about 7 kg per person. But the total family support cannot go over 35 kg.
    2. Small household hit: A one or two member household would receive far less than the current 35 kg.

    What are the issues with the proposed amendment?

    1. Large families may lose out: The 35-kg ceiling can reduce the effective per-capita entitlement of AAY households with more than five members, weakening the rationale of a family-size-based allocation.
    2. Unequal regional impact: States with relatively larger household sizes, particularly parts of northern India, could face a greater impact from the 35-kg ceiling.
    3. Cereal-centric approach: Linking food security primarily to cereal quantities overlooks the need for protein, pulses, fats and dietary diversity for nutritional security.
    4. No wider concerns addressed: The amendment does not address wider concerns over outdated NFSA coverage, biometric failures and access barriers in the Public Distribution System.
    5. Exclusion remains unaddressed: Revising the entitlement formula does not resolve the larger problem of eligible beneficiaries remaining outside the PDS due to outdated population estimates and identification gaps.

    Who is most exposed to the change?

    1. Elderly and widows: Single member and elderly headed households lose the most.
    2. Vulnerable groups: Particularly Vulnerable Tribal Groups (PVTGs) and small families face sharp cuts.
    3. Large AAY households among the poorest sections: Particularly families with six or more members, are likely to face the greatest disadvantage.

    What principle is at stake?

    1. Adequacy over arithmetic: A per head formula ignores that small poor households have high fixed food needs.
    2. Substantive equality in food security is at stake: A uniform ceiling may appear administratively simple, but it can produce unequal outcomes for households with different sizes and vulnerabilities.

    Conclusion

    The central idea is that a per capita rule can look equal yet strip protection from the smallest households. Whether the amendment proceeds, and with what safeguard for small households, remains open.

    PYQ Relevance

    [UPSC 2021] What are the salient features of the National Food Security Act, 2013? How has the Food Security Bill helped in eliminating hunger and malnutrition in India?

    Linakge: The PYQ examines the NFSA’s role in ensuring food security and addressing hunger and malnutrition. The proposed AAY reform raises questions about whether changes in foodgrain entitlements can preserve the NFSA’s objective of adequate and equitable food security for vulnerable households.

  • El Nino and hoarding push up Karnataka rice prices

    Why in the News

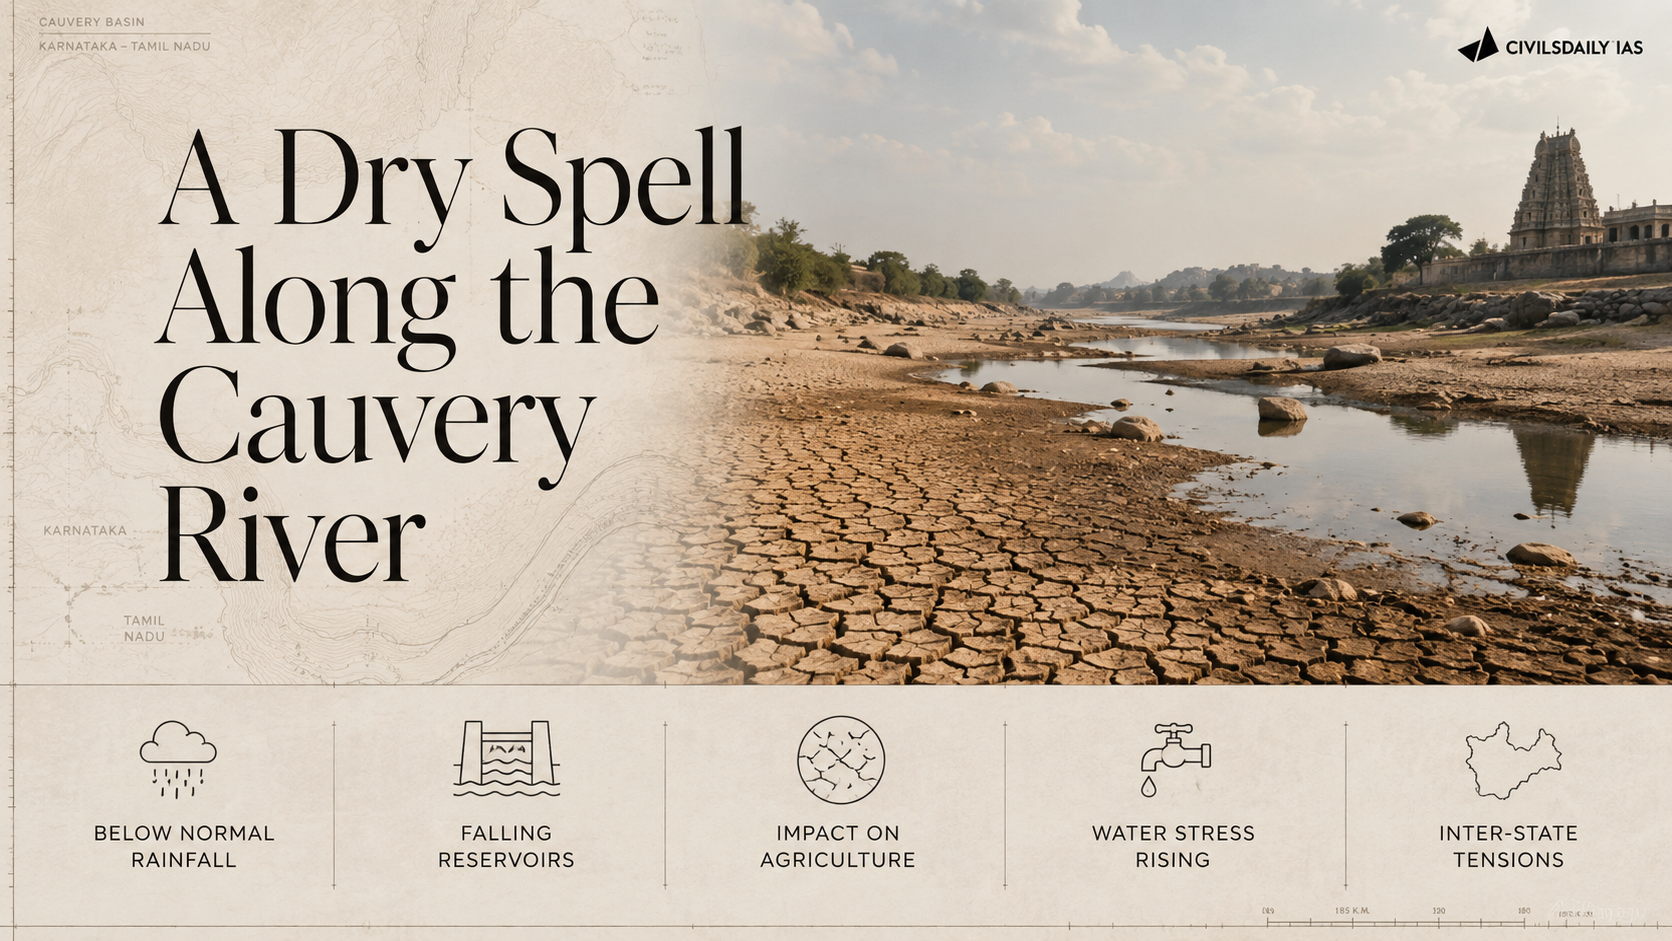
    Deficit June to July rainfall, linked to El Niño, along with hoarding and war driven demand, pushed up rice prices in Karnataka while kharif paddy sowing remained below target. The episode highlights the vulnerability created by water intensive paddy cultivation during drought conditions.

    What drove the shock?

    • Rainfall deficit: El Niño associated dry conditions affected monsoon rainfall.
    • Low sowing: Paddy acreage remained below the kharif target.
    • Reservoir stress: Low storage reduced irrigation availability.
    • Tungabhadra canal breach: Further disrupted water supply.

    Why is Paddy Water Intensive?

    • Conventional transplanted rice requires substantial water, particularly during crop establishment.
    • Dependence on irrigation reservoirs makes paddy cultivation vulnerable to drought and declining storage.
    • Concentration of paddy in water stressed regions can create a water-energy-food nexus problem.

    Sustainable Alternatives

    1. Direct Seeded Rice (DSR)

    • Seeds are sown directly instead of raising and transplanting seedlings.
    • Reduces water and labour requirements.
    • Avoids prolonged standing water associated with conventional transplantation.

    2. Crop Diversification

    • Shift from paddy towards relatively less water intensive crops such as jowar, bajra, pulses and oilseeds.
    • Can improve water-use efficiency and climate resilience.

    3. Micro-irrigation and Water Management

    • Efficient irrigation, laser land levelling, rainwater harvesting and improved farm water management can reduce water wastage.

    MSP Dimension

    • Paddy receives MSP support, providing farmers with a price assurance mechanism.
    • For 2026-27, the MSP for paddy (common) is ₹2,441/quintal.
    • However, assured prices can also influence farmers to continue cultivating water intensive crops even in water stressed regions.

    “[2019] With reference to the cultivation of Kharif crops in India in the last five years, consider the following statements:
    1. Area under rice cultivation is the highest.
    2. Area under the cultivation of jowar is more than that of oilseeds.
    3. Area of cotton cultivation is more than that of sugarcane.
    4. Area under sugarcane cultivation has steadily decreased.
    Which of the statements given above are correct?
    (a) 1 and 3 only
    (b) 2, 3 and 4 only
    (c) 2 and 4 only
    (d) 1, 2, 3 and 4
    Answer: (a)”

  • Why the Iran war didn’t cause a fertiliser crisis

    Why in the News?

    The United States-Israel versus Iran war and the effective closure of the Strait of Hormuz triggered a severe global energy supply shock, yet India’s urea supply held up. Government-pushed diversification of liquefied natural gas (LNG) sourcing lifted urea output to 71.5 lakh tonnes in April-June 2026, up 5.4% year-on-year. The contrast is that the same proactiveness was not replicated for phosphatic fertilisers, leaving di-ammonium phosphate and complex fertilisers exposed.

    What are the main fertiliser nutrients?

    1. Nutrient roles: Urea supplies nitrogen (N); di-ammonium phosphate (DAP) supplies phosphorus (P); muriate of potash (MOP) supplies potassium (K). Complex fertilisers blend N, P, K and sulphur (S).
    2. Feedstock links: Urea depends on natural gas as feedstock. DAP and complex fertilisers depend on phosphoric acid, sulphur and ammonia.

    What kept urea supply stable through the shock?

    1. Feedstock disruption: Before the war, 53-54% of India’s LNG imports came from Qatar and the United Arab Emirates. Shipping blockades and strikes on liquefaction infrastructure broke these contracts.
    2. Sourcing pivot: The government pushed public firms to diversify LNG sourcing, buying more from the United States, Oman, Nigeria, Angola and others. This pivot to the spot market meant higher prices but secured supply.
    3. Output recovery: Urea production fell to 17.5 lakh tonnes in March 2026 from 24.7 lakh tonnes a year earlier, then recovered to 25.4 lakh tonnes by June. Cumulative April-June output of 71.5 lakh tonnes exceeded the previous year.
    4. Import surge: India imported 25.1 lakh tonnes of urea in April-June 2026, up from 8.4 lakh tonnes a year earlier. Higher import costs were not passed on to farmers.

    Why did DAP and complex fertilisers stay tight?

    1. Sulphur bottleneck: Sulphur is needed to make sulphuric acid, which breaks down rock phosphate into phosphoric acid. Without both acids, there can be no DAP, single super phosphate or complex fertilisers.
    2. Price spike: Sulphur landed prices reached about $1,100 per tonne against a normal $150-250 range. The spike predated the war, worsened by Ukrainian drone strikes on Russian refineries.
    3. Phosphoric acid costs: Imported phosphoric acid prices rose from $1,055 per tonne in early 2025 to $1,700 for the July-September 2026 quarter. This steady climb squeezed domestic manufacturers.
    4. No diversification: Unlike urea, phosphatic fertiliser sourcing was not widened. Reduced domestic output was combined with lower imports.

    What is the El Nino monsoon factor?

    1. Rainfall deficit: El Nino-induced monsoon deficiency left June-July all-India rainfall 12.6% below normal. Kharif sowing area fell 2.9% from last year.
    2. Subdued demand: Weak rainfall reduced fertiliser offtake, easing pressure on supply. This contrasts with the surplus monsoon scrambles of 2024 and 2025.

    What are the challenges to fertiliser security?

    1. Import dependence: India depends heavily on imports for sulphur, phosphoric acid and ammonia. Concentrated West Asian sources leave it exposed to conflict.
    2. Subsidy pressure: Shielding farmers from higher costs inflates the fertiliser subsidy bill beyond budget estimates. Sustaining it requires additional provisions for DAP and complex fertilisers.
    3. Single-choke geography: Much feedstock still transits the Strait of Hormuz. A single choke point can disrupt multiple nutrients at once.
    4. Phosphate concentration: Few global suppliers dominate phosphoric acid and sulphur. Price-setting power rests with them during shortages.
    5. Election-linked stocking: Upcoming State elections raise pressure to guarantee rabi-season supply. Political timelines complicate purely economic supply planning.

    Conclusion

    Proactive supply-side management, chiefly LNG diversification and pre-emptive urea imports, insulated India’s nitrogen supply from the worst energy shock in decades. The unresolved vulnerability is phosphatic and complex fertilisers, where sulphur and phosphoric acid sourcing was not diversified and prices continue to climb.

    Back2Basics

    1. Urea: Nitrogen fertiliser made from natural gas; the most consumed fertiliser in India and heavily subsidised.
    2. DAP: Di-ammonium phosphate, a phosphorus source dependent on imported phosphoric acid.
    3. Nutrient Based Subsidy: Regime under which non-urea fertilisers (DAP, MOP, complex) receive a fixed per-nutrient subsidy.
    4. Urea pricing: Sold at a statutory notified price with the gap met by subsidy under the Department of Fertilizers.
    5. Key choke point: Strait of Hormuz, the transit route for much of India’s LNG and fertiliser feedstock.

    The New Urea Policy 2015:

    1. It aims to maximize domestic production, promote energy efficiency in manufacturing units, and rationalize government subsidy burdens.

    Core Objectives

    1. Boost Domestic Output: Increase indigenous manufacturing capacity to reduce reliance on foreign imports.
    2. Energy Conservation: Set strict specific energy consumption targets for production units to lower carbon footprints.
    3. Subsidy Rationalization: Streamline financial support and cut down government expenditure on the sector.

    Key Measures

    1. Neem Coating: Mandated all domestic producers to coat 100% of subsidized urea with neem oil, stopping illegal diversion to non-agricultural sectors.
    2. Energy Grouping: Categorized gas-based plants into distinct groups to fix realistic and progressive energy efficiency norms.
    3. Protected Pricing: Ensured continuous and timely supply of fertilizer to farmers without increasing the retail price

    PYQ Relevance

    [UPSC 2023] What are the direct and indirect subsidies provided to farm sector in India? Discuss the issues raised by the World Trade Organization (WTO) in relation to agricultural subsidies.

    Linkage: UPSC has consistently examined agricultural subsidies, their fiscal implications, and India’s compliance with WTO rules. The article shows how rising global fertiliser and LNG prices increase India’s subsidy burden while the government continues to shield farmers through subsidised urea and nutrient-based support for non-urea fertilisers