💥Crack UPSC In 1st Attempt | Admission Open | Ultimate Assessment Program 2027/2028

Subject: Agriculture

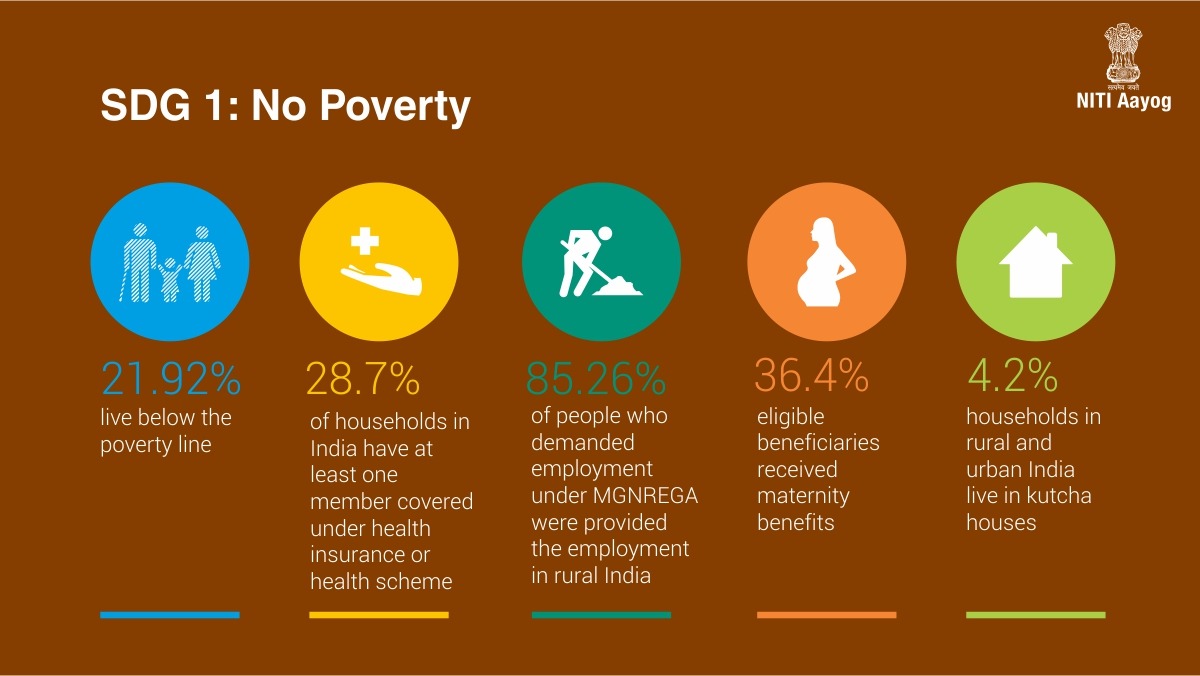
  • Poverty Estimate using National Family Health Survey

    Poverty

    Context

    • The recent release of the National family health survey (NFHS) data for 2019-21 allows for a detailed analysis of the progress in the reduction of absolute poverty and related determinants like nutrition.

    Poverty estimation in India

    • Planning Commission Expert Group (1962): It formulated the separate poverty lines for rural and urban areas at ₹20 and ₹25 per capita per year respectively.
    • VM Dandekar and N Rath (1971): They made the first systematic assessment, based on National Sample Survey (NSS) data. They suggested providing 2250 calories per day in both rural and urban areas.
    • YK Alagh Committee (1979): It constructed a poverty line for rural and urban areas on the basis of nutritional requirements and related consumption expenditure.
    • Lakdawala Committee (1993): It suggested that consumption expenditure should be calculated based on calorie consumption as earlier. State specific poverty lines should be constructed. It asked for discontinuation of scaling of poverty estimates based on National Accounts Statistics.
    • Tendulkar Committee (2009): The current official measures of poverty are based on the Tendulkar poverty line, fixed at daily expenditure of ₹27.2 in rural areas and ₹33.3 in urban areas is criticized by many for being too low.
    Poverty

    How poverty is estimated under NFHS?

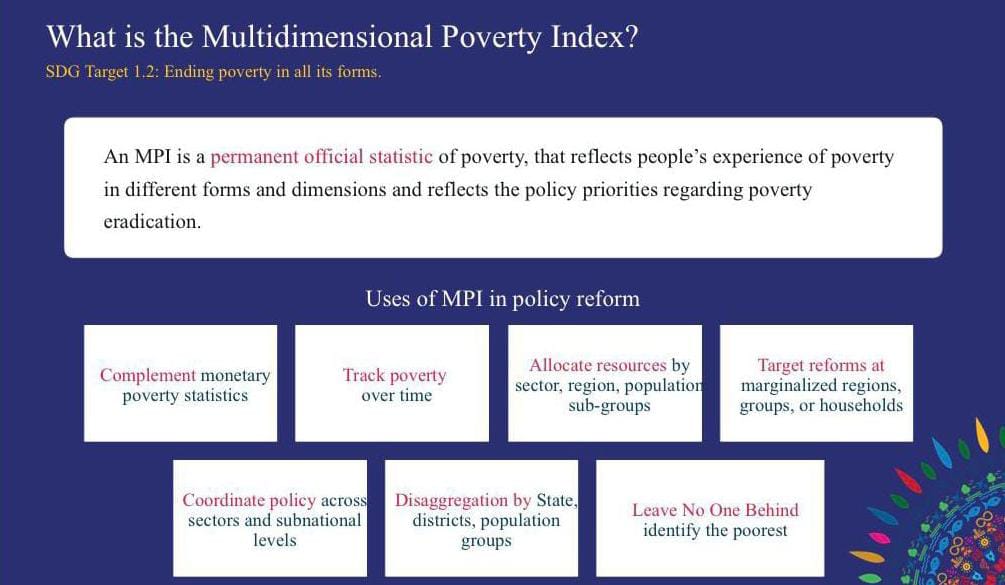
    • Multidimensional poverty index: The NFHS surveys are part of a multinational attempt to provide estimates of a multidimensional poverty index. Its computation rests on estimates of poverty according to 10 different indicators:
    1. Nutrition
    2. Child mortality
    3. Years of schooling
    4. School attendance
    5. Cooking fuel
    6. Sanitation
    7. Drinking water
    8. Electricity
    9. Housing
    10. Assets
    • The deprivation index: the deprivation index for each indicator is the per cent poor (deprived) according to that indicator. The aggregation of the 10 indicators into one index involves legitimate issues of weighting, but individual components do not suffer from this drawback.
    Poverty

    What are the findings of NFHS?

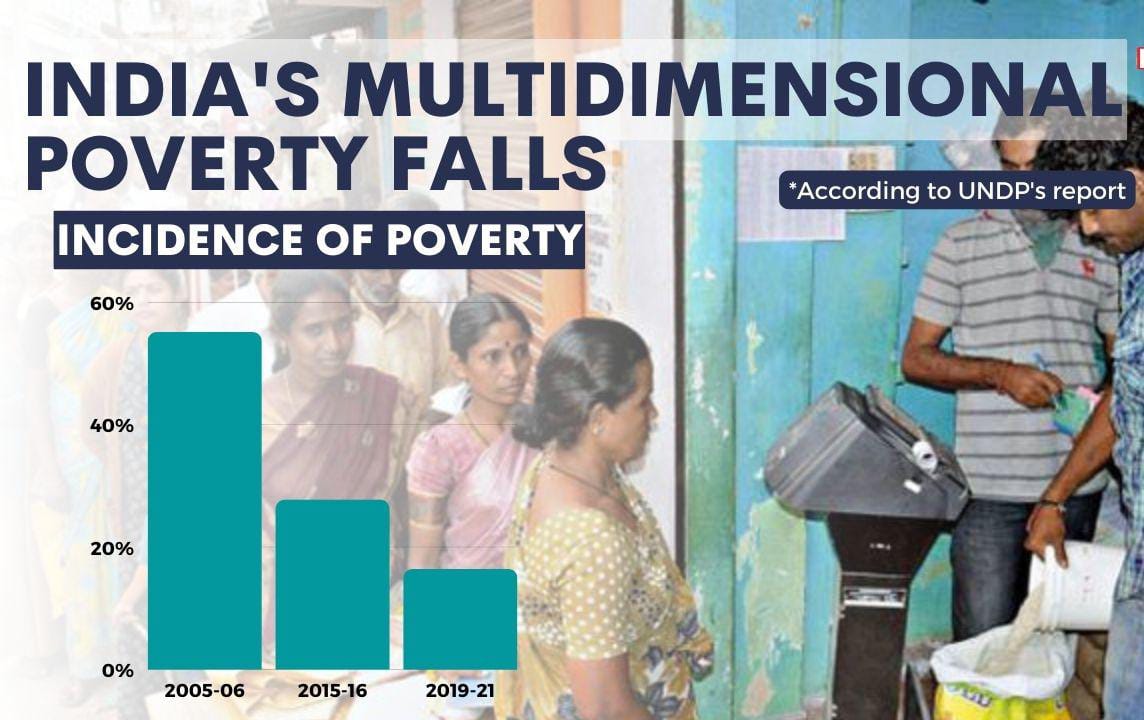
    • Multidimensional poverty declined: at a compounded annual average rate of 4.8 per cent per year in 2005-2011 and more than double that pace at 10.3 per cent a year during 2011-2021.
    • Declining child mortality: There are some issues with the 2011 child-mortality data, but for each of the 10 components of the MPI index, the rate of decline in 2011-2021 is considerably faster than in 2005-2011.
    • Average decline in overall indicators: The average equally weighted decline for nine indicators was 1.9 per cent per annum in 2005-2011 and a rate of 16.6 per cent per annum, more than eight times higher in 2011-2021.
    • Consumption inequality decline: Every single household survey or analysis has shown that consumption inequality declined during 2011-2021. This is consistent with the above finding of highly inclusive growth during 2011-2021.
    Poverty

    What are the efforts behind inclusive growth and reduced poverty?

    • A major factor behind the inclusive nature of growth during 2011-2021 is the focus of government policies on each of the individual indicator’s indicative of a dignified standard of living. A direct impact of this dedicated fiscal push is that slow-moving variables such as housing, access to cooking fuel, sanitation, etc, have witnessed a remarkable increase.
    • Swachh Bharat Mission: The government’s Swachh Bharat mission in 2014-2021 constructed over 110 million toilets even if some were without easy access to water, many were.
    • Saubhagya Yojana: Similarly, close to one-third of Indians were deprived of electricity till as recently as 2014. It was only after a dedicated push (Saubhagya Yojana) that India managed to electrify every village, and eventually households. Electricity deprivation declined by a 28.2 per cent rate post-2014; between 2005 and 2011, the rate of decline was close to zero.
    • Jan Dhan Yojana: Another example is the Jan Dhan Yojana which made financial inclusion a reality in India, especially for women.
    • Ujjwala Yojana: On access to modern cooking fuel (through the Ujjwala Yojana), deprivation was nearly halved from 26 per cent to 14 per cent in just five years. The previous halving (2005/6 to 2015/16) took 10 years.
    • Awas Yojana: The affordable housing scheme (Awas Yojana) has meant that less than 14 per cent are now deprived, compared to thrice that number in 2011/12.
    • Jal Jeevan Mission: More recently, government has embarked on an ambitious project of ensuring universal access to piped water under the Jal Jeevan Mission. Rural piped water coverage was a little less than 17 per cent in 2019, but is now well above 54 per cent and expected to at least be near, if not meet, the 100 per cent target by 2024.

    Conclusion

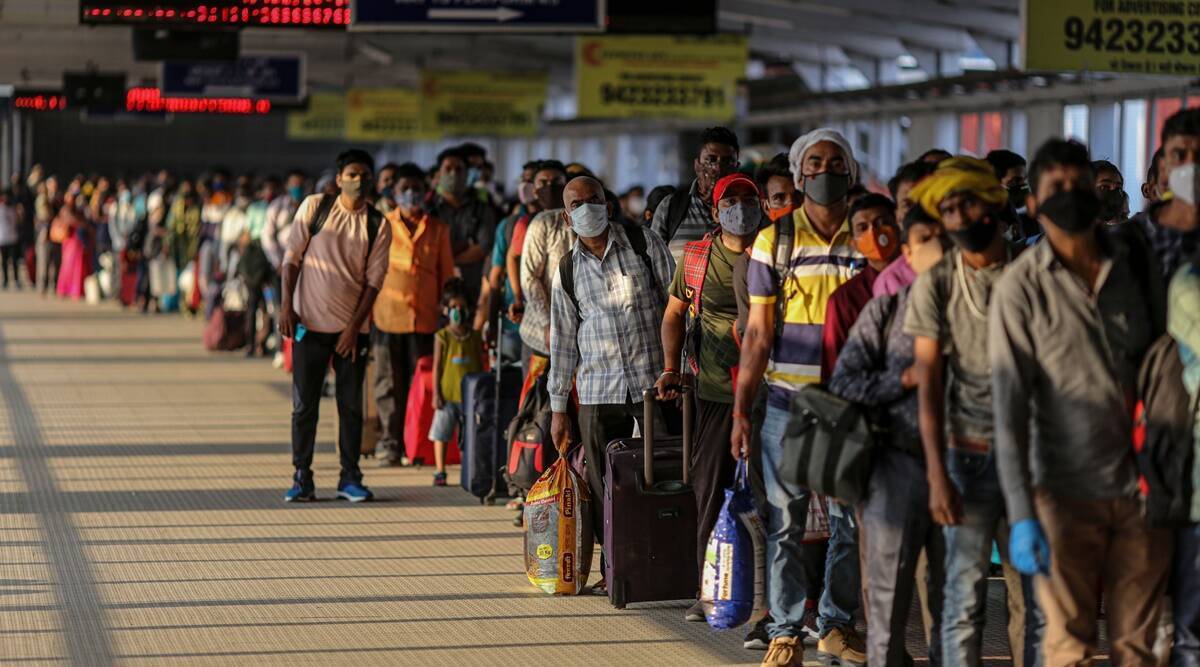
    • Extreme poverty in India is surely on decline but pandemic have pushed people again back to the poverty. Pandemic have put the break on inclusive growth of people. Government must realize these and plan accordingly.

    Mains Question

    Q. Analyze the data of NFHS for poverty estimation in India? How government policies have helped to reduce the extreme poverty in India?
    Click and Get your FREE copy of Current Affairs Micro notes

  • GI tag in news: Kashmir Saffron

    saffron

    The Directorate of Tourism, Kashmir has organised a saffron festival in the Karewa of Pampore.

    Saffron

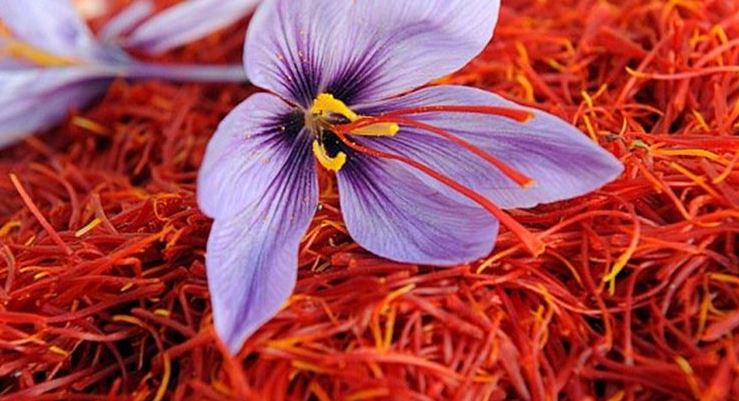
    • Saffron is a spice derived from the flower of Crocus sativus, commonly known as the “saffron crocus”.
    • The vivid crimson stigma and styles, called threads, are collected and dried for use mainly as a seasoning and colouring agent in food.

    Kashmir Saffron

    • It is cultivated and harvested in the Karewa (highlands) in some regions of Kashmir, including Pulwama, Budgam, Kishtwar and Srinagar.
    • It has been associated with traditional Kashmiri cuisine and represents the rich cultural heritage of the region.
    • Its cultivation is believed to have been introduced in Kashmir by Central Asian immigrants around 1st Century BCE. In ancient Sanskrit literature, saffron is referred to as ‘bahukam’.
    • In 2020, the Centre issued a certificate of Geographical Indication (GI) registration for Saffron grown in the Kashmir Valley.

    Major types

    The saffron available in Kashmir is of three types —

    • ‘Lachha Saffron’, with stigmas just separated from the flowers and dried without further processing;
    • ‘Mongra Saffron’, in which stigmas are detached from the flower, dried in the sun and processed traditionally; and
    • ‘Guchhi Saffron’, which is the same as Lachha, except that the latter’s dried stigmas are packed loosely in air-tight containers while the former has stigmas joined together in a bundle tied with a cloth thread

    Whats’ so special about Kashmir Saffron?

    • The unique characteristics of Kashmir saffron are its longer and thicker stigmas, natural deep-red colour, high aroma, bitter flavour, chemical-free processing, and high quantity of crocin (colouring strength), safranal (flavour) and picrocrocin (bitterness).
    • It is the only saffron in the world grown at an altitude of 1,600 m to 1,800 m AMSL (above mean sea level), which adds to its uniqueness and differentiates it from other saffron varieties available the world over.

    Policy moves

    • The National Saffron Mission (launched as a part of Rashtriya Krishi Vikas Yojana) was sanctioned by the central government in the year 2010 in order to extend support for creation of irrigation facilities.
    • It seeks to facilitate farmers with tube wells and sprinkler sets which would help in production of better crops in the area of saffron production.
    • North East Centre for Technology Application and Reach (NECTAR) under Saffron Bowl Project has identified few locations in Arunachal Pradesh and Meghalaya for saffron cultivation.


    Click and get your FREE copy of Current Affairs micro notes

  • Green Signal to GM Mustard

    MustardContext

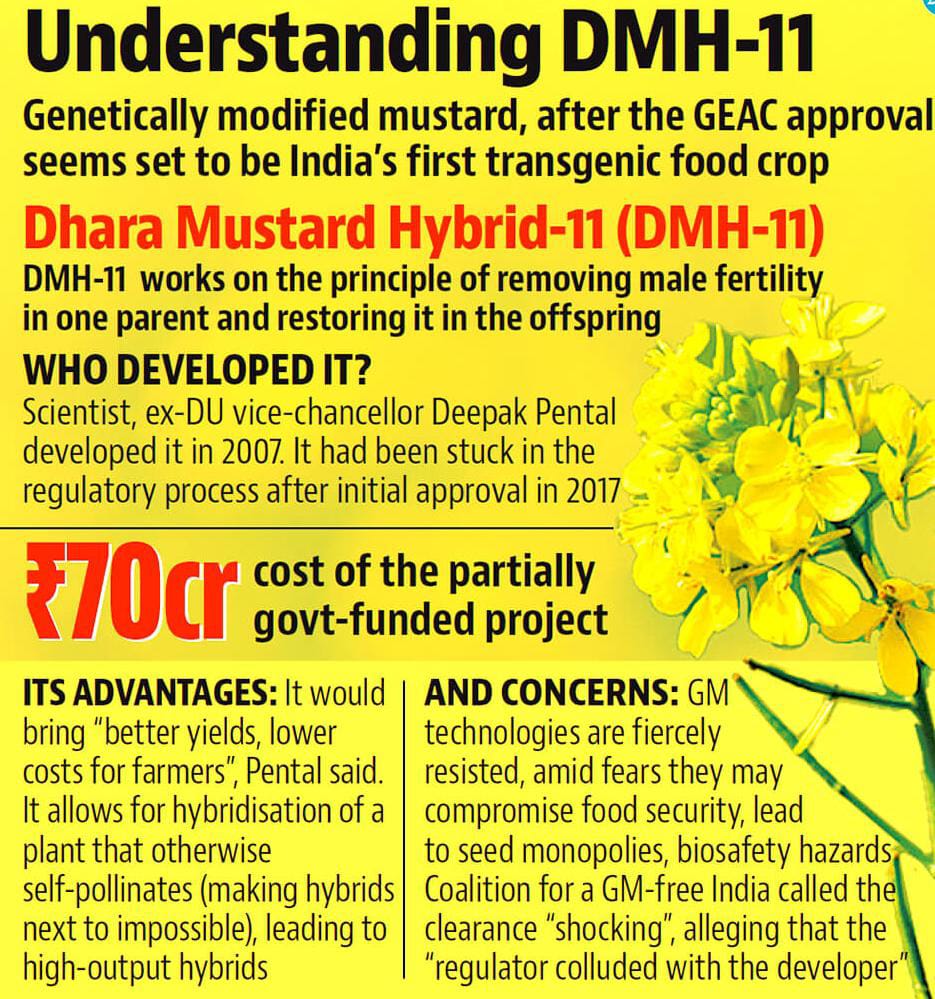
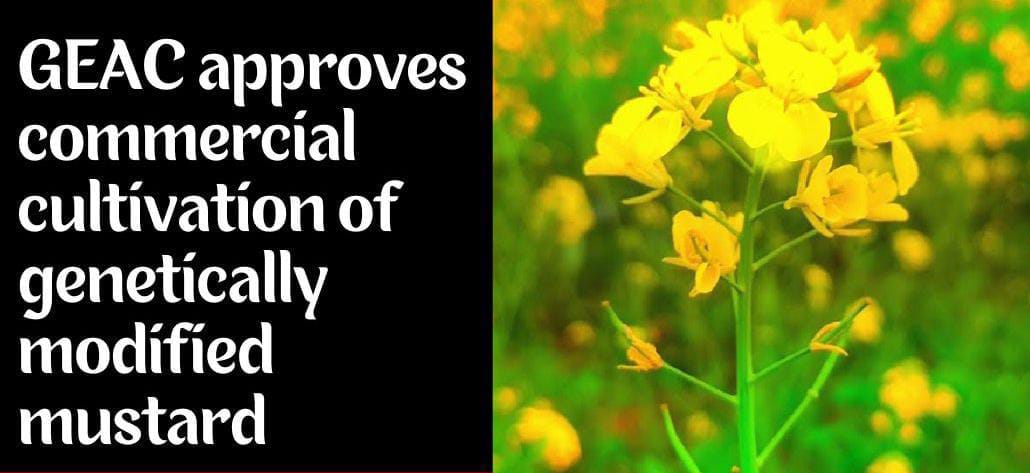
    • The recent clearance by the government for the release of GM Mustard Hybrid DMH 11 based on the recommendations of GEAC under the Ministry of Environment, Forests and Climate Change is a bold decision in the best interest of our farmers and the nation.

    What are Genetically modified organisms (GMO)

    • Changes in genetic material: GMOs can be defined as organisms (i.e., plants, animals or microorganisms) in which the genetic material (DNA) has been altered in a way that does not occur naturally by mating and/or natural recombination
    • Transfers of genes: It allows selected individual genes to be transferred from one organism into another, also between nonrelated species.
    • GM foods: Foods produced from or using GM organisms are often referred to as GM foods
    • GM Mustard: GM mustard crop was introduced, which was later withdrawn. There is a raging debate going on advantages and disadvantages of GMOs. For a long time, further study was requested by farmers, environmentalist on GMO crops.

    MustardAdvantages of GM mustard?

    • Benefits to producers and consumers: GM foods are developed and marketed because there is some perceived advantage either to the producer or consumer of these foods. This is meant to translate into a product with a lower price, greater benefit (in terms of durability or nutritional value) or both. Initially GM seed developers wanted their products to be accepted by producers and have concentrated on innovations that bring direct benefit to farmers (and food industry generally)
    • Improves crop protection: One of the objectives for developing plants based on GM organisms is to improve crop protection.
    • Insect Resistance: Some GMO foods have been modified to make them more resistant to insects and other pests. This means the amount of pesticide chemicals used on the plants are reduced, so their exposure to dangerous pesticides is also reduced
    • Develops stronger Crop: Another benefit that GM technology is believed to bring about is that crops can be engineered to withstand weather extremes and fluctuations, this means that there will be good quality and sufficient yields even under a poor or severe weather condition
    • Provides Environment Protection: GM crops often requires less time, tools and chemicals, and may help with reducing greenhouse gas emissions, soil erosion and environmental pollution
    • More Nutritious Foods: According to the UN Food and Agricultural Organization (FAO), some GM foods have been engineered to become more nutritious in terms of vitamin or mineral content.
    • More economic benefits: Larger production leading to increased farm income, reduced poverty, low food prices and thus reduced hunger and malnutrition. Besides new food products are also included, diversifying food varieties

    What is the risk associated with GMO?

    • Contamination of genes: GMOs contaminate forever. GMOs cross pollinate and their seeds can travel far and wide.
    • Irreversible changes in gene pool: It is impossible to fully clean up our contaminated gene pool.
    • More herbicides in our food: Genetic engineering allows plants to survive high doses of weed killers, resulting in higher herbicide residues in our food.
    • Super weeds and super bugs: GMO crops are creating ‘super weeds’ and ‘super bugs,’ which can only be killed with more toxic poisons.

    MustardWhy there was necessity to grant approval for GM Mustard?
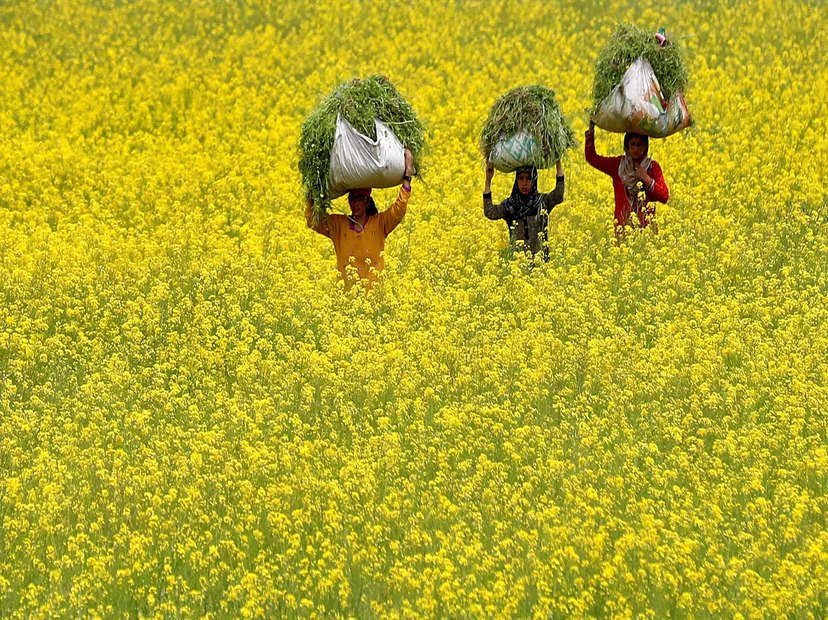
    • To meet our current challenges: Over-exploitation of natural resources (soil, water, biodiversity), declining factor productivity, urgency to achieve sustainable development goals, especially ending poverty and hunger, and addressing timely the adverse effects of climate change the best option is scientific innovations and their scaling.
    • The adoption of GM food crops is in our broader national interest: Genetically modified maize, soybean, cotton, tomato and canola are grown across the world and the area currently under GM crops is about 200 m ha. Besides India, these have been grown for many years in the US, Brazil, Argentina, Canada, Australia, Philippines, Pakistan, Bangladesh, and China.
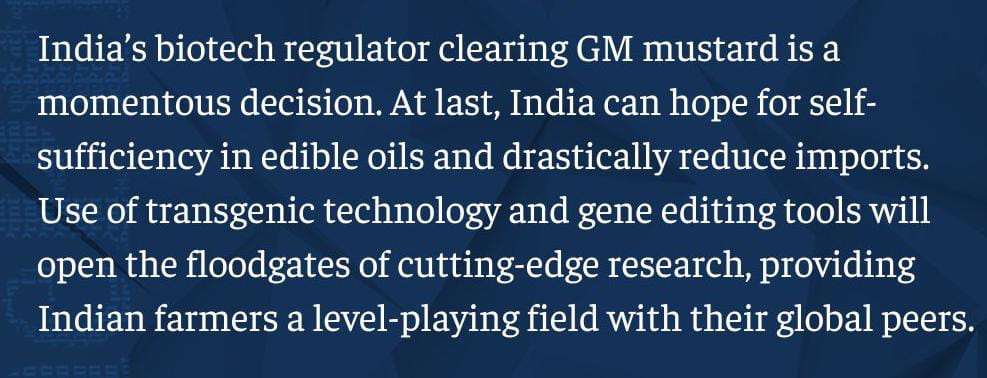
    • To meet the existing deficit in edible oils: India is currently importing around 13 million tonnes at a cost of Rs 1.17 lakh crore to the exchequer. Interestingly, of this, 2.0-2.5 mt soybean oil and 1.0-1.5 mt canola oil is already GM. Hence, we are consuming GM oil already, besides, the 1.5 mt of GM cotton oil produced domestically.
    • Associated health benefits: It is scientifically proven that the consumption of refined oil does not allow any protein to enter the human system. Thus, the consumption of GM oil is completely safe from a health point of view.
    • High yields to farmers: A major concern of our farmers is that yields of mustard are low and have stagnated for a long time at around 1,260 kg/ha, much lower than the global average of 2,000 kg/ha. Yields of canola in Canada, China and Australia are almost three times higher than in India since they use GM hybrid technology. Mustard is a very important oilseed crop, grown in 6.0 -7.0 million hectares, mostly in Rajasthan, Haryana, Punjab and Madhya Pradesh. Thus, the government’s decision to allow the production of GM Mustard hybrids will go a long way in increasing our yields, while reducing the use of pesticides.

    MustardWhat else needs to be done?

    • Providing enabling environment: The Department of Agriculture (DoA) and ICAR need to move forward fast and provide an enabling environment to test the available seed of Hybrid DMH 11 in the current rabi season.
    • Encourage public-private partnership: This needs to happen on several farmers’ fields in the mustard belt. It must also encourage public-private partnerships to produce quality seeds to cover more area next year.
    • Encouraging further innovation: Also, scientists at ICAR institutes must be encouraged to develop new GM Mustard hybrids on a mission mode. Allowing the production of GM Soybean and GM Maize going forward will also be a positive step, increasing both the productivity and profitability of these crops and doubling farmers’ income.

    Conclusion

    • The decision to remove the unscientific ban on GM crops reflects the determination of the government to move towards Atmanirbhar Bharat. It also meets the aspirations of our scientific community and farmers can derive the benefits of innovative technology.

    Mains Question

    Q. How GM mustard crop are different from conventional crops? What are the benefits and risks of adopting the GM mustard crop?

    Click and Get your FREE copy of Current Affairs Micro notes


  • GI in news: Kalanamak Rice

    kalanamak

    Kalanamak, a traditional variety of paddy is all set to get a new look and name.

    Kalanamak Rice

    • Kalanamak rice is a paddy with black husk and strong fragrance, which is considered a gift from Lord Buddha to the people of Sravasti when he visited the region after enlightenment,
    • It is grown in 11 districts of the Terai region of northeastern Uttar Pradesh and in Nepal.
    • The traditional Kalanamak rice is protected under the Geographical Indication (GI) tag
    • It’s recorded in the GI application that Lord Budhha gifted Kalanamak paddy to the people of Sravasti so that they remembered him by its fragrance.

    What is the upgrade?

    • The traditional paddy has been prone to ‘lodging’, a reason for its low yield.
    • Lodging is a condition in which the top of the plant becomes heavy because of grain formation, the stem becomes weak, and the plant falls on the ground.
    • Addressing the problem, the Indian Agriculture Research Institute (IARI) has successfully developed two dwarf varieties of Kalanamak rice.
    • They have been named Pusa Narendra Kalanamak 1638 and Pusa Narendra Kalanamak 1652.

    Back2Basics:  Geographical Indication

    • A GI is a sign used on products that have a specific geographical origin and possess qualities or a reputation that are due to that origin.
    • Nodal Agency: Department for Promotion of Industry and Internal Trade (DPIIT), Ministry of Commerce and Industry
    • India, as a member of the World Trade Organization (WTO), enacted the Geographical Indications of Goods (Registration and Protection) Act, 1999 w.e.f. September 2003.
    • GIs have been defined under Article 22 (1) of the WTO Agreement on Trade-Related Aspects of Intellectual Property Rights (TRIPS) Agreement.
    • GI is granted for a term of 10 years in India. As of today, more than 300 GI tags has been allocated so far in India (*Wikipedia).
    • The tag stands valid for 10 years.


    Click and Get your FREE copy of Current Affairs Micro notes

  • MSP: Must be Effective

    msp

    Context

    • The CACP recommendations on Minimum Support Prices (MSP) for the mandated six Rabi crops wheat, barley, gram, lentil, rapeseed and mustard, and safflower are arrived by considering several factors.

    What is MSP?

    • MSP is a part of India’s Agriculture Price Policy. The MSP for various crops is announced by the central government at the beginning of every crop season on the recommendation of CACP.
    • MSP is price at which the government purchases crops from the farmers. It is the guaranteed ‘minimum floor price’ that farmer must get from the government in case the market price of the crops falls below the MSP.
    • The Rationale behind MSP is to support the farmer from excess fall in the crop prices, it is like an insurance policy for the farmers to save them from price falls.
    • The most important aim of the MSP policy is to save the Indian farmer from making distress sales. In the event of glut and bumper harvest, when market prices fall below the announced MSP, the government through its agencies buys the entire stock offered by the farmers at the MSP.

    What are the factors included in MSP calculation?

    • Factors taken into consideration are as follows:
    1. Cost of production,
    2. Supply and demand situation of various crops in domestic and global markets,
    3. Domestic and world prices along with trade opportunities,
    4. Terms of trade between agriculture and non-agriculture sector,
    5. Optimal utilization of land, water and other production resources,
    6. A minimum of 50 per cent mark-up over the cost of production.

    msp

    Why the relook at MSP calculation is necessary?

    • Though on the surface the list looks comprehensive, there are two missing concerns given the present-day challenges, necessitating a change in the MSP formula.
    1. Acreage
    2. Water usage
    • Rising MSP leads to water conflict: There is ample data-based evidence to show the causal relation between acreage and MSP movements. Rising MSPs of water-intensive crops has resulted in some of the water conflicts over river basins as shown by recent studies in the Cauvery and the Teesta River basins.
    • MSP for rice and wheat: This is also because MSP for rice and wheat, where government agencies like Food Corporation of India play a role in procurement, has created a reference for market prices. Ever since the MSP was introduced in the late 1970s, it became the “floor” price-setter for rice and wheat.
    • Higher MSP for water consuming cereals: Between 1980 and 2000, the MSPs of rice and wheat increased at a much faster rate than those of the “coarse” cereals (like jowar, bajra and ragi) which eventually led to movement of the terms-of-trade (defined as ratio of prices of competing crops, e.g., rice and millets) in Favour of the water-consuming cereals.
    • Shifting of High acreage to High MSP crop: This led to acreages moving largely in Favour of water consuming staples, whose crop-water requirements are many times of that of the drier millets. In the case of Cauvery and Teesta, the introduction of dry season paddy and its expansion created reliance on irrigation thereby Fuelling demand for water.
    • Non promotion of rabi millets: Though the MSP formula claims to take into account land and water use, it needs to be noted here that there is a need for Rabi millets (e.g., ragi) to be promoted through MSPs. This is because the millets are less water-consuming as compared to many other alternatives including wheat. However, there does not seem to be any MSP announced for Rabi millets.
    • Higher MSP for less water consuming crop is needed: In the process, it will be crucial to take into consideration the estimates of irrigation water need for specific crops, redefine the Rabi basket by including millets, and declare a higher MSP for less water-consuming crops vis-à-vis the high-water consuming crops.

    msp

    Nutritional security in MSP calculation

    • Nutritional security is not included in MSP calculation: The other consideration that is missing from the MSP formula is the consideration of the nutritional security. Ideally, the MSP regime should remunerate those crops that have a higher nutritional value per unit of resource use.
    • Rabi crops are more water efficient: Ragi is the most efficient water user in producing calories. Bajra followed by wheat and ragi are the better performers in terms of water efficiency in producing iron. For the case of fiber, ragi is the most water efficient crop followed by barley and maize demonstrating the same water efficiency.
    • Rabi crops are nutrition rich: Maize is the most efficient water user in producing carbohydrates with ragi being second and wheat third. With reference to fat production, bajra takes the first position followed by ragi and wheat. Ragi is the best performer in the case of calcium production. Wheat and ragi do equally well with phosphorus production per unit of water at the margin.
    • Missing MSP estimate: However, so far, the MSP formula has not taken into consideration the health and the nutritional aspect. Irrespective of the season, the nutritional aspect needs to be figured into the MSP recommendations, and more nutritional crops should command higher support prices.

    Conclusion

    • Present MSP regime is biased in Favor of rice and wheat. MSP can be utilized as great tool to achieve crop diversification by incentivizing cultivation of water efficient and nutrition rich millets. India can achieve the regional as well as financial balance in distribution of MSP by proper estimation of MSP and promotion accordingly.

    Mains Question

    How is MSP calculated? Analyse the linkages of MSP and water conflict and suggest the solution to overcome the water inefficiency by MSP.

    UPSC 2023 countdown has begun! Get your personal guidance plan now! (Click here)


  • Rejuvenating the Indian coffee industry

    coffee

    Context

    • Coffee cultivation is becoming an increasingly loss-making proposition in India. Already weighed down by the high cost of inputs and production as well as labor shortage, the industry is now also affected by changes in climate patterns, reports from Karnataka’s coffee heartland.

    All you need to know about Coffee plantation

    • Coffee is a tropical plantation crop.
    • 16° – 28°C temperature, 150-250cm rainfall and well-drained slopes are essential for its growth.
    • It grows on hilly slopes at the height of 900-1800m.
    • Low temperature, frost, dry weather for a long time and harsh sunshine are harmful for its plant.

    The status Coffee in India

    • India contributes about 4% of the world’s total coffee production. It ranks 6thin the world in coffee production.
    • At present, more than half of the total coffee production in India is produced by Karnataka alone, followed by Kerala and Tamil Nadu.
    • Coffee plants grow better in the laterite soils of Karnataka in India.
    • The Arabica variety initially brought from Yemen is produced in the country.
    • Indian coffee is highly rated and commands premium prices in the global coffee markets.
    • Indian coffee offering innumerable flavors, aromas and blends. The commodity, for several decades, enjoyed a special position in India’s export lists.
    • Coffee has high value and high imagery potential at home and overseas market. From being handled and sold as a berry, a green bean, a processed bean, a roasted bean and now a roasted and ground offering, coffee has climbed the hierarchy of value-addition.
    • Coffee was an important export item for the Union government, when the commodity’s exports were in the range of ₹4,000-₹5,000 crore annually.

    coffee

    Do you know the history of Coffee in India?

    • The history of Indian coffee dates back to around 1600 AD with the planting of Seven Seeds of Mocha by legendary saint Baba Budan in the courtyard of his hermitage in Chikmangalur, Karnataka. The coffee plants remained a garden curiosity before they gradually spread as backyard plantings, and later on to the hills of what is now known as Baba Budan Hills.
    • However, it wasn’t until the 18th century the British entrepreneurs started taking coffee cultivation properly and turned forests in Southern India into commercial coffee plantations

    What are Challenges faced by Coffee cultivation in India?

    • Impact of Climate Change: Drastic changes in climate patterns over the last few years have adversely impacted India’s coffee production and the quality of the crop. There were dry spells between 2015 and 2017 and unseasonal heavy rains, floods and landslides between 2018 and 2022. According to the Coffee Board of India’s post-blossom estimate, production for the 2022 crop is anticipated to be some 30% lower than the estimated production due to the extreme climatic conditions.
    • Impact of heavy rains: Destruction caused by heavy rains between July and September. The impact of the rains continues, with diseases affecting plants, and estate infrastructure suffering long-term damage. Plantations in Wayanad in Kerala and Palani in Tamil Nadu have also suffered similar losses. fruit rot, stalk rot and root rot and other irreparable damage due to heavy rainfall and landslides, berries turned black and dropped.
    • Emergence of New diseases: Erratic weather conditions are helping pests to breed and new diseases to emerge, further stressing coffee plantation.

    coffee

    Crisis in Coffee Industry of India

    • No adequate fund support by government: Sturdy and weather-resistant varieties of coffee may help and stand against climate change, but sadly the government is not providing adequate funds to coffee research stations to develop these.
    • The volatility in market prices marginalizing producers: The volatility in market prices and the reduced influence of producers in the value chain render coffee cultivation an increasingly loss-making proposition. Producers are getting marginalized. This is rapidly turning out to be a buyer-driven commodity market.
    • Impact of Exports on cost competitiveness: More than 75% of Indian coffee production is exported. This has an impact on the cost competitiveness of Indian coffee vis-à-vis the coffee that is exported from other producer regions, especially since those growers get their finances at very low interest rates.
    • High Cost of financing: Most private banks insist that growers provide collateral for financing. Since small and medium-size growers are invariably not in a position to provide collateral, the interest rates are high, at around 12%. International interest rates, on the other hand, are negligible, mostly in single digits. This is an advantage for competing coffee-producing region.
    • Increasing cost of Inputs: Due to the rise in the cost of inputs year on year and the increase in the cost of labor and benefits, which constitute 60% to 70% of total plantation expenditure, coffee growers are left with very little money in hand which is not adequate to repay loans. The cost of inputs around coffee such as fertilizers and agrochemicals has increased by almost 20% in a year.
    • No pricing mechanism: There is no official price setting mechanism even in the domestic market. So, traders and curers are calling the shots and fixing prices, and growers are at their mercy.
    • Identity crisis for Indian coffee: On the brand front, Indian coffee is still facing an identity crisis in global markets, although the country started exporting coffee actively before the 19th century. The fact that India sells Robusta and Arabic at a price higher than the hugely advertised Colombia is an indication of the brand building done by the Indian exporter and the quality of Indian coffee. Yet, Indian coffee does not have an individual brand identity in the international markets, Indian coffee was never considered a separate origin coffee. It was always used as filler.

    What are the reasons behind the High cost of production?

    • Rising labor charges: In India, production of coffee is low while the cost of production is on the rise compared to other coffee countries such as Vietnam and Brazil. In Brazil, labour charges account for 25% of the entire production cost, but in India, planters say they account for about 65%
    • Hard terrain and topography: It is possible to bring down the cost of production to some extent through mechanization, but India’s coffee terrains and topography limit this possibility. At the same time, Indian coffee has a unique positioning as it is shade-grown and grown at elevations, while other major producing countries grow coffee in flat lands.
    • High cost of Irrigation: Power cuts makes irrigation expensive as the cost of diesel is high. The high cost of inputs leads to the high cost of production which is the main problem for coffee growers. It makes coffee cultivation unviable. Earlier, the cost of production would go up by 4% to 5% annually, but now it goes up at least 20% annually.
    • Unskilled migrant labour and wage costs: There is increasingly a shortage of labor while the cost of labour is on the rise in the coffee sector. The children of workers in all the three coffee-growing States Karnataka, Tamil Nadu and Kerala prefer to move to urban areas. This means plantations are forced to depend heavily on migrant labours who are unskilled. A lot of effort, time and energy has to be invested in training migrant labours. As wage costs are not linked to productivity, growers are mandated to pay the usual wage along with other social costs such as housing and medicines, which adds up some 30% more to the wages. Most plantations simply don’t find skilled labour, especially for tasks such as shade-lopping, pruning, and borer tracing.

    coffee

    Way forward

    • Alternative source of revenue: Finding alternative sources of revenue and increasing domestic consumption on the one hand and branding and promoting Indian coffee better in the global market on the other.
    • Creating in addition revenue streams: Growers should create additional revenue streams through inter-cropping or through innovative measures. In addition to traditional inter-cropping of pepper and cardamom, coffee growers could try planting exotic fruit-bearing trees, food crops, or getting into fish farming, dairy farming, apiary or green tourism to increase incomes from their coffee gardens. For instance, progressive farmers from Thandikudi in Dindigul district in Tamil Nadu, and from Sakleshpur in Chikkamagaluru district, are growing avocados, mangosteens, oranges, guavas and other fruit bearing trees, amid their coffee plants. In some seasons they say they have even earned more money from these than from coffee and pepper.
    • Government should permit to plant alternate crops: Considering the change in land use, the government could permit growers to plant alternate crops in a land not suitable for coffee cultivation. Timely conversion will prevent growers from going financially sick.
    • Coffee Act and the new Coffee (Promotion and Development Bill), 2022: India’s share in the global coffee market may be less than 5%, but the coffee sector is hopeful that the Coffee Act and the new Coffee (Promotion and Development Bill), 2022, will do away the 80-year-old coffee regulation and usher in change.

    Conclusion

    • The coffee community in India, comprising close to 4 lakh coffee growers, hundreds of large planters, associations that represent growers, planters, curers and exporters, and over a dozen Fair Trade Organizations, hopes to boost coffee in the domestic and international markets and counter the problems the industry faces.

    Mains Question

    Q. Even after getting out of the shackles of the pooling system in 1996, the bean maintained a special status as a valuable export commodity for a long time. Discuss the problems of coffee industry taking a back seat in India and suggest solutions.

    UPSC 2023 countdown has begun! Get your personal guidance plan now! (Click here)

  • PM inaugurates ‘One Nation, One Fertilizer’ Scheme

    Prime Minister has inaugurated 600 Kisan Samridhi Kendras and ‘One Nation, One Fertilizer’ scheme and said that these steps were being taken to modernise agriculture.

    One Nation One Fertilizer (ONOF)

    • The single brand name for UREA, DAP, MOP and NPK etc. would be BHARAT UREA, BHARAT DAP, BHARAT MOP and BHARAT NPK etc. respectively for all Fertilizer Companies, State Trading Entities (STEs) and Fertilizer Marketing Entities (FMEs).
    • Also a logo indicating Fertilizer subsidy scheme namely Pradhanmantri Bhartiya Janurvarak Pariyojna will be used on said Fertilizer bags.
    • Under the scheme, companies are allowed to display their name, brand, logo and other relevant product information only on one-third space of their bags.
    • On the remaining two-thirds space, the “Bharat” brand and Pradhanmantri Bharatiya Jan Urvarak Pariyojana logo will have to be shown.

    What is the government’s argument for introducing this scheme?

    The government’s logic for introducing a single ‘Bharat’ brand for all subsidised Fertilizers being marketed by companies is as follows:

    (1) Subsidies normalization

    • The maximum retail price of urea is currently fixed by the government, which compensates companies for the higher cost of manufacturing or imports incurred by them.
    • The MRPs of non-urea Fertilizers are, on paper, decontrolled.
    • But companies cannot avail of subsidy if they sell at MRPs higher than that informally indicated by the government.
    • Simply put, there are some 26 Fertilizers (inclusive of urea), on which government bears subsidy and also effectively decides the MRPs;

    (2) Harmonizing markets

    • Apart from subsidising and deciding at what price companies can sell, the government also decides where they can sell.
    • This is done through the Fertilizer (Movement) Control Order, 1973.
    • Under this, the department of Fertilizers draws an agreed monthly supply plan on all subsidised Fertilizers in consultation with manufacturers and importers.
    • This supply plan is issued before the 25th of each month for the following month, with the department also regularly monitoring movement to ensure Fertilizer availability as per requirement, including remote areas.

    (3) Farmers welfare

    • The government is spending vast sums of money on Fertilizer subsidy (the bill is likely to cross Rs 200,000 crore in 2022-23).
    • By deciding where and at what price companies can sell, it would obviously want to take credit and send that message to farmers.

    What can be the drawbacks of the scheme?

    • It may disincentivize Fertilizer companies from undertaking marketing and brand promotion activities.
    • They will now be reduced to contract manufacturers and importers for the government. Any company’s strength ultimately is its brands and farmer trust built over decades.
    • Currently, in case of any bag or batch of Fertilizers not meeting the required standards, the blame is put on the company. But now, that may be passed on fully to the government.
    • Politically, the scheme might well boomerang rather than benefit the ruling party.

    Challenges in the fertilizer sector

    • Distortion in use due to price difference: In 2019-20, fertilizer use per hectare of cultivated area varied from 70 kg of NPK in Rajasthan to 250 kg in Telangana
    • Shift in the composition of fertilizer used:The high price differences among fertilizers (Nitrogen is much cheaper than Potassium and Phosphorus) have disturbed the relative prices of various fertilizers and resulted in a big shift in the composition of fertilizers used in the country in favor of urea and thus Nitrogen.
    • Increasing fertilizer subsidy: Fertilizer subsidy has doubled in a short period of three years. For 2021-22, the Union Budget has estimated fertilizer subsidy at ₹79,530 crores (from ₹66,468 crores in 2017-18).
    • Burden on exchequer: Taxpayers bear 78% of the cost of urea and farmers pay only 22%. This is expected to increase and is not sustainable.
    • Sensitive to Global impacts: The subsidy is likely to reach a much higher level due to the recent upsurge in the prices of energy,the international prices of urea and other fertilizers, and India’s dependence on imports.
    • Import dependence: The total demand for urea in the country is about 34-35 million tonnes whereas the domestic production is about 25 million tonnes.

    Other issues

    • Lesser expansion of Irrigation facilities and consequent low fertilizer consumption leads to low demand and therefore, restricts the growth of the industry.
    • Use of Obsolete Technology: Most of the fertilizer industry operates under PSUs that are using decade-old technology and thus making huge losses and also the competitive edge.

    Way forward

    • India should pay attention to improving fertilizer efficiency through need-based use rather than broadcasting fertilizer in the field.
    • The use of bio-fertilizers is necessary to maintain soil health as more and more use of chemical fertilizers kills all the microorganisms available in the soil, which are so essential for maintaining soil health.


    UPSC 2023 countdown has begun! Get your personal guidance plan now! (Click here)


  • Role of Women in livestock Rearing

    livestock

    Context

    • The livestock sector is one of the most rapidly growing components of the rural economy of India, accounting for5% of national income and 28% of agricultural GDP in 201819.In the last six years, the livestock sector grew at 7.9% (at constant prices) while crop farming grew by 2%. In rural households that own livestock, women are invariably engaged in animal rearing.

    What is mean by Livestock?

    • Livestock are the domesticated animals raised in an agricultural setting The livestock provides food and non-food items to the people. Food: The livestock provides food items such as Milk, Meat and Eggs for human consumption.

    Role of Livestock in Indian Economy

    • Livestock plays an important role in Indian economy. About 20.5 million people depend upon livestock for their livelihood. Livestock contributed 16% to the income of small farm households as against an average of 14% for all rural households. Livestock provides livelihood to two-third of rural community. It also provides employment to about 8.8 % of the population in India. India has vast livestock resources. Livestock sector contributes 4.11% GDP and 25.6% of total Agriculture GDP.

    DO YOU KNOW?

    • India is the world’s largest milk producer, followed by the United States of America, China, Pakistan and Brazil.
    • India ranks 1st contributing 23 of the global production. In the last 3 decades, India witnessed over 3 times rise in milk production.

    Role of Women in rural economy

    • Mostly engaged in agricultural activities: It is widely recognised that the majority of women workers in rural areas (72%) are engaged in agricultural activities. However, with the exception of participation in dairy cooperatives, specifically in milk marketing, women’s role in the livestock economy is not as widely known or discussed.
    • Rise in no of women in Dairy cooperatives: There were five million women members in dairy cooperatives in 2015-16, and this increased further to 5.4 million in 202021.Women accounted for 31% of all members of dairy producer cooperatives in 2020-21.In India, the number of women’s dairy cooperative societies rose from 18,954 in 2012 to 32,092 in2015-16.

    livestock

    Why women are not recognised in livestock rearing?

    • Sporadic nature of work: Conventional labour force surveys fail to accurately record women’s work in livestock raising for many reasons. Among the many problems in data collection, two significant ones are the sporadic nature of work undertaken for short spells throughout the day and often carried out within the homestead, and women’ own responses.
    • Poor data collection: 12 million rural women were workers in livestock raising an estimate based on the Employment and Unemployment Survey of2011-12. However, with the augmented definition, according to estimates, around 49 million rural women were engaged in raising the livestock.
    • Non recognition by policy makers: The problem clearly is that women livestock farmers are not visible to policymakers, and one reason is the lack of gender disaggregated data.

    What are the Problems associated with women and livestock rearing?

    • No specific data on women in the livestock economy: Recent employment surveys such as the Periodic Labour Force Survey fail to collect data on specific activities of persons engaged primarily in domestic duties. So, the undercounting of women in the livestock economy continues.
    • Lack of Training: the reach of extension services to women livestock farmers remains scarce. According to official reports, 80,000 livestock farmers were trained across the country in 2021, but we have no idea how many were women farmers. only a few women in each village reported receiving any information from extension workers. Women wanted information but wanted it nearer home and at times when they were free.
    • Difficulty to avail loans: women in poor households, without collateral to offer to banks found it difficult to avail loans to purchase livestock. Around 15 lakh new Kisan Credit Cards(KCC) were provided to livestock farmers under the KCC scheme during 2020-22.There is no information on how many of them were women farmers.
    • Lack of technical knowledge: Women livestock farmers lacked technical knowledge on choice of animals (breeding) and veterinary care. Men invariably performed these specific tasks and took animals for artificial insemination.
    • No active role in cooperatives: Women were not aware of the composition and functions of dairy boards and that the men exercised decisions even in women only dairy cooperatives. Further, the voice of women from landless or poor peasant Scheduled Caste households was rarely heard.

    livestock

    What are the Government policies?

    • The National Livestock Policy (NLP) : The NLP of 2013, aimed at increasing livestock production and productivity in a sustainable manner, rightly states that around 70% of the labour for the livestock sector comes from women. One of the goals of this policy was the empowerment of women.
    • The National Livestock: The National Livestock Mission (NLM) of2014-15 was initiated for the development of the livestock sector with a focus on the availability of feed and fodder, providing extension services, and improved flow of credit to livestock farmers. However, the NLM does not propose any schemes or programmes specific to women livestock farmers.
    • Responsibility of state Government: The policy proposes that the State government allocates 30% of funds from centrally sponsored schemes for women. There is no logic for the 30% quota.

    livestock

    Conclusion

    • Women’s labour is critical to the livestock economy. It follows then that women should be included in every stage of decision making and development of the livestock sector. Today, women livestock workers remain invisible on account of their absence in official statistics. We must recognise the due role of women in livestock rearing.

    Mains Question

    Q.How women contribute to rural economy? Despite being a core in animal rearing, why women are yet not recognised in policy framework of government?

    UPSC 2023 countdown has begun! Get your personal guidance plan now! (Click here)


  • Global Hunger Index is out, India in ‘serious’ category at rank 107

    hunger

    India ranks 107 out of 121 countries on the Global Hunger Index in which it fares worse than all countries in South Asia barring war-torn Afghanistan.

    Global Hunger Index (GHI)

    • The Global Hunger Index is a peer-reviewed annual report, jointly published by Concern Worldwide and Welthungerhilfe.
    • It determines hunger on a 100-point scale, where 0 is the best possible score (no hunger) and 100 is the worst.
    • It is designed to comprehensively measure and track hunger at the global, regional, and country levels.
    • The aim of the GHI is to trigger action to reduce hunger around the world.

    For each country in the list, the GHI looks at four indicators:

    1. Undernourishment (which reflects inadequate food availability): calculated by the share of the population that is undernourished (that is, whose caloric intake is insufficient)
    2. Child Wasting (which reflects acute undernutrition): calculated by the share of children under the age of five who are wasted (that is, those who have low weight for their height)
    3. Child Stunting (which reflects chronic undernutrition): calculated by the share of children under the age of five who are stunted (that is, those who have low height for their age)
    4. Child Mortality (which reflects both inadequate nutrition and unhealthy environment): calculated by the mortality rate of children under the age of five

    India’s performance

    • India’s child wasting rate (low weight for height), at 19.3%, is worse than the levels recorded in 2014 (15.1%) and even 2000 (17.15),
    • It is the highest for any country in the world and drives up the region’s average owing to India’s large population.
    • Prevalence of undernourishment has also risen in the country from 14.6% in 2018-2020 to 16.3% in 2019-2021.
    • This translates into 224.3 million people in India considered undernourished.

    How India performs among its neighbours?

    • India’s score of 29.1 places it in the ‘serious’ category. India also ranks below Sri Lanka (64), Nepal (81), Bangladesh (84), and Pakistan (99).
    • Afghanistan (109) is the only country in South Asia that performs worse than India on the index.
    • China is among the countries collectively ranked between 1 and 17 having a score of less than five.

    Has India improved somewhere?

    • India has shown improvement in child stunting, which has declined from 38.7% to 35.5% between 2014 and 2022, as well as child mortality which has also dropped from 4.6% to 3.3% in the same comparative period.
    • On the whole, India has shown a slight worsening with its GHI score increasing from 28.2 in 2014 to 29.1 in 2022.

    Reasons for such poor performance

    • Poor maternal health: Mothers are too young, too short, too thin and too undernourished themselves, before they get pregnant, during pregnancy, and then after giving birth, during breast-feeding.
    • Poor sanitation: Poor sanitation, leading to diarrhoea, is another major cause of child wasting and stunting.
    • Food insecurity: Low dietary diversity in India is also a key factor in child malnutrition.
    • Poverty: Almost 50 million households in India are dependent on these small and marginal holdings.
    • Livelihood loss: The rural livelihoods loss after COVID and lack of income opportunities other than the farm sector have contributed heavily to the growing joblessness in rural areas.

    Issues over credibility of GHI

    • India has ranked among many African countries while it is among the top 10 food-producing countries in the world.
    • The GHI is largely children-oriented with a higher emphasis on under-nutrition than on hunger and its hidden forms, including micronutrient deficiencies.
    • The first component — calorie insufficiency — is problematic for many reasons.
    • The lower calorie intake, which does not necessarily mean deficiency, may also stem from reduced physical activity, better social infrastructure and access to energy-saving appliances at home, among others.
    • For a vast and diverse country like India, using a uniform calorie norm to arrive at deficiency prevalence means failing to recognise the huge regional imbalances in factors that may lead to differentiated calorie requirements at the State level.

    Conclusion

    • The low ranking does not mean that India fares uniformly poor in every aspect.
    • This ranking should prompt us to look at our policy focus and interventions and ensure that they can effectively address the concerns raised by the GHI, especially against pandemic-induced nutrition insecurity


    UPSC 2023 countdown has begun! Get your personal guidance plan now! (Click here)

  • What are Rythu Bharosa Kendras?

    rythu

    Ethiopian Agricultural Minister is in Andhra Pradesh (AP) to study the first-of-its-kind Rythu Bharosa Kendras (RBKs).

    What are Rythu Bharosa Kendras?

    • Set up for the first time in the country, the RBKs are unique seeds-to-sales, single-window service centres for farmers that have been set up across the state.
    • They are a one-stop solution to all farmers’ needs and grievances. RBKs sell pre-tested quality seeds, certified fertilisers and animal feed.
    • Farmers can purchase or hire farm equipment, and even sell their produce at the prevailing MSP in the RBKs.
    • The RBKs provide services like soil testing and make recommendations — on which crops to sow, and quantity and type of fertiliser to be used.
    • The state government also pays crop insurance, procures grains and makes payments to farmers through the RBKs.

    Have the RBKs proved to be helpful to farmers?

    • RBKs facilitate interaction between farmers, agriculture scientists, and agriculture extension officers right at the village level.
    • Apart from providing services and items for sale, RBK officials demonstrate new farm equipment and provide training to farmers.
    • Based on inputs provided by officials after soil testing and weather conditions, many farmers have changed their cropping patterns and benefited immensely.
    • The RBKs have been responsible for elimination of spurious seeds and uncertified and dangerous fertilisers, which can cause crop damage and failures.
    • The RBKs, staffed by agriculture and horticulture graduates, help farmers decide the crops they should cultivate in a scientific manner.

    How has it been received by the Centre?

    • The Centre has recently nominated the RBK concept for the Food and Agriculture Organisation’s “Champion’’ award.

    UPSC 2023 countdown has begun! Get your personal guidance plan now! (Click here)