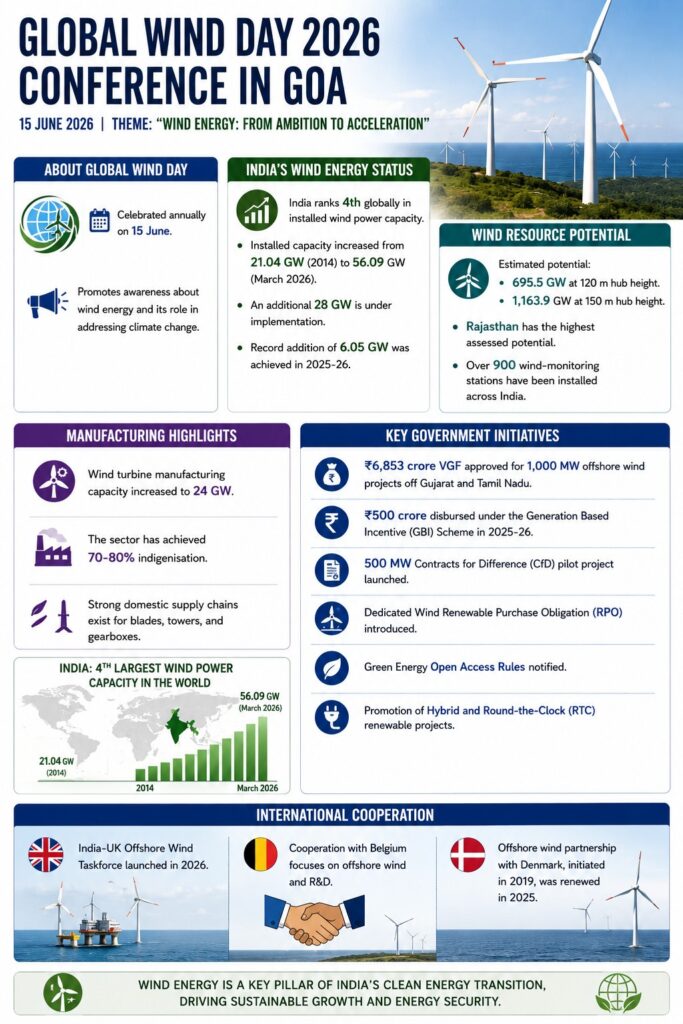
Promotion of Hybrid and Round-the-Clock (RTC) renewable projects.
International Cooperation
India-UK Offshore Wind Taskforce launched in 2026.
Cooperation with Belgium focuses on offshore wind and R&D.
Offshore wind partnership with Denmark, initiated in 2019, was renewed in 2025.
[2025] Consider the following statements about ‘PM Surya Ghar Muft Bijli Yojana’: I. It targets installation of one crore solar rooftop panels in the residential sector. II. The Ministry of New and Renewable Energy aims to impart training on installation, operation, maintenance and repairs of solar rooftop systems at grassroot levels. III. It aims to create more than three lakhs skilled manpower through fresh skilling, and upskilling, under scheme component of capacity building. Which of the statements given above are correct?
India has unveiled the Coal Exchange Rules, 2026, marking a major structural reform in the coal sector. For the first time, coal will be traded through regulated exchange platforms similar to power exchanges
What are the Coal Exchange Rules, 2026?
The Coal Exchange Rules, 2026, notified by the Ministry of Coal, establish a legally binding framework for transparent, electronic “many-to-many” spot mineral trading. Regulated by the Coal Controller Organisation, the rules aim to improve price discovery and market access for consumers.
Key Features of the Rules
Electronic Trading: The system transitions coal marketing from the traditional “one-to-many” bilateral model to an efficient, competitive digital trading platform where multiple buyers and sellers can transact.
Mandatory Physical Delivery: All transactions must culminate in physical delivery of the coal. These are supported by independent quality verification to ensure contractual compliance.
Regulatory Oversight: The Coal Controller Organisation acts as the central market regulator, handling the registration, supervision, and auditing of exchanges, as well as enforcing safeguards against market manipulation.
Registration Validity: Eligible entities (incorporated as companies under the Companies Act, 2013) are granted authorizations to establish and operate exchanges for 25 years.
Financial Obligations: Operators pay a ₹50 Lakh one-time registration fee, a ₹3 Lakh application fee, and an annual fee calculated as either ₹30 Lakh or 0.02% of the total trading volume, capped at ₹5 Crore.
How can coal exchanges transform India’s coal market structure?
Market-Based Trading: Establishes regulated platforms for buying and selling coal through transparent mechanisms.
Price Discovery: Creates market-driven price signals instead of relying primarily on bilateral negotiations.
Transparency: Reduces opacity associated with traditional contractual arrangements.
Competition: Enables broader participation by producers and consumers.
Secondary Markets: Facilitates development of coal trading beyond primary allocation channels.
Why is the existing coal allocation mechanism considered inadequate?
Long-Term Contracts: Most coal transactions currently occur through long-duration agreements, particularly for the power sector.
Auction Dependence: Significant volumes are allocated through auctions where prices may rise substantially.
Coal India Dominance: Non-regulated consumers often depend on Coal India auctions.
Premium Pricing: Coal is frequently sold at premiums to the highest bidder.
Limited Market Signals: Existing mechanisms provide inadequate real-time information regarding shortages and surpluses.
What lessons can be drawn from India’s power exchange experience?
Market Signalling: Power exchanges evolved into indicators of scarcity and surplus conditions.
What institutional safeguards are required for successful implementation?
Volatility Management: Ensures protection against excessive price fluctuations.
Dispute Resolution: Provides mechanisms for conflict settlement.
Logistics Integration: Strengthens transportation and delivery systems.
Regulatory Oversight: Ensures compliance and market integrity.
Settlement Systems: Facilitates efficient trading and delivery.
Conclusion
The Coal Exchange Rules, 2026 represent a shift from administrative allocation towards market-based coal governance. Their success will depend on quality standardisation, liquidity creation, Coal India’s participation, efficient logistics, and strong regulatory oversight. If implemented effectively, coal exchanges can become an important mechanism for balancing regional shortages, improving transparency, and strengthening India’s energy security.
Value Addition
Coal Sector at a Glance
Coal accounts for around 70% of India’s electricity generation.
India is the second-largest coal producer globally.
Coal India Limited produces roughly 80% of India’s domestic coal output.
Major coal-producing states: Odisha, Chhattisgarh, Jharkhand, Madhya Pradesh and Telangana.
About the Coal Controller Organisation (CCO)
The Coal Controller Organisation (CCO) is a subordinate office under the Ministry of Coal. Established in 1916 during World War I, it is one of the oldest regulatory bodies in India’s energy sector.
Headquartered in Kolkata, the CCO operates field offices across major mining hubs including Delhi, Dhanbad, Ranchi, Bilaspur, Nagpur, Sambalpur, and Kothagudem.
Core Regulatory Functions: The CCO derives its executive powers from various statutes, including the Colliery Control Rules, 2004, the Collection of Statistics Act, 2008, and the Coal Bearing Areas Act, 1957. Its primary responsibilities include:
Production and Grade Surveillance: The CCO inspects collieries to verify the correctness of declared coal classes, grades, and sizes. It establishes and enforces strict coal grading and quality standards.
Dispute Resolution: It serves as the official appellate authority to resolve quality and grade conflicts between coal producers and consumers.
Mine Approvals: No coal mine, seam, or section can be opened, reopened, or sub-divided without formal opening/reopening permissions from the CCO. It also approves Mining and Mine Closure Plans.
Captive Mine Monitoring: The organization tracks and monitors the development and progress of captive coal and lignite blocks allocated to various companies.
Statistical Authority: The CCO acts as the primary source for national coal statistics. It collects monthly production data and publishes the Provisional Coal Statistics and Coal Directory of India.
Land Acquisition Hearing Authority: Under the Coal Bearing Areas (Acquisition & Development) Act, the Coal Controller hears legal objections regarding the government’s acquisition of coal-bearing land.
New Role Under the Coal Exchange Rules, 2026: Following the notification of the Coal Exchange Rules, 2026, the CCO’s regulatory footprint has significantly expanded:
Central Market Regulator: The government designated the CCO as the apex statutory body to register, regulate, and audit electronic Coal Exchanges in India.
Platform Authorization: The CCO processes registrations for eligible entities, granting them 25-year operational licenses to run digital spot trading platforms.
Market Surveillance: It monitors exchange activities to prevent market manipulation, ensure fair price discovery, and resolve stakeholder grievances.
Coal India Limited (CIL)
Coal India Limited (CIL) is a Maharatna Public Sector Undertaking (PSU) that serves as the backbone of India’s energy security infrastructure.
Production Volume: World’s largest coal-producing company, accounting for roughly 80% of India’s total domestic coal output.
Operates under the Ministry of Coal.
Plays a central role in India’s energy security architecture.
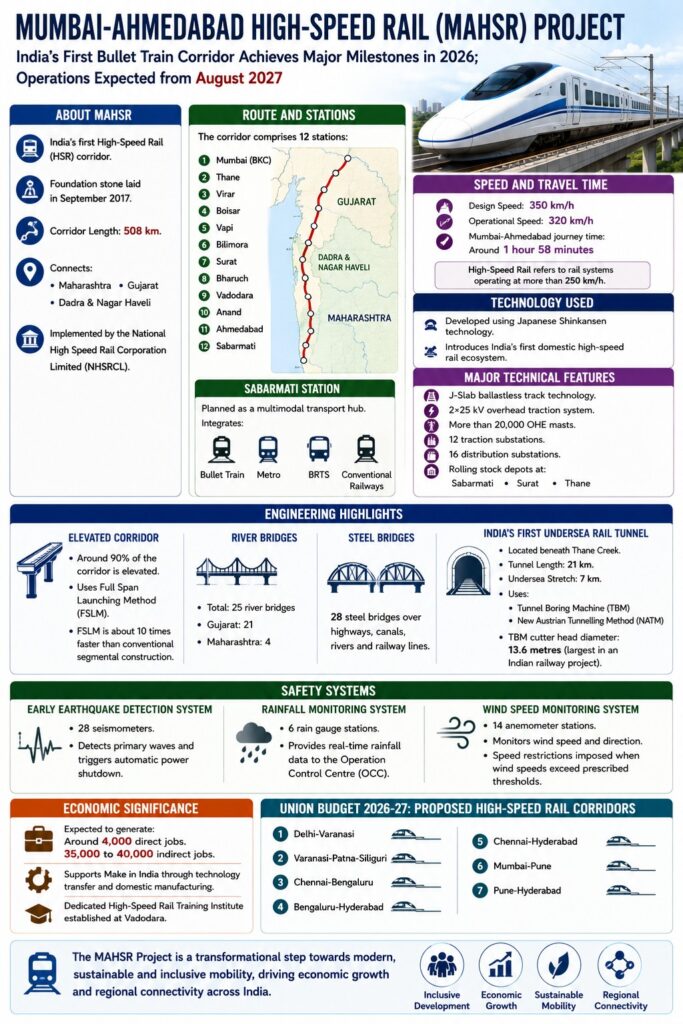
The Mumbai-Ahmedabad High-Speed Rail (MAHSR) Project, India’s first bullet train corridor, has achieved major construction milestones in 2026 and is expected to commence operations from August 2027.
About MAHSR
India’s first High-Speed Rail (HSR) corridor.
Foundation stone laid in September 2017.
Corridor Length: 508 km.
Connects: Maharashtra, Gujarat, and Dadra & Nagar Haveli
Implemented by the National High Speed Rail Corporation Limited (NHSRCL).
The corridor comprises 12 stations
Sabarmati Station: Planned as a multimodal transport hub.
Integrates: Bullet Train, Metro, BRTS, and Conventional Railways.
Speed and Travel Time
Design Speed: 350 km/h
Operational Speed: 320 km/h
Mumbai-Ahmedabad journey time: Around 1 hour 58 minutes
High-Speed Rail refers to rail systems operating at more than 250 km/h.
Technology Used
Developed using Japanese Shinkansen technology.
Introduces India’s first domestic high-speed rail ecosystem.
Major Technical Features
J-Slab ballastless track technology.
2×25 kV overhead traction system.
More than 20,000 OHE masts (Overhead Equipment Mast) is a vital vertical steel support used in railway electrification
12 traction substations (electrical substation that converts power from the public electricity grid into the specific voltage, current, and frequency required to power railways, trams, or trolleybuses)
16 distribution substations(electrical facility that receives high-voltage power from transmission or sub-transmission systems and “steps down” the voltage to medium levels).
Rolling stock depots at: Sabarmati, Surat, and Thane.
Engineering Highlights
Elevated Corridor
Around 90% of the corridor is elevated.
Uses Full Span Launching Method (FSLM).
FSLM is about 10 times faster than conventional segmental construction.
River Bridges: Total: 25 river bridges: Gujarat: 21. Maharashtra: 4.
Steel Bridges: 28 steel bridges over highways, canals, rivers and railway lines.
India’s First Undersea Rail Tunnel
Located beneath Thane Creek.
Tunnel Length: 21 km.
Undersea Stretch: 7 km.
Uses: Tunnel Boring Machine (TBM) and New Austrian Tunnelling Method (NATM).
TBM cutter head diameter: 13.6 metres (largest in an Indian railway project).
Safety Systems
Early Earthquake Detection System:28 seismometers. Detects primary waves and triggers automatic power shutdown.
Rainfall Monitoring System: 6 rain gauge stations. Provides real-time rainfall data to the Operation Control Centre (OCC).
Wind Speed Monitoring System:14 anemometer stations. Monitors wind speed and direction. Speed restrictions imposed when wind speeds exceed prescribed thresholds.
Economic Significance
Expected to generate: Around 4,000 direct jobs. 35,000 to 40,000 indirect jobs.
Supports Make in India through technology transfer and domestic manufacturing.
Dedicated High-Speed Rail Training Institute established at Vadodara.
Union Budget 2026-27: Proposed High-Speed Rail Corridors
Delhi-Varanasi, Varanasi-Patna-Siliguri, Chennai-Bengaluru, Bengaluru-Hyderabad, Chennai-Hyderabad, Mumbai-Pune, and Pune-Hyderabad
[2023] Consider the following statements : 1. In a seismograph, P waves are recorded earlier than S waves. 2. In P waves, the individual particles vibrate to and fro in the direction of wave propagation, whereas in S waves, the particles vibrate up and down at right angles to the direction of wave propagation. Which of the statements given above is/are correct?
The near-completion breakthrough of the Zojila Tunnel, being constructed at an altitude of 11,578 feet, marks one of India’s most ambitious and technically demanding infrastructure achievements.
What is the Zojila Tunnel?
The Zojila Tunnel is a 13-km bi-directional road tunnel being constructed beneath the Zojila Pass in the Himalayas.
Located at an elevation of 11,578 feet, it aims to provide all-weather connectivity between Kashmir Valley and Ladakh.
The project is among India’s most challenging infrastructure undertakings due to the complex geological and environmental conditions associated with Himalayan terrain.
How does Himalayan geology make tunnel construction exceptionally difficult?
Young Fold Mountains: The Himalayas are geologically young and remain tectonically active, resulting in unstable rock formations.
Variable Rock Strata: Rock composition can change within a few metres, creating unpredictable excavation conditions.
Structural Weaknesses: Rock formations contain fractures, cracks, fault zones, and shear zones that reduce stability.
Loose Geological Material: Engineers encounter loose rocks, boulders, and weak strata requiring different support systems.
Why do altitude and climatic conditions increase construction risks?
High Elevation: Construction occurs at approximately 11,578 feet, reducing worker efficiency and equipment performance.
Extreme Cold: Temperatures may fall to -30°C.
Harsh Winters: Severe weather limits construction windows.
Avalanche Threats: Snow avalanches create risks for workers and infrastructure.
Operational Challenges: Combustion engines and heavy machinery experience reduced efficiency at high altitude.
Why is water ingress one of the biggest engineering challenges in the Himalayas?
Stored Water Reservoirs: Mountains contain large volumes of groundwater trapped within rock layers.
Snowmelt Contribution: Melting snow continuously adds to underground water systems.
Water Ingress: Excavation frequently intersects water-bearing zones.
Hydrostatic Pressure: Excessive water pressure can destabilize tunnel structures.
Flooding Risk: Uncontrolled seepage may trigger tunnel flooding and structural failures.
Striking Observation
Massive Water Storage: Geological assessments indicate that Himalayan mountains may contain water volumes comparable to an “ocean’s worth” of stored water.
Why are shear zones and tectonic stresses particularly dangerous?
Shear Zones: High-strain zones create instability during excavation.
Rock Deformation: Tectonic pressure continuously alters stress distribution.
Collapse Risk: Excavation may trigger localized failures in weak zones.
Dynamic Conditions: Geological conditions often change unexpectedly during drilling.
What safety measures were adopted during the Zojila Tunnel project?
Ventilation Infrastructure: Three shafts were constructed along the tunnel length.
Emergency Response: Shafts provide access for rescue and evacuation operations.
Deep Access Shafts: The first shaft is 474.3 m deep, making it the deepest in India.
Additional Shafts: The second shaft is 367.5 m deep, while the third shaft is 213.5 m deep.
Operational Safety: Ventilation systems ensure worker safety during construction and future operation.
How does the New Austrian Tunnelling Method (NATM) help overcome Himalayan challenges?
The New Austrian Tunneling Method (NATM) is a modern, observational tunneling approach that reinforces the surrounding rock or soil, allowing it to deform slightly and become part of the tunnel’s primary load-bearing structure.
Selective Excavation: Facilitates controlled blasting based on rock conditions.
Sequential Construction: Excavation proceeds in stages rather than full-face excavation.
Top-Heading Method: Upper tunnel section is excavated first, followed by the lower section.
Adaptive Design: Allows modifications according to changing geological conditions.
Risk Reduction: Enhances stability in weak and variable rock formations.
About the NATM
Principle: “The surrounding rock mass itself becomes part of the support system.”
Key Components
Shotcrete: Sprayed concrete for immediate stabilization.
Rock Bolts: Reinforce fractured rock.
Monitoring Systems: Continuous assessment of rock behaviour.
Flexible Design: Engineering response adjusted to site conditions.
How are water and structural stability managed during excavation?
Drainage Pipes: Facilitate controlled water discharge.
Pressure Management: Prevents buildup of hydrostatic pressure.
Rock Bolting: Stabilizes fractured rock masses.
Shotcrete Lining: Binds loose rock surfaces.
Alignment Modification: Tunnel route can be altered to bypass weak geological sections.
Site-Specific Design: Tunnel shape and support configuration vary according to local conditions.
Why does the Zojila Tunnel have strategic significance beyond engineering?
All-Weather Connectivity: Reduces dependence on the seasonally closed Zojila Pass.
Regional Integration: Strengthens connectivity between Kashmir and Ladakh.
Defence Logistics: Improves movement of military personnel and supplies.
Economic Development: Facilitates tourism, trade, and local livelihoods.
National Infrastructure Capacity: Demonstrates India’s capability to execute mega-projects in difficult terrain.
Conclusion
The Zojila Tunnel demonstrates the intersection of strategic infrastructure, geological science, and engineering innovation in one of the world’s most challenging mountain environments. Its construction highlights the necessity of adaptive engineering, advanced tunnelling techniques, and robust safety systems for infrastructure development in the Himalayas. The project serves as a model for future high-altitude infrastructure while strengthening regional connectivity, national security, and economic integration.
Value Addition
Major Himalayan Infrastructure Projects
Zojila Tunnel: Kashmir-Ladakh connectivity.
Atal Tunnel: Rohtang Pass, Himachal Pradesh.
Sela Tunnel: Arunachal Pradesh.
Z-Morh Tunnel: Sonamarg connectivity.
PYQ Relevance
[UPSC 2016] The Himalayas are highly prone to landslides. Discuss the causes and suggest suitable measures of mitigation.
Linkage: The question examines the geological fragility, instability, and hazard-prone nature of the Himalayan mountain system. The Zojila Tunnel highlights how young Himalayan geology creates major engineering and disaster-management challenges during infrastructure construction.
India’s net FDI has witnessed an extraordinary collapse, falling from almost $44 billion in 2020-21 to less than $1 billion in 2024-25, even as gross FDI inflows recovered to $94.6 billion. This sharp divergence has reignited debate over whether India is becoming a less attractive investment destination.
Why has India’s net FDI declined so sharply despite strong gross inflows?
Net FDI Measurement: Net FDI under the Balance of Payments (BoP) framework is calculated after adjusting gross inflows for FDI-related outflows.
Sharp Decline: Net FDI fell from nearly $44.0 billion in 2020-21 to less than $1 billion in 2024-25.
Strong Gross Inflows: Gross FDI inflows recovered to $94.6 billion in 2025-26.
Misleading Interpretation: Weak net FDI is often interpreted as a sign of declining investor confidence, while strong gross inflows are presented as evidence of economic strength.
Underlying Reality: Both views overlook the changing composition of international capital flows and the mechanisms governing inflows and outflows.
Does the conventional FDI debate overlook important structural changes?
Incomplete Narrative: Public discourse focuses primarily on aggregate FDI numbers rather than the nature of investments.
Shift in Focus: Policy gradually prioritised attracting larger inflows, while concerns regarding future external payment obligations and investment quality received less attention.
Need for Assessment: Evaluating FDI requires examining investor categories, sectoral allocation, and associated outflows rather than focusing solely on inflow volumes.
What types of FDI are entering India and how do they differ in developmental impact?
Traditional or Real FDI
Source: Multinational enterprises investing directly in production and services.
Contribution: Brings technology, brands, managerial capabilities, and production know-how.
Impact: Supports long-term industrial development and employment generation.
Financial Investor FDI
Source: Private equity funds, venture capital funds, sovereign wealth funds, and asset managers.
Objective: Capital appreciation rather than production expansion.
Impact: Provides financial capital but contributes less to technology transfer and industrial capacity creation.
Diaspora and SPV-Based Investments
Mechanism: Capital raised abroad and channelled through offshore financial centres.
Instrument: Special Purpose Vehicles (SPVs).
Characteristic: Frequently associated with round-tripping of domestic funds.
How has the composition of FDI changed in recent years?
Real FDI Share: Accounted for only 41.9% of effective inflows between 2022-23 and 2025-26.
Financial Investor Share: Contributed 40.5% of effective inflows.
Diaspora/SPV Share: Represented 17.6% of total inflows.
Developmental Concern: A rising share of financial investors and SPVs reduces the developmental gains usually associated with traditional FDI.
Technology Transfer: Becomes weaker when investments are motivated primarily by financial returns rather than production activity.
Why do rising investor exits matter for understanding net FDI trends?
Exit Signals: Business model of financial investors involves eventual exits through stake sales and disinvestment.
Large Exit Example: Singapore’s Temasek exited Schneider Electric India in 2025.
Scale of Exit: Exit generated approximately $6.4 billion.
Initial Investment: Around $637 million invested in 2020.
Return Multiple: Approximately 45 times the original investment.
PE and VC Exits: Foreign private equity and venture capital investors accounted for around $29 billion in outflows.
Implication: Such exits substantially increase capital outflows and depress net FDI.
Are gross FDI figures overstating actual fresh capital entering India?
Accounting Inclusion: Gross FDI statistics include intra-group ownership reorganisations.
Mergers and Acquisitions: Included even when no fresh capital enters the country.
Share Swaps: Recorded as FDI transactions despite limited resource transfer.
ECB Conversions: Conversion of external commercial borrowings into equity inflates inflow figures.
Blind Spot: Gross FDI figures often fail to distinguish between fresh investment and accounting transactions.
Illustrative Example: Large transactions involving Bosch and Mesee Technologies can significantly influence sectoral trends without necessarily bringing new productive capital.
Why can high gross FDI figures create a misleading picture of investment performance?
Gross FDI Recovery: Gross FDI inflows recovered to $94.6 billion, often cited as evidence of India’s continued attractiveness to foreign investors.
Accounting Transactions: Gross FDI statistics include intra-group ownership restructuring, mergers and acquisitions, share swaps, and conversion of external commercial borrowings (ECBs) into equity.
Limited Fresh Capital: Such transactions may alter ownership structures without necessarily bringing substantial new capital, technology, or productive capacity into the economy.
Sectoral Distortions: Large corporate restructuring exercises can inflate FDI numbers and create an impression of strong investment activity in particular sectors.
Developmental Concern: High gross inflows do not automatically translate into employment generation, manufacturing expansion, technology transfer, or export competitiveness.
Why is the decline in manufacturing FDI a major concern?
Four-Year Decline: Manufacturing FDI has fallen continuously for four consecutive years.
Low Share: Manufacturing accounted for only 10.6% of total effective inflows during the latest four-year period.
Employment Implications: Reduces potential for large-scale job creation.
Strategic Concern: Limits India’s ambition to become a major global manufacturing hub.
Does rising outward FDI represent globalisation or capital flight?
Rapid Growth: India’s outward FDI has increased significantly.
Sectoral Concentration: Around 45% of outward investments during 2023-24 to 2025-26 flowed into financial services, insurance, and business services.
Destination Pattern: Singapore and the UAE accounted for approximately 27% and 11% respectively.
Corporate Example: Tata Motors-owned subsidiary in Singapore invested $405 million to acquire IVECO Group in Italy.
GIFT City Link: FDI routed through GIFT City increased from $246 million in 2023-24 to $1.8 billion in 2025-26.
Extended Route: Total inflows and outward FDI through this channel reached approximately $1.40 billion, indicating expanding two-way flows.
Dual Interpretation: Outward FDI may indicate both global expansion of Indian firms and relocation of capital across jurisdictions.
How are FDI-related outflows reshaping India’s external sector?
Disinvestment Outflows
Magnitude: Disinvestment and capital withdrawals totalled approximately $178.9 billion.
Drivers: Secondary sales, IPO exits, and share buybacks.
Dividend Remittances
Amount: Reached $118.9 billion.
Source: Profits paid by multinational subsidiaries and affiliates, excluding reinvested earnings.
Intellectual Property Payments
Amount: Totalled $46.6 billion.
Nature: Payments for intellectual property and royalty use.
Estimated Allocation: Around 75% of total IPR payments assumed to be attributable to multinational subsidiaries and affiliates.
Technical and Service Payments
Amount: Around $250 billion transferred through technical and service/consultancy payments.
Difficulty: Separation between foreign and domestic company payments remains challenging.
Overall Outflows
Adjusted Outflows: Even after excluding OFDI, technical service payments, dividends and IPR-related outflows, total outflows remained around $344.4 billion.
Deteriorating Ratio: For every dollar of fresh inflow (excluding reinvested earnings), approximately $1.50 flowed out.
Historical Comparison: Outflow per dollar of inflow rose from 56 cents (2014-15 to 2017-18) to 70 cents (2018-19 to 2021-22) before reaching the current high.
Why should policymakers focus on the quality rather than the quantity of FDI?
Technology Transfer: Real FDI contributes more effectively to technological upgrading.
Industrial Development: Manufacturing-oriented FDI strengthens domestic production capabilities.
Investor Diversity: Different investor categories generate different developmental outcomes.
Policy Evaluation: FDI performance should be assessed through technology gains, industrial capacity creation, employment generation, and external-sector implications rather than gross inflow figures alone.
Core Message: Headline FDI numbers conceal important changes in investor composition, entry modes, exit strategies, and developmental impact.
Conclusion
India’s falling net FDI highlights that the quality and composition of foreign investment matter more than headline inflow numbers. Rising disinvestment, profit repatriation, and financial-investor-led flows have weakened net inflows despite strong gross FDI. Going forward, policy must prioritise productive, technology-intensive, and manufacturing-oriented FDI that strengthens industrial growth and external sector sustainability.
Value Addition
Net FDI vs Gross FDI
Indicator
Meaning
Gross FDI
Total foreign investment entering the economy
Net FDI
Gross inflows minus disinvestment and related outflows
Effective FDI
Fresh capital inflows after excluding accounting and restructuring transactions
Volatile Capital Flows: Increases external vulnerability.
Short-Term Orientation: Prioritises capital gains over industrial expansion.
PYQ Relevance
[UPSC 2016] Justify the need for FDI for the development of the Indian economy. Why is there a gap between MOUs signed and actual FDIs? Suggest remedial steps to increase actual FDIs in India.
Linkage: The question examines not merely the volume of FDI but its effectiveness, actual realization, and developmental contribution to the economy. The article highlights why the quality and developmental impact of FDI matter more than headline inflow numbers.
The two-day SAPLING (South Asian Policy Leadership for Improved Nutrition and Growth) Dialogue 2026 concluded on 10 June 2026 in Ahmedabad, Gujarat, with a call for a concrete action plan for the holistic development of the food processing sector in South Asia.
About SAPLING Dialogue 2026
Jointly organised by: Ministry of Food Processing Industries (MoFPI), Government of India and World Bank Group
Venue: Ahmedabad, Gujarat
Duration: 9-10 June 2026
Participants: Around 200 delegates.
Participants Included
Policymakers, Industry leaders, International organisations, Development partners, Researchers, Startups, Financial institutions, and Representatives from South Asian countries
Theme
“Unlocking Value: Advancing Food Processing for Employment Generation and Sustainable Growth in South Asia”
Key Objectives
Strengthen resilient, inclusive and sustainable food systems in South Asia.
Promote regional cooperation in food processing.
Encourage value addition in agriculture.
Facilitate technology adoption in the sector.
Generate employment opportunities.
Enhance farmer incomes and rural development.
Support MSMEs and women entrepreneurs.
[2023] Consider the following statements with reference to India: 1. According to the Micro, Small and Medium Enterprises Development (MSMED) Act, 2006, the ‘medium enterprises’ are those with and machinery between is crore and 25 crore. 2. All bank loans to the Micro, Small and Medium Enterprises qualify under the priority sector. Which of the statements given above is/are correct?
The RBI has allowed banks to raise fresh 3-5 year Foreign Currency Non-Resident (Bank) [FCNR(B)] deposits from NRIs and deposit the money with the RBI under a special scheme until September 2026. The RBI will bear the cost of protecting banks from exchange rate fluctuations (hedging cost), making it cheaper and more profitable for banks to attract foreign currency deposits. The objective is to encourage more NRI dollars to flow into India and strengthen foreign exchange inflows.
What are FCNR(B) deposits?
They are fixed-term foreign currency deposits offered by Indian banks to Non-Resident Indians (NRIs) and Overseas Citizens of India (OCIs).
They allow depositors to maintain savings in designated foreign currencies without converting funds into Indian rupees.
The RBI’s latest swap facility seeks to strengthen the attractiveness of these deposits and support India’s external financing requirements.
What is the US Dollar-Rupee Forex Swap Facility for FCNR(B) Deposits?
The Reserve Bank of India (RBI) introduced a special US Dollar-Rupee Forex Swap Facility to help banks mobilize fresh Foreign Currency Non-Resident, or FCNR(B) deposits. By bearing the hedging costs, the RBI enables banks to offer higher interest rates to NRIs without the currency risk.
Key details of the scheme include:
Eligible Depositors: Available to Non-Resident Indians (NRIs) and Overseas Citizens of India (OCIs).
Deposit Tenure: 3 to 5 years.
Deposit Currency: Mobilized in any freely convertible currency, but the swap must be done in US Dollars.
Foreign Currency Denomination: Maintains deposits in: US Dollar (USD), Pound Sterling (GBP), Euro (EUR), Japanese Yen (JPY), Australian Dollar (AUD), and Canadian Dollar (CAD)
Swap Rate: Undertaken “at par” (the RBI will buy USD at the FBIL Reference Rate and later sell it back at the same rate).
Timeline: Valid for deposits mobilized between June 8, 2026, and September 30, 2026. The swap window remains open to banks until October 16, 2026.
Lock-in Period: Underlying deposits are subject to a 1-year lock-in period; however, the swaps undertaken with the RBI cannot be canceled.
Availability: Authorised Dealer Category-I banks can avail of this facility once a week.
External Vulnerability Reduction: Reduces dependence on volatile portfolio flows.
Conclusion
The RBI’s decision to revive the FCNR(B) swap window reflects its proactive approach to strengthening India’s external sector amid a challenging global interest rate environment. While the facility reduces costs for banks and can potentially attract additional foreign currency inflows, its success will ultimately depend on whether banks offer sufficiently competitive returns to NRIs. Sustained mobilisation of FCNR(B) deposits can enhance foreign exchange reserves, support balance of payments stability, and reduce vulnerability to volatile capital flows, thereby reinforcing India’s macroeconomic resilience.
Value Addition
FCNR(B) Deposits vs NRE Deposits vs NRO Deposits
Feature
FCNR(B)
NRE
NRO
Full Form
Foreign Currency Non-Resident (Bank) Account
Non-Resident External Account
Non-Resident Ordinary Account
Currency
Foreign Currency
Indian Rupee
Indian Rupee
Exchange Rate Risk
No
Yes
Yes
Repatriability
Fully Repatriable
Fully Repatriable
Limited Repatriability
Tax on Interest
Tax Exempt
Tax Exempt
Taxable
Depositor Eligibility
NRI/OCI
NRI
NRI
Importance of NRI Deposits for India
Stable Capital Source: Less volatile than Foreign Portfolio Investment (FPI) and other short-term capital flows.
Foreign Exchange Augmentation: Supports accumulation of Foreign Exchange (Forex) Reserves.
Banking Sector Funding: Provides long-term foreign currency liabilities to banks.
External Financing: Supports financing of the Current Account Deficit (CAD) and other external sector requirements.
Crisis Buffer: Acts as a source of foreign capital during periods of external stress and global financial uncertainty.
RBI Instruments for Managing External Sector Stability
FCNR(B) Swap Window: Mobilises foreign currency deposits from NRIs while reducing hedging costs for banks.
Foreign Exchange (Forex) Market Intervention: Stabilises excessive exchange rate volatility in the rupee.
Foreign Exchange Reserves: Provides a buffer against external shocks and capital outflows.
Monetary Policy Operations: Influences liquidity conditions, interest rates, and capital flows.
Macroprudential Measures: Manages systemic risks arising from volatile capital movements and financial market disruptions.
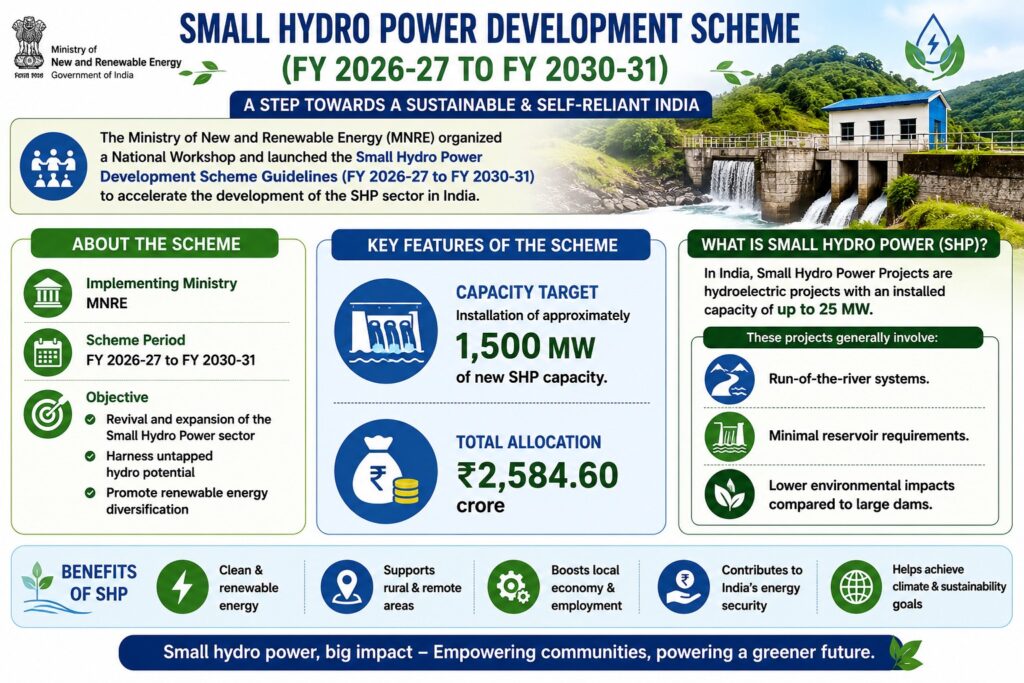
The Ministry of New and Renewable Energy (MNRE) organised a National Workshop and launched the Small Hydro Power Development Scheme Guidelines (FY 2026-27 to FY 2030-31) to accelerate the development of the SHP sector in India.
About the Small Hydro Power Development Scheme
Implementing Ministry: MNRE
Scheme Period: FY 2026-27 to FY 2030-31
Objective:
Revival and expansion of the Small Hydro Power sector.
Harness untapped hydro potential.
Promote renewable energy diversification.
Capacity Target: Installation of approximately 1,500 MW of new SHP capacity.
Total allocation: ₹2,584.60 crore
In India, Small Hydro Power Projects are hydroelectric projects with an installed capacity of up to 25 MW
These projects generally involve:
Run-of-the-river systems.
Minimal reservoir requirements.
Lower environmental impacts compared to large dams.
[2024] Recently, the term “pumped-storage hydropower” is actually and appropriately discussed in the context of which one of the following?
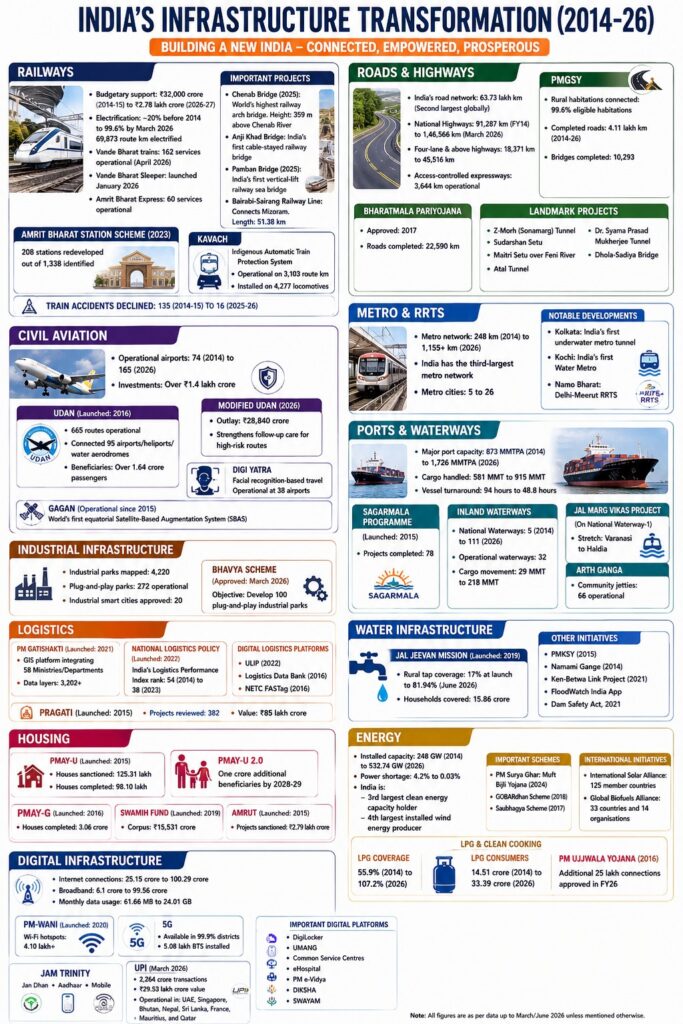
The Government highlighted major infrastructure achievements over the past 12 years across transport, logistics, water, housing, energy, and digital sectors, emphasizing their role in achieving Viksit Bharat 2047.
1. Railways
Railway budgetary support increased from ₹32,000 crore (2014-15) to ₹2.78 lakh crore (2026-27).
India’s Logistics Performance Index rank: 54 (2014) to 38 (2023).
Digital Logistics Platforms
ULIP (2022).
Logistics Data Bank (2016).
NETC FASTag (2016).
PRAGATI
Launched: 2015.
Projects reviewed: 382.
Value: ₹85 lakh crore.
7. Water Infrastructure
Jal Jeevan Mission
Launched: 2019.
Rural tap coverage: 17% at launch to 81.94% (June 2026).
Households covered: 15.86 crore.
Other Initiatives
PMKSY (2015), Namami Gange (2014), Ken-Betwa Link Project (2021, FloodWatch India App, and Dam Safety Act, 2021.
8. Housing
PMAY-U
Launched: 2015.
Houses sanctioned: 125.31 lakh.
Houses completed: 98.10 lakh.
PMAY-U 2.0: One crore additional beneficiaries by 2028-29.
PMAY-G
Launched: 2016.
Houses completed: 3.06 crore.
SWAMIH Fund
Launched: 2019.
Corpus: ₹15,531 crore.
AMRUT
Launched: 2015.
Projects sanctioned: ₹2.79 lakh crore.
9. Energy
Installed capacity: 248 GW (2014) to 532.74 GW (2026).
Power shortage: 4.2% to 0.03%.
Renewable Energy
India is: 3rd largest clean energy capacity holder and 4th largest installed wind energy producer.
Important Schemes
PM Surya Ghar: Muft Bijli Yojana (2024).
GOBARdhan Scheme (2018).
Saubhagya Scheme (2017).
International Initiatives
International Solar Alliance: 125 member countries.
Global Biofuels Alliance: 33 countries and 14 organisations.
10. LPG and Clean Cooking
LPG coverage: 55.9% (2014) to 107.2% (2026).
LPG consumers: 14.51 crore to 33.39 crore.
PM Ujjwala Yojana
Launched: 2016.
Additional 25 lakh connections approved in FY26.
11. Digital Infrastructure
Internet connections: 25.15 crore to 100.29 crore.
Broadband:6.1 crore to 99.56 crore.
Monthly data usage: 61.66 MB to 24.01 GB.
PM-WANI
Launched: 2020.
Wi-Fi hotspots: 4.10 lakh+.
5G
Available in 99.9% districts.
5.08 lakh BTS installed.
JAM Trinity
Jan Dhan, Aadhaar and Mobile.
UPI
March 2026: 2,264 crore transactions and ₹29.53 lakh crore value.
Operational in UAE, Singapore, Bhutan, Nepal, Sri Lanka, France, Mauritius, and Qatar.
Important Digital Platforms
DigiLocker, UMANG, Common Service Centres, eHospital, PM e-Vidya, DIKSHA, SWAYAM.
[2025] Consider the following statements: I. Indian Railways have prepared a National Rail Plan (NRP) to create a future ready railway system by 2028. II. Kavach’ is an Automatic Train Protection system, development in collaboration with Germany. III. ‘Kavach’ system consists of RFID tags fitted on track in station section. Which of the statements given above are not correct?
India’s flagship decentralised solar schemes, PM Surya Ghar Yojana and PM-KUSUM, have achieved only about 13 GW capacity against a target of 40 GW. This has prompted the Parliamentary Estimates Committee to examine implementation bottlenecks.
Background
Solar Dominance: Solar power now accounts for nearly 30% of India’s installed electricity generation capacity.
Rapid Capacity Addition: India added more than 50 GW of solar capacity during the last two years.
Global Position: India added more solar power in 2025 than any country except China.
Why is Decentralised Solar Power Becoming Central to India’s Energy Transition?
Decentralised solar power (DRE) generates electricity at or near the point of consumption rather than relying on large, centralized power plants. This approach eliminates long-distance transmission losses and empowers local communities by providing affordable, continuous, and reliable energy
Rising Electricity Demand: Increasing temperatures, urbanisation and economic growth are pushing electricity demand upwards.
Land Constraints: Availability of land for large utility-scale solar parks is becoming increasingly limited.
Climate Resilience: Distributed generation strengthens energy security during periods of high demand and climatic stress.
Peak Demand Management: Solar power significantly contributed to meeting daytime peak demand during April-May 2026.
Hydropower Constraints: Hydropower capacity expansion has stagnated, reducing its ability to meet incremental demand.
Stagnating Share: Hydropower’s share in India’s installed power capacity has declined from around 25% in the early 1990s to about 10% today, despite growth in overall electricity demand.
Limited Capacity Addition: India added only about 5 GW of large hydropower capacity between 2014 and 2024, compared to over 100 GW of solar capacity during the same period.
Current Capacity: India’s installed hydropower capacity stands at roughly 48-49 GW, while solar capacity has crossed 100 GW.
Climate Vulnerability: Erratic monsoons, changing river flows, environmental clearances, rehabilitation issues, and long gestation periods have slowed hydropower expansion.
Energy Transition Implication: With hydropower unable to expand rapidly enough to meet rising demand, solar, particularly decentralised solar, is increasingly expected to meet incremental electricity requirements.
What are the Key Features of PM Surya Ghar Yojana and PM-KUSUM?
PM Surya Ghar Yojana
Household Coverage: Targets rooftop solar installation in 1 crore households.
Free Electricity: Provides electricity benefits of up to 300 units per month.
Capital Subsidy: Offers direct subsidy support for rooftop solar equipment.
Decentralised Generation: Encourages household-level electricity production and grid integration.
Progress
Target
Achievement
1 crore households connected
40.52 lakh households
30 GW installed capacity
12 GW
PM-KUSUM
The Pradhan Mantri Kisan Urja Suraksha evam Utthan Mahabhiyan (PM-KUSUM) is an initiative by the Ministry of New and Renewable Energy (MNRE). It provides farmers with heavy subsidies for solar agricultural pumps and solar power plants, designed to generate income, provide daytime irrigation, and replace expensive diesel or grid power
Farmer-Centric Design: Supports farmers in establishing decentralised solar infrastructure.
Solar Plants on Unused Land: Enables installation of small solar plants on unused agricultural land.
Solar Water Pumps: Supports both standalone and grid-connected solar irrigation pumps.
Additional Income: Allows sale of surplus electricity to the grid.
Cost Reduction: Reduces diesel and conventional electricity expenses.
Progress
Target
Achievement
14 lakh solar water pumps
10.9 lakh
2.5 lakh solar irrigation pumps
15,000
30 GW decentralised solar capacity
1.2 GW
How Successful Have These Flagship Programmes Been?
Combined Budget: Approximately ₹95,000 crore.
Combined Capacity Created: About 13 GW as of 31 May 2026.
Target Capacity: 40 GW by the end of the current financial year.
Achievement Gap: Only around one-third of the targeted capacity achieved.
PM-KUSUM Delay: Initially targeted for completion by 2022 but extended until the end of the current financial year due to pandemic-related disruptions.
Best Performing Component: Standalone off-grid solar water pumps under PM-KUSUM.
How is Performance Highly Uneven Across States?
PM Surya Ghar Better Performers
State
Installations
Households Connected
Subsidy (₹ crore)
Gujarat
6,81,180
9,77,754
9,277
Maharashtra
6,04,522
9,42,378
23,149
Uttar Pradesh
5,62,656
5,77,103
19,095
Kerala
2,52,803
2,58,959
382
Rajasthan
2,15,842
2,23,066
30,597
PM Surya Ghar Underperformers
State
Installations
Households Connected
Subsidy (₹ crore)
West Bengal
1,695
1,758
1,868
Punjab
14,470
16,641
20,693
Karnataka
19,793
30,395
27,725
Bihar
20,272
20,905
15,405
Tamil Nadu
72,988
85,743
15,701
How Do Power Subsidies Affect Solar Adoption?
Distorted Economic Incentives: Free or highly subsidised electricity reduces the financial attractiveness of investing in rooftop solar systems.
Reduced Payback Benefits: Consumers receiving subsidised electricity perceive limited savings from solar installations, resulting in lower adoption rates.
High Upfront Cost Sensitivity: Households are less willing to incur substantial initial costs for solar systems when electricity is already available at little or no cost.
Subsidy-Driven Consumer Behaviour: Existing subsidy regimes encourage continued dependence on grid electricity rather than self-generation through rooftop solar.
Policy Contradiction: Simultaneous promotion of rooftop solar and provision of free electricity creates conflicting incentives for consumers.
Official Recognition: The Ministry of New and Renewable Energy informed the Parliamentary Estimates Committee that free electricity schemes have emerged as a major constraint to PM Surya Ghar implementation.
Evidence from States
Punjab: Provides 300 free units to households and free electricity for agricultural tubewells; annual power subsidy expenditure exceeds ₹20,000 crore.
Karnataka: Electricity subsidy bill stands at approximately ₹27,000 crore.
Tamil Nadu: Electricity subsidy expenditure is around ₹15,700 crore.
Why Does the Upfront Cost Remain the Biggest Barrier?
High Initial Investment: Solar installations often require investment of several lakh rupees.
Delayed Returns: Benefits accrue gradually through reduced electricity bills and sale of surplus power.
Affordability Challenge: Many households and farmers struggle to mobilise upfront capital despite long-term savings.
Credit Constraints: Access to affordable financing remains limited.
Administrative Efficiency: Faster approvals and implementation improved adoption rates.
Evidence of Success: These states account for nearly 70% of the total rooftop solar installations achieved under PM Surya Ghar.
What are the Long-Term Economic Benefits of Decentralised Solar Power?
Subsidy Rationalisation: Reduces long-term dependence on recurring electricity subsidies.
Fiscal Savings: Full implementation of PM Surya Ghar could save approximately ₹75,000 crore annually in electricity-related expenditure.
Consumer Empowerment: Converts consumers into electricity producers.
Grid Stability: Reduces transmission losses and distribution burden.
Energy Security: Diversifies generation sources and reduces fuel dependence.
Climate Commitments: Supports India’s renewable energy and net-zero objectives.
What is the Growing Link Between Solar Power and Electricity Demand?
Demand Surge: Rising temperatures are increasing electricity consumption.
Climate Variability: Lower rainfall forecasts may reduce hydropower availability.
Summer Demand Peaks: Solar generation is increasingly meeting daytime peak loads.
Future Energy Mix: Solar is expected to become India’s second-largest source of electricity generation, overtaking hydropower.
Decentralisation Advantage: Distributed generation can cushion local supply-demand imbalances.
Conclusion
India’s clean energy transition increasingly depends on decentralised solar generation alongside utility-scale renewable projects. While PM Surya Ghar and PM-KUSUM have demonstrated their transformative potential, persistent barriers such as high upfront costs and distortionary electricity subsidies continue to constrain adoption. Bridging this gap through targeted incentives, affordable financing and subsidy reforms will determine whether decentralised solar power can become a major pillar of India’s energy security and climate strategy.
PYQ Relevance
[UPSC 2020] Describe the benefits of deriving electric energy from sunlight in contrast to the conventional energy generation. What are the initiatives offered by our Government for this purpose?
Linkage: The PYQ focuses on solar energy as a sustainable alternative to conventional power sources and government efforts to promote its adoption. PM Surya Ghar and PM-KUSUM are among India’s flagship initiatives for promoting decentralised solar energy. The article evaluates their achievements, implementation challenges, and significance for India’s energy security and clean energy transition.