💥Mains Ready By December. Smash Mains & Smash PYQ Admissions Open

Subject: Economics

  • [20th June 2026] The Hindu OpED: India’s cheapest power is here, the grid must catch up

    PYQ Relevance[UPSC 2013] Write a note on India’s green energy corridor to alleviate the problem of conventional energy.
    Linkage: The question examines the role of transmission infrastructure in enabling large-scale renewable energy integration.The article shows that transmission bottlenecks, not generation capacity, have become the main constraint on India’s clean-energy transition, reinforcing the importance of the Green Energy Corridor.

    Mentor’s Comment

    India now produces some of the world’s cheapest solar and wind power, yet more than 50 GW of completed renewable capacity remains stranded not because projects are unfinished, but because grid connectivity and transmission is unavailable.

    Why Has Transmission Become the Binding Constraint in India’s Energy Transition?

    1. Cheapest Source of Power: Solar and wind have emerged as India’s lowest-cost electricity sources, with firm clean power available at around ₹3.5 per kWh when paired with storage.
    2. Rapid Renewable Expansion: India added over 45 GW of renewable capacity in 2025 and currently has about 250 GW installed, with another 100 GW under construction.
    3. Existing Base and Pipeline: India currently has about 250 GW of renewable capacity installed and another 100 GW under construction, indicating that transmission expansion is lagging generation growth.
    4. Stranded Renewable Capacity: More than 50 GW of completed renewable projects remain unable to evacuate power due to transmission shortages.
    5. Mismatch in Project Timelines: Renewable projects can be commissioned within 12-18 months, whereas transmission corridors often require 3-5 years.
    6. Future Scale Requirement: India may require nearly 2,000 GW of renewable capacity by 2050 to meet rising electricity demand and electrification goals.

    How Can Existing Grid Assets Unlock Nearly 1,000 GW of Additional Clean Energy?

    1. Storage at Renewable Sites: Batteries can store surplus daytime generation and supply power during evening peaks, significantly increasing utilisation of existing transmission lines.
    2. Reuse of Coal Corridors: Underutilised transmission infrastructure connected to coal plants can be shared with renewable projects, unlocking the equivalent of nearly 100 GW of clean-energy capacity.
    3. Leveraging Existing Substations: Available capacity at transmission substations can accommodate additional renewable connections and support battery integration, enabling another 100 GW equivalent.
    4. Reconductoring Existing Lines: Replacing older conductors with high-temperature, low-sag conductors can nearly double power-carrying capacity on the same towers.
    5. Combined Impact: Storage, shared infrastructure, and reconductoring together can unlock more than 1,000 GW of clean-energy potential within the existing transmission footprint.

    Does Better Grid Utilisation Solve the Problem or Merely Defer It?

    1. Fastest Short-Term Solution: Grid optimisation can be deployed within months and quickly connect stranded renewable projects.
    2. Not a Substitute for Expansion: Existing infrastructure alone cannot support India’s projected renewable requirement of 2,000 GW.
    3. Scale Limitation: Future renewable parks and industrial electrification will require entirely new transmission corridors.
    4. Sequencing Advantage: Optimisation provides immediate relief while larger transmission projects are planned and executed.
    5. Grid Expansion Imperative: India plans a 40% expansion of its transmission network over the next decade, costing more than $100 billion. New corridors must incorporate advanced conductors and storage compatibility to avoid recreating future bottlenecks.
    6. Core Tension: The cheapest and fastest solution is grid optimisation, but the durable solution remains large-scale transmission expansion. Both approaches are necessary.

    What Regulatory and Policy Changes Are Needed?

    1. Storage-Linked Renewable Planning: Regulators should promote greater integration of storage with renewable projects to improve grid utilisation.
    2. State-Level Implementation: States and distribution utilities must incorporate storage and grid-efficiency measures into procurement and planning decisions.
    3. Technology-Oriented Procurement: Procurement norms should reward advanced transmission technologies that expand capacity without requiring new corridors.
    4. Integrated Infrastructure Planning: Renewable energy zones and transmission corridors should be developed in a coordinated manner.
    5. Future-Proof Transmission Design: New transmission infrastructure should be designed for significantly higher renewable penetration from the outset.

    What Does International Experience Reveal About Transmission Bottlenecks?

    1. United States: Delays in connecting renewable projects to the grid have emerged as a major obstacle to the clean-energy transition.
    2. Europe: Several European countries face similar transmission constraints despite substantial renewable deployment.
    3. Common Lesson: Cheap renewable generation alone does not guarantee energy transition success unless transmission capacity keeps pace.
    4. India’s Advantage: A unified national grid and a strong record of transmission expansion provide India with an opportunity to avoid similar bottlenecks.

    Conclusion

    India’s energy transition has moved from a generation challenge to a transmission challenge. The fastest gains lie in optimising existing grid infrastructure through storage, shared transmission assets, and reconductoring, which together can unlock nearly 1,000 GW of additional clean-energy potential. However, optimisation only buys time; achieving India’s long-term renewable ambitions requires simultaneous investment in new, high-capacity transmission corridors. India’s success will depend on pursuing both tracks together.
  • India’s First Commercial-Scale Coal-to-Ammonium Nitrate Project

    Why in the news?

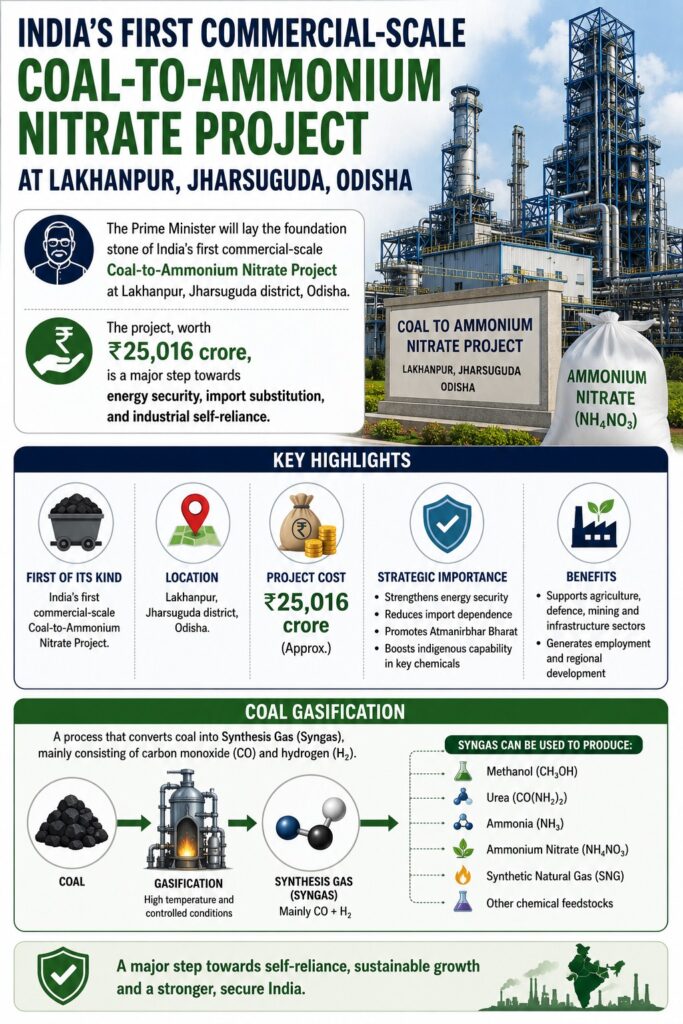
    The Prime Minister will lay the foundation stone of India’s first commercial-scale Coal-to-Ammonium Nitrate Project at Lakhanpur, Jharsuguda district, Odisha. The project, worth ₹25,016 crore, is a major step towards energy security, import substitution, and industrial self-reliance.

    Coal Gasification

    • A process that converts coal into Synthesis Gas (Syngas), mainly consisting of carbon monoxide (CO) and hydrogen (H₂).
    • Syngas can be used to produce Methanol, Urea, Ammonia, Ammonium Nitrate, Synthetic Natural Gas (SNG), Other chemical feedstocks

    Lakhanpur Project

    • India’s first commercial-scale Coal-to-Ammonium Nitrate facility.
    • Developed by Bharat Coal Gasification and Chemicals Limited, a joint venture of Bharat Heavy Electricals Limited and Coal India Limited.
    • Located on about 350 acres under Mahanadi Coalfields Limited land.
    • Capacity: 2,000 tonnes/day of Ammonium Nitrate.
    • Uses indigenous coal gasification technology developed by BHEL.
    • Receives ₹1,350 crore support under the Coal Ministry’s incentive scheme.

    Significance

    • Reduces dependence on imported natural gas, ammonia, methanol, and chemicals.
    • Supports Aatmanirbhar Bharat and domestic manufacturing.
    • Enhances value addition to India’s vast coal reserves (>400 billion tonnes).
    • Expected to boost downstream chemical and fertilizer industries.

    [2025] Consider the following substances:
    I. Ethanol
    II. Nitroglycerine
    III. Urea
    Coal gasification technology can be used in the production of how many of them?

    [A] Only one

    [B] Only two

    [C] All the three

    [D] None

  • RBI Temporarily Lifts Interest Rate Ceiling on FCNR(B) & NRE Deposits

    Why in the news?

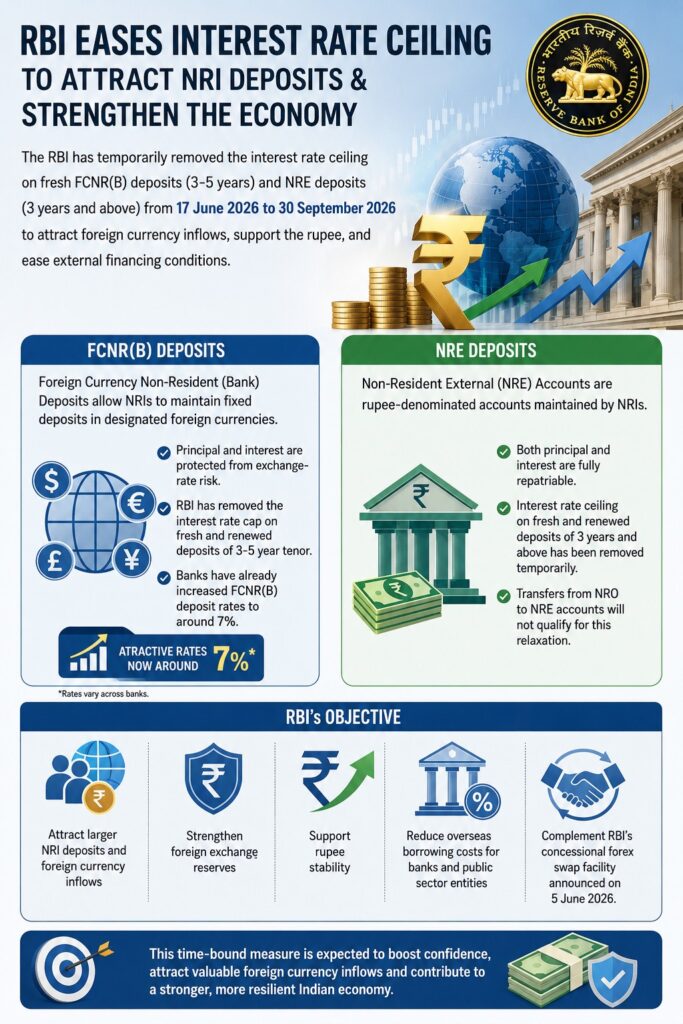
    The RBI has temporarily removed the interest rate ceiling on fresh FCNR(B) deposits (3-5 years) and NRE deposits (3 years and above) from 17 June 2026 to 30 September 2026 to attract foreign currency inflows, support the rupee, and ease external financing conditions.

    FCNR(B) Deposits

    • Foreign Currency Non-Resident (Bank) Deposits allow NRIs to maintain fixed deposits in designated foreign currencies.
    • Principal and interest are protected from exchange-rate risk.
    • RBI has removed the interest rate cap on fresh and renewed deposits of 3-5 year tenor.
    • Banks have already increased FCNR(B) deposit rates to around 7%.

    NRE Deposits

    • Non-Resident External (NRE) Accounts are rupee-denominated accounts maintained by NRIs.
    • Both principal and interest are fully repatriable.
    • Interest rate ceiling on fresh and renewed deposits of 3 years and above has been removed temporarily.
    • Transfers from NRO to NRE accounts will not qualify for this relaxation.

    RBI’s Objective

    • Attract larger NRI deposits and foreign currency inflows.
    • Strengthen foreign exchange reserves.
    • Support rupee stability.
    • Reduce overseas borrowing costs for banks and public sector entities.
    • Complement RBI’s concessional forex swap facility announced on 5 June 2026.

    Expected Impact

    • Analysts estimate $30-50 billion of inflows by Q3 FY27.
    • Similar FCNR(B) scheme in 2013 attracted nearly $25 billion.
    • Increased foreign currency liquidity may ease external sector pressures.

    [2021] Consider the following:
    1. Foreign currency convertible bonds
    2. Foreign institutional investment with certain conditions
    3. Global depository receipts
    4. Non-resident external deposits
    Which of the above can be included in Foreign Direct Investments?

    [A] 1, 2 and 3

    [B] 3 only

    [C] 2 and 4

    [D] 1 and 4

  • Is India producing more graduates than what the economy can absorb?

    Why in the News?

    India’s higher education system continues to expand rapidly, producing millions of graduates each year. Yet graduate unemployment remains high, exposing a growing disconnect between educational output and labour market absorption, especially in the age of AI, automation, and capital-intensive growth.

    Why is graduate unemployment rising despite expanding economic opportunities?

    1. Rapid Expansion of Higher Education: Engineering colleges and universities have increased graduate output faster than job creation.
    2. Sectoral Transition: IT services no longer absorb engineering graduates at earlier levels. New opportunities are emerging in banking, finance, defence, aerospace, semiconductors and space sectors.
    3. Mismatch in Skills: Employers seek practical and industry-ready skills that many graduates lack.
    4. Changing Nature of Jobs: New opportunities increasingly require specialised and interdisciplinary competencies.
    5. Weak Industry Exposure: Many students graduate without sufficient laboratory, manufacturing, or real-world experience.
    6. Industry-led Training: Companies increasingly run internal training programmes because many graduates lack industry-ready skills.
    7. Additional Training Burden: Firms often need to retrain recruits before deployment.

    Has AI and technological change widened the employability gap?

    1. Changing Skill Requirements: AI increases demand for problem-solving, analytical, and digital skills.
    2. Curriculum Lag: Universities cannot redesign programmes at the pace of technological change.
    3. Mid-Course Labour Market Shift: Many graduates entered college before AI became mainstream. The labour market changed faster than university curricula.
    4. New Competency Requirements: Employers seek AI literacy, data interpretation, and systems thinking.
    5. Transition Shock: Graduates trained under older curricula enter a rapidly evolving labour market.

    Why is economic growth not translating into proportionate job creation?

    1. Capital-Intensive Investments: Semiconductors and advanced manufacturing generate high output with fewer workers.
    2. Automation of Production: Robotics and digital manufacturing reduce labour requirements.
    3. Automation of Manufacturing: Manufacturing previously absorbed engineers in supervisory and operational roles. Robotics and digital production systems have reduced demand for such middle-level positions.
    4. Limited Labour Absorption: Manufacturing expansion no longer guarantees mass employment.
    5. Output-Employment Decoupling: Factory output can rise significantly without a proportional increase in workforce requirements.

    Is India facing a graduate surplus or a skills mismatch?

    1. Not a Numerical Surplus Alone: Several sectors continue to demand skilled professionals.
    2. Quality Gap: Available graduates often do not possess industry-required competencies.
    3. Design and R&D Shortage: Advanced sectors need specialised talent that remains limited.
    4. Employability Deficit: The issue lies more in readiness than in educational attainment.

    Is India’s employment challenge a problem of graduate surplus or skill deficit?

    1. Graduate Expansion: Higher education enrolment has expanded rapidly, producing graduates faster than formal job creation.
    2. Skill Mismatch: Many graduates lack industry-ready, practical and interdisciplinary skills despite holding degrees.
    3. Dual Reality: Graduate unemployment coexists with shortages of specialised talent in sectors such as AI, semiconductors, finance and advanced manufacturing.
    4. Changing Demand Structure: The economy increasingly rewards digital literacy, problem-solving and applied technical competencies over generic credentials.
    5. Underemployment Trap: Many graduates accept jobs below their qualifications or enter informal and gig work due to limited suitable opportunities.
    6. Core Challenge: India’s employment problem is a structural mismatch between educational output and labour market demand rather than a pure shortage of jobs or graduates.

    Why does manufacturing versus innovation present a false choice?

    1. Manufacturing Needs Innovation: Modern industry depends on design, research, and technology.
    2. Innovation Creates High-Value Jobs: R&D and product development generate skilled employment.
    3. Global Value Chains Reward Innovation: Countries capturing design and intellectual property gain more value.
    4. Balanced Strategy Required: Manufacturing and innovation must advance together.

    Has India developed indigenous technological capabilities?

    1. Growing Corporate Capability: Firms such as Mahindra and Tata Motors have strengthened engineering capacity.
    2. Corporate Capability Building: Indian firms have moved beyond assembly and increasingly participate in engineering, design and product development.
    3. Increasing Design Competence: Indian engineers contribute to complex product development.
    4. Progress in Indigenous Systems: Domestic technological capabilities have expanded across sectors.
    5. Capability Gap Persists: Advanced R&D opportunities remain fewer than the number of graduates produced.

    Can entrepreneurship absorb the growing graduate workforce?

    1. Job Creation Beyond Wage Employment: Startups can become major employment generators.
    2. Need for Risk Capital: Venture funding remains critical for innovation-led firms.
    3. Technology Entrepreneurship Opportunity: Deep-tech sectors offer long-term employment potential.
    4. Ecosystem Constraints: Financing and scaling challenges continue to limit startup growth.

    What must change in higher education?

    1. Industry-Academia Integration: Universities and firms must collaborate closely.
    2. Co-created Curricula: Universities should develop programmes jointly with industry instead of designing courses in isolation.
    3. Practical Learning: Greater emphasis on laboratories, internships, and projects.
    4. Skill Development: Education must prioritise employability alongside academic credentials.
    5. Continuous Upgradation: Institutions must adapt faster to technological change.

    Conclusion

    India’s problem is not an excess of graduates but a growing mismatch between educational outcomes and labour market requirements. AI, automation, and capital-intensive growth have altered the nature of employment faster than universities have adapted. The solution lies in aligning education, industry, innovation, and entrepreneurship so that graduate creation and job creation move in the same direction.

    PYQ Relevance

    [UPSC 2023] Skill development programs have succeeded in increasing human resource supply to various sectors. In the context of the statement, analyze the linkages between education, skill and employment.

    Linkage: The PYQ examines the link between education, skills and employability in India’s labour market. The article highlights how weak alignment between education, skills and industry demand has contributed to rising graduate unemployment despite expanding higher education.

  • Qadian-Beas Railway Line Project Revived

    Why in the news?

    The Government of India has revived the Qadian-Beas New Railway Line Project in Punjab after nearly a century. The project was originally approved during 1928-29 by the North-Western Railway but remained incomplete.

    Key Highlights

    • Length: 39.68 km broad-gauge railway line.
    • Cost: Approximately ₹1,400 crore.
    • Implementing Agency: Northern Railway.
    • Route: Qadian (Gurdaspur) – Dhapai – Ghuman – Butala – Sathiala – Beas (Amritsar).
    • Revived under the Socially Desirable Rail Connectivity Programme.

    Infrastructure Features

    • 2 crossing stations (Ghuman and Butala).
    • 11 major bridges and 121 minor bridges.
    • 54 Road Under Bridges (RUBs).
    • Modern signalling and telecommunication systems.
    • Deployment of Kavach, India’s indigenous train collision avoidance system.

    Significance

    • Connectivity: Brings several areas of Punjab’s Majha region onto the railway network. Improves mobility and accessibility for residents.
    • Strategic Importance: Provides an alternative corridor to the Amritsar-Pathankot railway section during emergencies. Enhances resilience of railway operations in northern India.
    • Economic Benefits
      • Better market access for farmers.
      • Faster transportation of agricultural produce.
      • Boost to trade, commerce, and small-scale industries.
      • Employment generation during construction and operation.
    • Tourism: Improves access to major religious destinations including Qadian, Dera Baba Jaimal Singh, Sri Darbar Sahib, Dera Baba Nanak, and Gurdwara Achal Sahib
  • The RBI and its growing fiscal role 

    Why in the News?

    The RBI approved a record surplus transfer of ₹2.87 lakh crore to the Union government for FY26. The transfer follows a sharp expansion in the RBI’s balance sheet and rising earnings from reserve management, foreign assets and market operations, triggering debate over the RBI’s evolving place within India’s fiscal architecture.

    Why is the RBI no longer functioning only as a monetary authority?

    1. Traditional Role: The RBI’s primary mandate is monetary stability, financial stability and currency management.
    2. Record Fiscal Contribution: The RBI transferred a record ₹2.87 lakh crore to the Union government in FY26, demonstrating its growing importance as a source of fiscal resources.
    3. Expanding Financial Footprint: The RBI’s balance sheet expanded by 20.6% to ₹91.97 lakh crore by March 2026, increasing the scale at which its operations influence fiscal outcomes.
    4. Rising Operational Income: Gross income rose by 26%, reflecting the growing revenue-generating capacity of RBI operations.
    5. Magnitude of Fiscal Impact: The transfer exceeds the annual budgets of several Indian States, indicating the substantial fiscal significance of RBI earnings.
    6. Institutional Shift: Reserve management, foreign asset holdings and market operations now generate fiscal resources alongside monetary outcomes, giving the RBI a role that extends beyond traditional central banking.

    How has the RBI’s management of reserves become a source of fiscal capacity?

    1. Reserve Management: RBI actively manages foreign exchange reserves, gold holdings and securities portfolios as part of its monetary mandate.
    2. Gold Reserve Expansion: RBI acquired almost $12 billion worth of gold, increasing the scale of reserve assets under its management.
    3. Foreign Asset Expansion: RBI purchased roughly $75 billion in foreign currency assets, expanding income-generating reserve holdings.
    4. Income-Generating Operations: Exchange-rate intervention, foreign asset holdings and securities investments generate significant financial returns.
    5. Fiscal Contribution: Returns from reserve management increasingly contribute to the RBI surplus transferred to the Union government.
    6. Institutional Consequence: Activities undertaken for monetary and financial stability now generate substantial fiscal resources, linking reserve management to government finances.

    Can a central bank remain institutionally independent when it becomes fiscally important?

    1. Institutional Distance: Central bank credibility depends on insulation from day-to-day fiscal compulsions.
    2. Fiscal Dependence: Large surplus transfers strengthen government finances without taxation or borrowing.
    3. Monetary-Fiscal Interdependence: Decisions affecting the RBI’s balance sheet increasingly affect fiscal outcomes. The growing fiscal role of central banks blurs the traditional boundary between monetary policy and fiscal policy.
    4. Changing Incentives: Fiscal significance increases political interest in central-bank earnings.
    5. Global Experience: Quantitative easing demonstrated how central-bank balance sheets can become instruments of fiscal support.
    6. Core Tension: The RBI remains a monetary authority while simultaneously becoming an important fiscal actor.

    Why does the RBI’s growing fiscal role create a federalism challenge?

    1. Union Ownership: RBI profits accrue entirely to the Union government.
    2. Outside Fiscal Devolution: RBI transfers are not included in the divisible pool shared through Finance Commission awards.
    3. No Automatic State Share: States receive no direct claim on RBI-generated revenues.
    4. Scale of Asymmetry: The ₹2.87 lakh crore transfer exceeds the annual budgets of several States, highlighting the magnitude of resources accruing exclusively to the Centre.
    5. State Fiscal Constraints: States retain major expenditure responsibilities and face borrowing restrictions under Article 293, limiting their ability to offset revenue asymmetries.
    6. Fiscal Centralisation: Large public resources generated through monetary institutions strengthen the Centre’s fiscal position.
    7. Federal Blind Spot: RBI dividend transfers illustrate a wider pattern in which cesses, surcharges and borrowing restrictions increasingly concentrate fiscal resources at the Union level.

    Conclusion

    The RBI’s record surplus transfer reflects a deeper institutional transformation rather than a one-time financial event. The central bank has evolved from being primarily a guardian of monetary stability into an increasingly important source of fiscal capacity for the Union government. The unresolved challenge is preserving central bank independence and strengthening fiscal federalism as monetary institutions become more deeply intertwined with public finance.

  • Green Hydrogen Certification Portal of India (GHCI) & National Green Hydrogen Mission (NGHM)

    Why in the news?

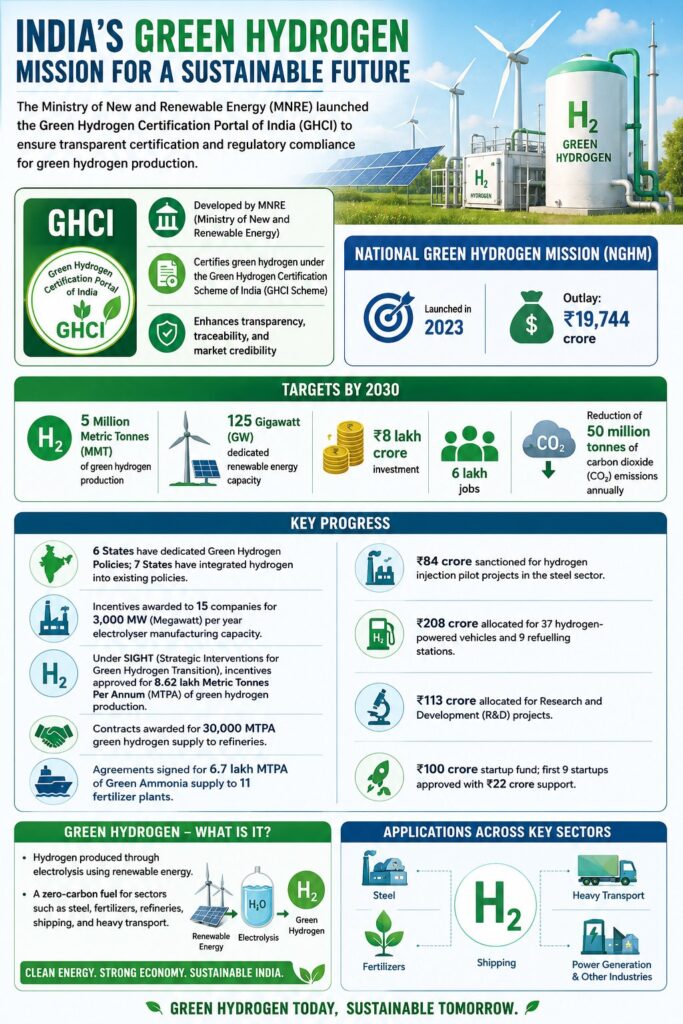
    The Ministry of New and Renewable Energy (MNRE) launched the Green Hydrogen Certification Portal of India (GHCI) to ensure transparent certification and regulatory compliance for green hydrogen production.

    GHCI

    • Developed by MNRE (Ministry of New and Renewable Energy).
    • Certifies green hydrogen under the Green Hydrogen Certification Scheme of India (GHCI Scheme).
    • Enhances transparency, traceability, and market credibility.

    National Green Hydrogen Mission (NGHM)

    • Launched in 2023.
    • Outlay: ₹19,744 crore.

    Targets by 2030

    • 5 Million Metric Tonnes (MMT) of green hydrogen production.
    • 125 Gigawatt (GW) dedicated renewable energy capacity.
    • ₹8 lakh crore investment.
    • 6 lakh jobs.
    • Reduction of 50 million tonnes of carbon dioxide (CO₂) emissions annually.

    Key Progress

    • 6 States have dedicated Green Hydrogen Policies; 7 States have integrated hydrogen into existing policies.
    • Incentives awarded to 15 companies for 3,000 MW (Megawatt) per year electrolyser manufacturing capacity.
    • Under SIGHT (Strategic Interventions for Green Hydrogen Transition), incentives approved for 8.62 lakh Metric Tonnes Per Annum (MTPA) of green hydrogen production.
    • Contracts awarded for 30,000 MTPA green hydrogen supply to refineries.
    • Agreements signed for 6.7 lakh MTPA of Green Ammonia supply to 11 fertilizer plants.
    • ₹84 crore sanctioned for hydrogen injection pilot projects in the steel sector.
    • ₹208 crore allocated for 37 hydrogen-powered vehicles and 9 refuelling stations.
    • ₹113 crore allocated for Research and Development (R&D) projects.
    • ₹100 crore startup fund; first 9 startups approved with ₹22 crore support.

    Green Hydrogen

    • Hydrogen produced through electrolysis using renewable energy.
    • A zero-carbon fuel for sectors such as steel, fertilizers, refineries, shipping, and heavy transport.

    [2023] With reference to green hydrogen, consider the following statements:
    1. It can be used directly as a fuel for internal combustion.
    2. It can be blended with natural gas and used as fuel for heat or power generation.
    3. It can be used in the hydrogen fuel cell to run vehicles.
    How many of the above statements are correct?

    [A] Only one

    [B] Only two

    [C] All three

    [D] None

  • Periodic Labour Force Survey (PLFS) Monthly Bulletin, May 2026

    Why in the news?

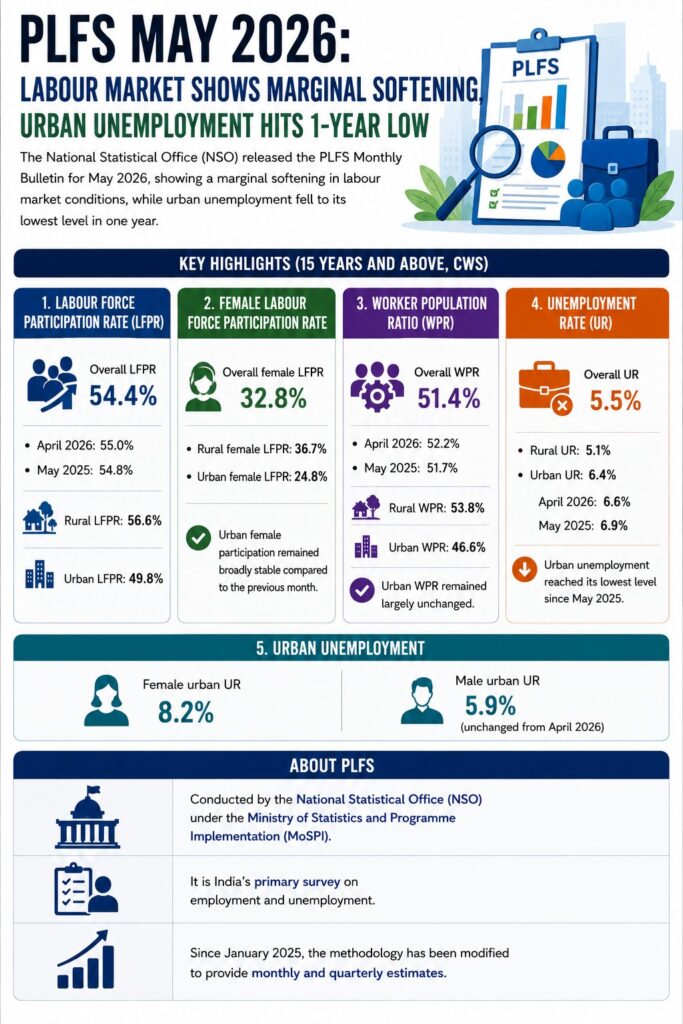
    The National Statistical Office (NSO) released the PLFS Monthly Bulletin for May 2026, showing a marginal softening in labour market conditions, while urban unemployment fell to its lowest level in one year.

    Key Highlights (15 years and above, Current Weekly Status)

    Labour Force Participation Rate (LFPR)

    • Overall LFPR: 54.4%
      • April 2026: 55.0%
      • May 2025: 54.8%
    • Rural LFPR: 56.6%
    • Urban LFPR: 49.8%

    Female LFPR

    • Overall female LFPR: 32.8%
    • Rural female LFPR: 36.7%
    • Urban female LFPR: 24.8%
    • Urban female participation remained broadly stable compared to the previous month.

    Worker Population Ratio (WPR)

    • Overall WPR: 51.4%
      • April 2026: 52.2%
      • May 2025: 51.7%
    • Rural WPR: 53.8%
    • Urban WPR: 46.6%
    • Urban WPR remained largely unchanged.

    Unemployment Rate (UR)

    • Overall UR: 5.5%
    • Rural UR: 5.1%
    • Urban UR: 6.4%
      • April 2026: 6.6%
      • May 2025: 6.9%
    • Urban unemployment reached its lowest level since May 2025.

    Urban Unemployment

    • Female urban UR: 8.2%
    • Male urban UR: 5.9% (unchanged from April 2026).

    About PLFS

    • Conducted by the National Statistical Office (NSO) under the Ministry of Statistics and Programme Implementation (MoSPI).
    • It is India’s primary survey on employment and unemployment.
    • Since January 2025, the methodology has been modified to provide monthly and quarterly estimates.

    [2020] With reference to the Indian economy after the 1991 economic liberalization, consider the following statements:

    1.Worker productivity (Rs. per worker at 2004 — 05 prices) increased in urban areas while it decreased in rural areas.
    2.The percentage share of rural areas in the workforce steadily increased.
    3.In rural areas, the growth in non-farm economy increased.
    4.The growth rate in rural employment decreased.

    Which of the statements given above is/are Correct?
    a) 1 and 2 only
    b) 3 and 4 only
    c) 3 only
    d) 1, 2 and 4 only

  • Reachable vs hard-to-serve: How logistics takes demand growth places

    Why in the News?

    India’s growth story is increasingly being shaped by logistics efficiency rather than income growth alone. There is a structural shift from a “hard-to-serve” economy to a “reachable” economy, where reliable logistics determines whether demand can actually translate into consumption. Also, India has improved from 44th rank in 2018 to 38th rank in 2023 in the World Bank’s Logistics Performance Index (LPI).

    What does the shift from a “Hard-to-Serve” to a “Reachable” Economy signify?

    1. Hard-to-Serve Markets: Consumers possess purchasing power but remain disconnected from efficient supply chains.
    2. Reachability: Logistics networks ensure reliable movement of goods irrespective of geographic distance.
    3. Demand Realisation: Consumption materialises only when products are physically available.
    4. Economic Inclusion: Smaller towns and rural markets become part of mainstream consumption networks.
    5. Structural Shift: Market access increasingly matters as much as income growth.

    How is India’s Growth Narrative Shifting from Income to Reachability?

    1. Traditional Growth Drivers: Wages, remittances, rural credit, and consumption expenditure have historically dominated macroeconomic discussions.
    2. Emerging Constraint: Distribution efficiency rather than production capacity increasingly determines consumption expansion.
    3. Distance Economics: Physical distance now affects demand realization more than production availability.
    4. Consumption Geography: Growth increasingly depends on whether products can reliably reach underserved markets.
    5. Reachability Paradigm: Economic opportunity is shifting from income availability to market accessibility.

    How Have Logistics Reforms Reduced Internal Market Frictions?

    1. Reduced Friction: Policy reforms have steadily lowered internal trade barriers.
    2. Economic Corridors: Strengthen movement of goods across regions.
    3. Line-Haul Predictability: Improves consistency of long-distance freight movement.
    4. Digital Systems: Enhance shipment tracking and visibility.
    5. Supply-Chain Transparency: Reduces uncertainty in inventory planning and replenishment.
    6. Market Integration: Creates a more unified national market.

    What Does India’s Logistics Performance Reveal?

    1. World Bank LPI Improvement: India improved from 44th rank (2018) to 38th rank (2023) among 139 countries.
    2. Competitiveness Gains: Reflects improvements in logistics infrastructure and service quality.
    3. Infrastructure Modernization: Indicates gradual strengthening of transport and supply-chain ecosystems.
    4. Economic Significance: Better logistics directly influences investment decisions and industrial competitiveness.

    World Bank Logistics Performance Index (LPI)

    IndicatorMeasures
    CustomsBorder clearance efficiency
    InfrastructureQuality of transport infrastructure
    International ShipmentsEase of arranging competitive shipments
    Logistics CompetenceQuality of logistics services
    Tracking & TracingShipment visibility
    TimelinessDelivery reliability

    How Are Dedicated Freight Corridors Transforming Market Access?

    1. Operational Corridors: DFCs are operational across major stretches.
    2. Key States Benefited: Uttar Pradesh, Bihar, Rajasthan, and Gujarat.
    3. Distance Compression: Previously distant markets become commercially viable.
    4. Expanded Catchment Areas: Businesses can serve wider markets.
    5. Lower Transit Uncertainty: Supports inventory optimization.
    6. Manufacturing Competitiveness: Improves production-to-market integration.

    Dedicated Freight Corridors

    1. Eastern DFC: Punjab-Haryana-UP-Bihar-West Bengal.
    2. Western DFC: Dadri (UP) to Jawaharlal Nehru Port (Maharashtra).
    3. Outcome: Faster freight movement, reduced logistics costs, decongestion of passenger rail routes.

    Why Has Supply-Chain Resilience Become More Important than Cost Arbitrage?

    1. Global Disruptions: Pandemic and geopolitical disruptions exposed vulnerabilities.
    2. Inventory Risk: Companies faced supply shortages despite cost optimization.
    3. Lead-Time Predictability: Became a key determinant of sourcing decisions.
    4. Procurement Shift: Focus moved from lowest cost to reliability.
    5. Resilience Arbitrage: Competitive advantage increasingly depends on network resilience.
    6. Strategic Reorientation: Supply chains prioritize continuity over marginal cost savings.

    Factors Driving Supply-Chain Resilience

    1. Diversified sourcing
    2. Multi-modal transportation
    3. Digital supply-chain monitoring
    4. Inventory optimization
    5. Nearshoring and friend-shoring strategies

    How Does Logistics Influence Manufacturing Competitiveness?

    1. Manufacturing-Logistics Linkage: Logistics capability determines whether manufacturing strengths translate into market success.
    2. Supply-Chain Reliability: Enhances domestic and export competitiveness.
    3. Production Planning: Stable replenishment cycles improve operational efficiency.
    4. Inventory Rationalization: Reduces excess stockholding.
    5. Capital Efficiency: Frees working capital previously locked in buffers.
    6. Industrial Growth: Supports expansion into new consumer markets.

    How Are Businesses Redrawing India’s Demand Map?

    1. Market Expansion: Firms increasingly target smaller cities and emerging consumption centres.
    2. Latent Demand Activation: Improved logistics reveals previously inaccessible demand.
    3. Invisible Tariff Removal: Distance and uncertainty functioned as hidden barriers.
    4. Distribution Confidence: Encourages deeper market penetration.
    5. Commercial Viability: Markets become profitable due to service reliability rather than demand creation.
    6. Consumption Inclusion: Broadens participation in economic growth.

    Why is Predictable Delivery a Game-Changer for Small Producers?

    1. Small Manufacturer Advantage: Predictability reduces working-capital stress.
    2. Farm-Gate Producers: Benefit from assured movement of goods.
    3. Receivable Management: Lower delays reduce financial uncertainty.
    4. Congestion Avoidance: Dedicated freight capacity minimizes bottlenecks.
    5. Expressway Connectivity: Supports reliable movement between production and consumption centres.
    6. Competitive Inclusion: Small firms can participate in national markets.
      • Example: A farm-gate producer operating on thin margins can now serve distant markets with greater confidence due to predictable transportation schedules and reduced delivery uncertainty.

    Why Does the Last-Mile Gap Remain India’s Biggest Logistics Challenge?

    1. Operational Reality: Infrastructure efficiency on paper does not always translate into service quality.
    2. Urban Congestion: Causes delays despite improved transport corridors.
    3. Land Constraints: Limit logistics facility expansion.
    4. Driver Availability: Creates execution bottlenecks.
    5. Corridor-to-Last-Mile Gap: Remains a major obstacle.
    6. Underserved Markets: Continue to face accessibility challenges.

    Last-Mile Connectivity

    • Definition: Final stage of movement of goods from transportation hubs to end consumers.
    • Challenges: Poor rural roads, Urban traffic congestion, Fragmented logistics networks, High delivery costs, and Warehouse limitations
    • Government Initiatives: PM Gati Shakti, Bharatmala Pariyojana, National Logistics Policy (2022), and Unified Logistics Interface Platform (ULIP)

      Can Logistics Become a Revenue Condition Rather than a Cost Discipline?

      1. Traditional View: Logistics treated primarily as a cost centre.
      2. Emerging View: Logistics increasingly determines revenue realization.
      3. Demand Realization: Better logistics converts latent demand into actual purchases.
      4. Market Reach: Expands consumer access.
      5. Product Availability: Ensures purchase intent translates into consumption.
      6. Growth Multiplier: Strengthens economic activity beyond transportation efficiency.

      Conclusion

      India’s growth increasingly depends on converting purchasing power into actual consumption through efficient logistics. By improving market reachability and reducing supply-chain frictions, logistics is emerging as a key enabler of demand growth, economic integration, and inclusive development.

      Value Addition

      The National Logistics Policy (NLP)

      1. It is a comprehensive, cross-sectoral framework launched in 2022, to reduce domestic logistics costs and enhance the global competitiveness of Indian goods.
      2. Managed by the Department for Promotion of Industry and Internal Trade (DPIIT), the policy optimizes the “soft infrastructure” (processes, digital integration, and regulatory systems) to complement the hard infrastructure built under the PM GatiShakti National Master Plan.

      Core Targets (To be Achieved by 2030) 

      1. Reduce Costs: Lower India’s logistics cost from 13-14% of GDP to a single-digit global benchmark (under 10%).
      2. Improve Global Ranking: Propel India into the top 25 nations on the World Bank’s Logistics Performance Index (LPI).
      3. Data-Driven Infrastructure: Build automated Decision Support Systems (DSS) for data-backed logistics planning.

      Comprehensive Logistics Action Plan (CLAP) 

      The NLP executes its objectives through eight critical action areas outlined in the Comprehensive Logistics Action Plan: 

      1. Integrated Digital Logistics Systems: Merging multiple ministry platforms into one central gateway.
      2. Physical Asset Standardization: Standardizing containers, trucks, and warehouses to improve service quality.
      3. Human Resource Development: Building unified training modules to skill India’s massive logistics workforce.
      4. State Engagement: Aligning central targets with state-level logistics actions and local city plans.
      5. EXIM Logistics: Addressing structural bottlenecks to ease Export-Import container movement.
      6. Service Improvement Framework: Setting up quick-response cells to clear regulatory and industry roadblocks.
      7. Sectoral Efficiency Plans: Designing specialized movement plans for primary commodities like coal, steel, and grains.
      8. Logistics Park Facilitation: Accelerating the development of Multi-Modal Logistics Parks (MMLPs). 

      PYQ Relevance

      [UPSC 2021] “Investment in infrastructure is essential for more rapid and inclusive economic growth. Discuss in the light of India’s experience.”

      Linkage: The question examines the role of infrastructure as a catalyst for economic growth, market integration, and inclusive development. The article demonstrates how logistics infrastructure, through Dedicated Freight Corridors, PM Gati Shakti, Bharatmala, digital logistics platforms, and supply-chain reforms, is reducing market frictions and improving reachability

    1. India’s push behind E20 fuel: Reasons, and pitfalls

      Why in the News?

      India has announced measures to facilitate ethanol-petrol blends beyond E20, including the decision to permit ethanol blends ranging from 22% to 30% at retail outlets and proposed amendments to recognize E85 and higher blends under the Central Motor Vehicles Rules. This is the first major policy move toward creating a flex-fuel vehicle ecosystem in India.

      What is E20 Fuel and Why is it Important?

      1. Definition: E20 is a fuel blend containing 20% ethanol and 80% petrol by volume.
      2. Ethanol: Ethyl alcohol produced primarily from sugarcane molasses, sugar syrup, maize, damaged food grains, and agricultural biomass.
      3. National Standard: E20 has become India’s standard petrol blend under the Ethanol Blended Petrol (EBP) Programme.
      4. Target Achievement: India advanced its E20 target from 2030 to 2025 and achieved rollout in several regions ahead of schedule.
      5. Strategic Objective: Reduces crude oil imports, improves energy security, lowers carbon emissions, and provides additional income opportunities for farmers.

      Evolution of Ethanol Blending in India

      BlendEthanol ContentStatus
      E55% Ethanol + 95% PetrolInitial Phase
      E1010% Ethanol + 90% PetrolNationwide Rollout
      E2020% Ethanol + 80% PetrolPresent Standard
      E2525% Ethanol + 75% PetrolProposed Next Step
      E8585% Ethanol + 15% PetrolFor Flex-Fuel Vehicles
      E100100% EthanolPure Ethanol Fuel

      Why is E20 Considered a Major Milestone?

      1. Import Reduction: Helps reduce India’s dependence on imported crude oil (around 85.5% dependence).
      2. Climate Action: Reduces greenhouse gas emissions from the transport sector.
      3. Farmer Welfare: Creates demand for sugarcane, maize and other ethanol feedstocks.
      4. Circular Economy: Utilizes agricultural surplus and damaged food grains productively.
      5. Energy Transition: Serves as the foundation for the eventual shift toward E25, E85 and flex-fuel vehicles.

      Difference Between Ethanol Blending and Flex-Fuel Vehicles

      AspectE20 VehicleFlex-Fuel Vehicle (FFV)
      Fuel CompatibilityDesigned mainly for E20Operates on E20, E25, E85, E100
      Engine CalibrationFixedAutomatically adjusts
      Consumer ChoiceLimitedHigh
      Future ReadinessModerateHigh
      ExampleMost new Indian vehiclesBrazil’s dominant vehicle category

      What policy measures have been announced for higher ethanol blending?

      1. Higher Blend Approval: Government has approved ethanol-petrol blends ranging from 22% to 30% ethanol for retail sale.
      2. Flex-Fuel Framework: Proposed amendments seek recognition of E85 and higher ethanol blends under Central Motor Vehicle Rules.
      3. Multiple Fuel Categories: Moves away from a single standard fuel system towards multiple ethanol blend options.
      4. BIS Notification: Bureau of Indian Standards (BIS) notified standards for higher ethanol blends on May 19.
      5. Phased Transition: Government plans a gradual progression from E20 to E25 and subsequently toward E85-E100 fuels.

      What are flex-fuel vehicles and how do they work?

      Flex-Fuel Technology

      1. Definition: Vehicles designed to operate on varying mixtures of petrol and ethanol.
      2. Fuel Adaptability: Can automatically adjust engine parameters based on ethanol concentration.
      3. Electronic Control Module (ECM): Detects fuel composition and regulates ignition timing, fuel injection and emissions.
      4. Fuel Injection System: Delivers fuel into combustion chambers based on blend requirements.
      5. Combustion Optimization: Ensures efficient performance despite varying ethanol content.

      Components of a Flex-Fuel Vehicle

      1. Fuel Tank: Stores ethanol-petrol blend.
      2. Fuel Pump: Transfers fuel from tank to engine.
      3. Fuel Line: Carries fuel through the system.
      4. Fuel Injection System: Delivers fuel into combustion chamber.
      5. Electronic Control Module (ECM): Controls fuel-air mixture and engine performance.

      Why is India pushing for higher ethanol blends?

      Energy Security

      1. Crude Oil Dependence: India imports approximately 85.5% of its crude oil requirement.
      2. Strategic Vulnerability: High import dependence exposes India to geopolitical shocks and global oil price volatility.
      3. West Asia Lessons: Recent regional conflicts highlighted risks associated with external energy dependence.

      Import Reduction

      1. Foreign Exchange Savings: Higher domestic fuel production reduces oil import bills.
      2. Supply Diversification: Expands use of domestically produced biofuels.

      Agricultural Economy

      1. Farmer Support: Creates stable demand for sugarcane and other ethanol feedstocks.
      2. Regional Benefits: Strong support from agricultural regions, particularly Maharashtra and Uttar Pradesh, major sugarcane-producing states.

      Climate and Decarbonization Goals

      1. Cleaner Fuel: Ethanol blending reduces lifecycle carbon emissions compared with pure petrol.
      2. Biofuel Expansion: Supports India’s National Biofuel Policy objectives.

      Why is the E20 transition itself still incomplete?

      1. Recent Transition: E20 became the nationwide standard only recently.
      2. Limited Adaptation Time: Many vehicle owners have had insufficient time to assess long-term impacts.
      3. Legacy Fleet: Large numbers of older vehicles remain on roads.

      How can higher ethanol blends affect vehicle performance?

      Engine Damage Concerns

      1. Water Absorption: Ethanol attracts moisture and is corrosive in nature.
      2. Material Degradation: May affect engine components not designed for higher ethanol content.
      3. Vulnerable Components: Rubber parts, valves, piston heads and fuel-system components may experience wear.
      4. Two-Wheeler Concerns: Older two-wheelers may face greater compatibility challenges.

      Mileage Reduction

      1. Lower Energy Density: Ethanol contains less energy than petrol.
      2. Fuel Efficiency Impact: Consumers may experience lower mileage.
      3. Estimated Loss: Mileage reduction could range between 5% and 12%, depending on vehicle design and model year.

      Cold Start Problems

      1. Ignition Issues: Higher ethanol content burns at a higher temperature.
      2. Winter Performance: Vehicles may experience difficulty starting during cold mornings.

      Are concerns regarding engine damage scientifically established?

      1. Scientific Uncertainty
        1. Government Position: Petroleum Ministry maintains that concerns regarding higher ethanol blends are not fully supported by conclusive scientific evidence.
        2. Industry Assessment: Automobile experts acknowledge that long-term impacts require more extensive studies.
        3. Vehicle Variation: Effects may differ across manufacturers, engine designs and vehicle age.
      2. Long-Term Wear
        1. Potential Risks: Accelerated wear of rubber parts, valves and piston heads remains a concern raised by industry stakeholders.
        2. Data Gap: Long-duration field studies remain limited.

      Why are automobile manufacturers worried?

      1. Additional R&D: E25 transition requires fresh engineering validation.
        1. Material Compatibility: Fuel-system components require redesign for higher ethanol concentrations.
        2. Corrosion Resistance: Manufacturers must improve resistance to ethanol-induced corrosion.
        3. Durability Standards: Vehicle endurance testing requirements will increase.
      2. Certification Challenges
        1. Homologation Requirement: New fuel blends require fresh certification.
        2. Current Approval Base: Existing vehicles are largely certified only for E20 compatibility.
        3. Regulatory Delays: Industry seeks greater clarity before implementation.
      3. Cost Implications
        1. Higher Manufacturing Costs: Vehicle redesign increases production costs.
        2. Consumer Burden: Additional costs likely to be passed on to consumers.

      What fuel availability and market challenges remain?

      1. Limited Consumer Choice
        1. Single Blend Availability: Oil Marketing Companies (OMCs) currently indicate that only one ethanol blend may be available at a given fuel station.
        2. No Fuel Selection: Consumers may not have freedom to choose between multiple blends.
      2. Infrastructure Readiness
        1. Distribution Constraints: Fuel stations require storage and dispensing adjustments.
        2. Supply Chain Adaptation: OMCs must ensure uninterrupted supply of multiple blends.
      3. Pricing Concerns
        1. Vehicle-Fuel Compatibility: Consumers may need to consider both vehicle type and fuel availability.
        2. Market Uncertainty: Pricing structure for higher blends remains unclear.

      How has Brazil successfully implemented high ethanol blending?

      1. Oil Shock Origins: Brazil’s ethanol programme began during the 1970s oil crisis.
      2. Integrated Ecosystem: Ethanol production and automobile manufacturing evolved together.
      3. Consumer Choice: Nearly every fuel station offers both petrol and ethanol options.
      4. Flexible Fuel Market: Consumers can choose fuel based on price and availability.

      Current Brazilian System

      1. Blended Petrol: Contains approximately 27-32% ethanol.
      2. Pure Ethanol Option: Availability of E100 (hydrous ethanol).
      3. Flex-Fuel Dominance: Majority of vehicles can operate on multiple fuel blends.

      Key Difference from India

      1. Consumer Flexibility: Brazil offers fuel choice, whereas India currently lacks such flexibility.
      2. Ecosystem Maturity: Brazil’s transition evolved over decades.

      Value Addition 

      Ethanol Blending Programme (EBP)

      Launch: Initiated in 2003, Accelerated under National Biofuel Policy.

      Targets

      1. E10 achieved nationwide.
      2. E20 target achieved ahead of schedule in many regions.
      3. Long-term movement toward higher blends and flex-fuel systems.

      Conclusion

      India’s transition beyond E20 marks the next phase of its energy security and biofuel strategy. Higher ethanol blends and flex-fuel vehicles can reduce crude oil dependence, strengthen farmer incomes, and support climate goals. However, the success of this transition will depend on a calibrated rollout, scientific validation of engine compatibility, adequate fuel infrastructure, consumer choice, and industry preparedness. The challenge is not merely increasing ethanol content but creating a reliable and economically viable flex-fuel ecosystem, as demonstrated by Brazil’s experience.

      PYQ Relevance

      [UUPSC 2018] Access to affordable, reliable, sustainable and modern energy is the sine qua non to achieve Sustainable Development Goals (SDGs). Comment on the progress made in India in this regard. 

      Linkage: The question examines India’s efforts towards achieving energy security through sustainable and alternative energy sources. India’s transition from E20 to higher ethanol blends (E25, E85 and flex-fuel vehicles) represents a major component of its clean energy and energy security strategy. Ethanol blending reduces crude oil imports, supports decarbonisation of the transport sector, and contributes to SDG 7 (Affordable and Clean Energy), SDG 12 (Responsible Consumption and Production), and SDG 13 (Climate Action).