💥Join UPSC 2027,2028 Mentorship (August Batch) + XFactor Notes & Microthemes PDF

Subject: Health

  • The birth story no one prepared me for

    The birth story no one prepared me for

    Why in the News

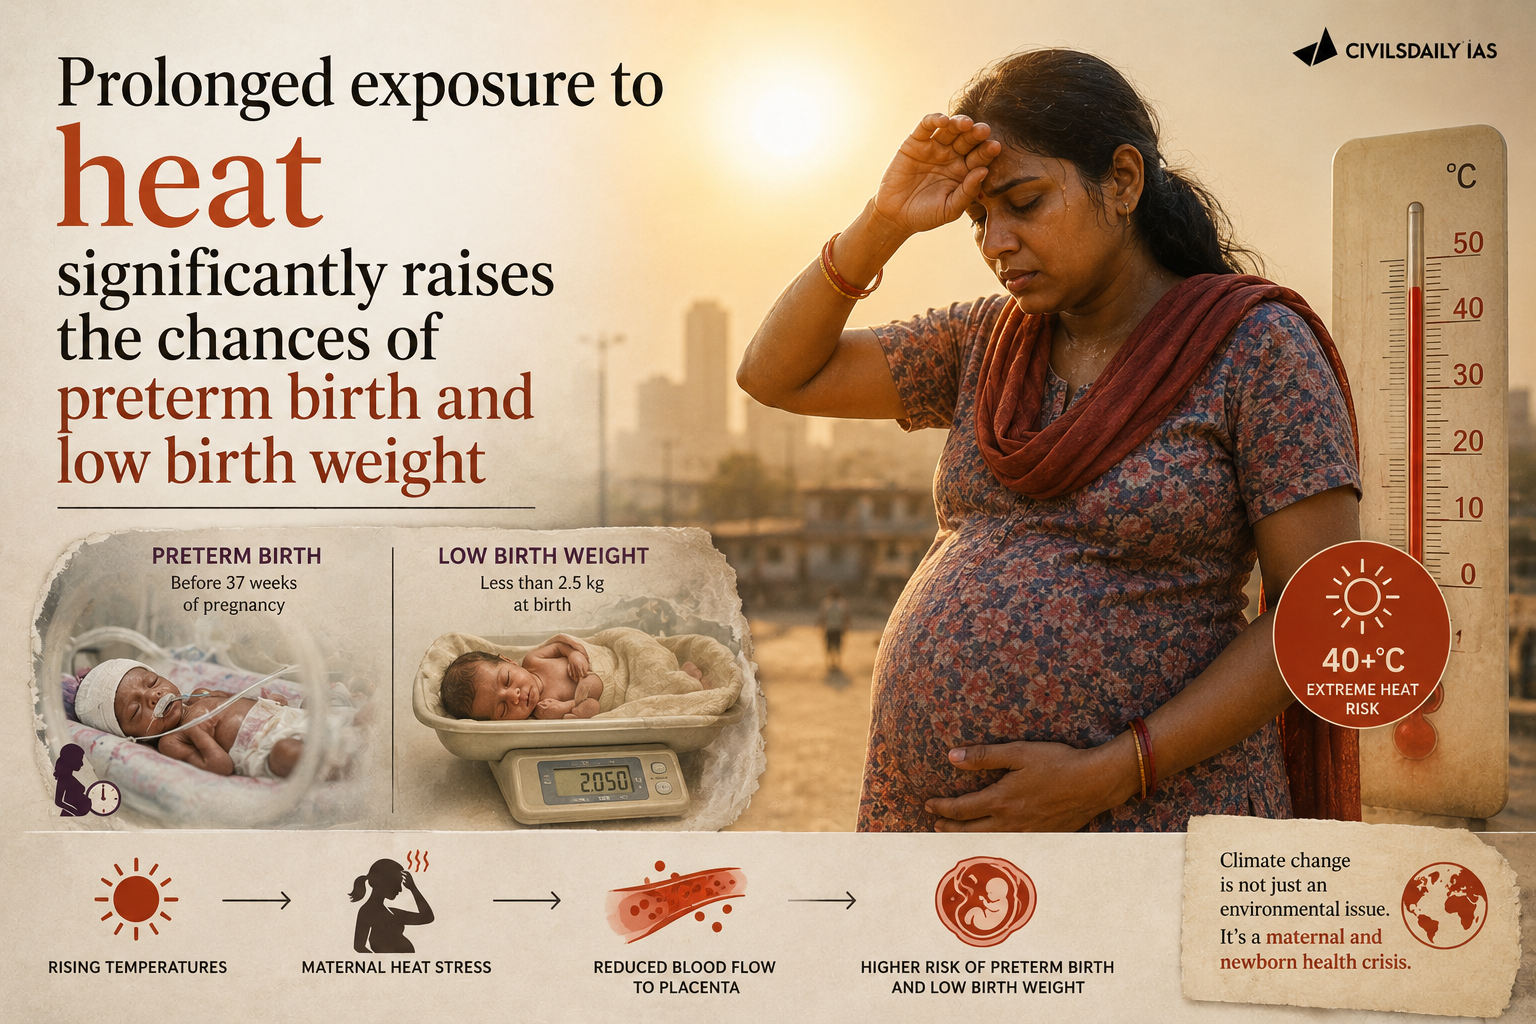
    Preterm births in India are rising, and Delhi alone has recorded a 21 per cent increase over the past five years. A study by the Indian Institute of Technology Delhi with international universities analysed National Family Health Survey data for 2015 to 2020. It established that prolonged exposure to heat significantly raises the chances of preterm birth and low birth weight. Motherhood in India continues to be narrated through the language of labour pain, sacrifice and endurance. That language describes a full-term vaginal delivery and nothing else. Causation is moving towards environmental exposure no individual can control. Responsibility is still located in the mother’s body.

    What is preterm birth?

    1. A birth before 37 completed weeks: Preterm birth is delivery before 37 completed weeks of gestation, counted from the first day of the last menstrual period.
    2. Three severity bands: The World Health Organization classifies births before 28 weeks as extremely preterm, 28 to 32 weeks as very preterm, and 32 to 37 weeks as moderate to late preterm.
    3. Low birth weight is a separate marker: A newborn weighing under 2,500 g is classified as low birth weight, with or without prematurity. The risk compounds when both are present.
    4. India carries the largest absolute burden: India records the highest number of preterm births of any country, at roughly three million a year, which is close to a fifth of the global total.

    What is kangaroo mother care?

    1. Skin-to-skin contact as clinical treatment: Kangaroo mother care places the low birth weight infant upright against the parent’s bare chest for prolonged periods, combined with exclusive breastfeeding, to stabilise temperature, heart rate and breathing.
    2. It is recommended from birth: The World Health Organization advises immediate and continuous kangaroo mother care for infants born under 2,000 g rather than delaying it until the infant is clinically stable.

    What does care inside a neonatal intensive care unit actually involve?

    1. Time is measured by instruments, not routines: Days inside a neonatal intensive care unit (NICU) are structured around oxygen saturation levels, heart-rate monitors and machine alarms rather than feeding schedules or sleepless nights.
    2. The first contact is mediated by equipment: Early memories of motherhood are of incubators and wires rather than of cradling a child, with infants weighing a few hundred grams held for kangaroo mother care.
    3. The mother is a patient at the same time: A caesarean delivery leaves the mother recovering from major abdominal surgery. The infant is treated several corridors away, so hours of sitting are managed through incision pain.
    4. Stays run into weeks, not days: A NICU admission after a very preterm delivery commonly runs six weeks or longer, which is a period of hospital residence rather than a hospital visit.
    5. Solidarity forms sideways, not from clinicians: Support comes from nurses, guards, hospital staff and other mothers in the same unit, who mark small milestones together and register each other’s setbacks.

    Why do preterm births keep rising in India?

    1. Maternal nutrition: The nutritional health of mothers is a direct contributor, with anaemia and low pre-pregnancy weight raising the risk of early delivery.
    2. The changing pattern of pregnancies: Later first pregnancies, higher rates of assisted conception and more multiple births all shift the distribution towards earlier deliveries.
    3. Environmental factors: A significant part of the rise is attributable to environmental exposure rather than to maternal or clinical factors.

    What does the parallel rise in caesarean sections indicate?

    1. Caesarean rates have moved well past the clinical reference range: The National Family Health Survey records 21.5 per cent of deliveries as caesarean nationally, against the 10 to 15 per cent range the World Health Organization treats as the point beyond which population level benefits stop.
    2. The private sector drives the gap: Caesarean deliveries account for 47.4 per cent of births in private facilities against 14.3 per cent in public facilities. The gap points to provider incentives rather than to clinical need.
    3. An emergency caesarean is a different event from an elective one: A preterm emergency caesarean is a rescue procedure for foetal or maternal distress, and it arrives without the preparation an elective procedure allows.
    4. Timing carries its own risk: Caesarean delivery before 39 completed weeks raises neonatal respiratory morbidity, so a rising caesarean rate and a rising preterm rate reinforce each other.

    Who is held responsible when a birth goes wrong?

    1. The dominant script has no place for a preterm birth: An initiation into motherhood that begins at the doors of a neonatal unit has no available story, so the experience goes unnarrated rather than merely unrecognised.
    2. Scrutiny falls on the mother’s conduct: Society places the burden of a healthy pregnancy almost entirely on women, and a premature birth intensifies that scrutiny into questions about whether she travelled or rested enough. The mother’s body becomes the site of investigation.
    3. The evidence points the other way: Environmental exposure and clinical practice are population level determinants, and neither is amenable to individual maternal conduct.
    4. The psychological cost has no recognised name: Conversation around postpartum depression has grown, and the emotional realities of neonatal intensive care motherhood remain largely invisible.
    5. Even the support offered polices the mother: Nurses urge mothers to stay positive because infants sense their emotions. That instruction converts grief into a further maternal responsibility.

    Challenges in maternal and newborn care in India

    1. Neonatal intensive care capacity is thin outside metros: District level special newborn care units handle stabilisation but not ventilation or surgery, so very preterm infants must be transferred to a medical college or a private hospital. Eg. Referral transport for sick newborns remains the weakest link in the newborn care chain in most States. Fix. Attach a functioning level three unit to every district hospital with a dedicated newborn transport ambulance on a fixed response standard.
    2. Neonatal intensive care is catastrophic out-of-pocket expenditure: A six-week private NICU stay runs into several lakh rupees and sits outside most insurance cover for a newborn without an existing policy. Eg. Ayushman Bharat covers the mother’s delivery package but not an extended neonatal admission in every State’s package list. Fix. Add a defined neonatal intensive care package with a per-day rate to the national health insurance benefit list, effective from the date of birth.
    3. Perinatal mental health has no service line: Public maternity facilities have no counsellor attached to the neonatal unit, so the psychological consequences of a preterm birth go unscreened and untreated. Eg. Screening for postpartum depression is not part of the standard postnatal visit schedule. Fix. Post a trained counsellor at every special newborn care unit and add a validated screening question to the routine postnatal check.
    4. Caesarean rates are unaudited in the private sector: No facility level audit compels a hospital to justify its caesarean rate, so the rate rises without a clinical explanation. Eg. Facility caesarean rates above 50 per cent are recorded in several States without triggering review. Fix. Publish facility-wise caesarean rates using the Robson classification and make registration renewal conditional on a rate review.
    5. Heat action plans do not name pregnant women: City heat plans list outdoor workers and the elderly as vulnerable groups and generally omit pregnant women, so no advisory or workplace protection reaches them. Eg. Most State heat action plans carry no antenatal advisory component. Fix. Add pregnant women as a notified vulnerable category, with heat advisories issued through antenatal care contacts and Anganwadi workers.
    6. Kangaroo mother care coverage stays low: The intervention is cheap and evidence-backed, and it requires a mother to remain beside the infant for hours. Most public units are not physically designed for that. Eg. Many newborn units have no space for a mother to stay overnight. Fix. Make mother-side accommodation a licensing condition for any unit designated to handle low birth weight newborns.

    Conclusion

    Preterm birth in India is being pushed upward by heat exposure and other environmental determinants that no individual pregnancy can be managed against, and the clinical system is simultaneously delivering more babies surgically and earlier. The response has stayed at the level of the individual mother, whose conduct is scrutinised and whose psychological care is not provided at all. Recognising heat as a maternal health exposure, auditing caesarean practice and funding neonatal intensive care are the three interventions the evidence already supports. Until they are in place, the burden of a structural change will keep being carried privately.

    “[2025] Consider the following statements:

    Statement I: At the 28th United Nations Climate Change Conference (COP28), India refrained from signing the ‘Declaration on Climate and Health’.

    Statement II: The COP 28 Declaration on Climate and Health is a binding declaration; and if signed, it becomes mandatory to decarbonize health sector.

    Statement III: If India’s health sector is decarbonized, the resilience of its healthcare system may be compromised.

    Which one of the following is correct in respect of the above statements?

    (a) Both Statement II and Statement III are correct and both of them explain Statement I

    (b) Both Statement II and Statement III are correct but only one of the them explains Statement I

    (c) Only one of the Statements II and III is correct and that explains Statement I

    (d) Neither Statement II nor Statement III is correct

  • Climate resilience starts with the health workforce

    Why in the News

    Floods in Kerala and Assam have exposed the challenge of protecting lives during climate-related disasters, with attention going to rescue, relief camps and rebuilding. Analysis of climate-health governance across South and Southeast Asia shows that the workforce which prevents a disaster from becoming a prolonged public-health crisis is trained through fragmented, donor-supported projects rather than through the health system's own institutions.

    What is a climate-resilient health system?

    1. About: A climate-resilient health system is one able to anticipate, respond to, cope with and recover from climate-related shocks without interrupting routine health services.
    2. What it rests on: Its resilience ultimately depends on the workforce that delivers adaptation, since surveillance, emergency response and community outreach are performed by people rather than by plans.
    3. What changes under climate stress: Many of the foundational competencies required for climate adaptation already exist within health systems, and what changes is the context in which they must operate.
    4. The design principle: Climate change requires reorienting existing competencies through a climate lens and introducing new competencies where needed, rather than replacing what already exists.

    What is a heat action plan?

    1. About: A heat action plan is a city or region specific preparedness protocol that sets temperature thresholds, colour-coded warnings, and assigned responsibilities for health facilities, municipal bodies and emergency services during a heatwave.
    2. Why it is health-led: It converts a meteorological forecast into concrete health system action, covering hospital surge beds, oral rehydration supply, cooling spaces and outreach to outdoor workers and the elderly.

    What does the health workforce actually do during a climate disaster?

    1. Hospital preparedness: Hospitals prepare for medical emergencies, which is the visible clinical face of the response.
    2. Disease surveillance: Surveillance teams monitor disease outbreaks, since displacement and standing water raise the risk of communicable disease after a flood.
    3. Water quality testing: Laboratories test water quality, which determines whether relief camps and returning households face contamination risk.
    4. Community outreach: Community health workers reach vulnerable households, carrying care to those who cannot reach a facility.
    5. Cross-department coordination: Public health officials coordinate responses across departments, since the response involves disaster management, water supply, municipal services and health together.
    6. The net effect: It is the health workforce that prevents a natural disaster from becoming a prolonged public-health crisis, which is the least visible part of the response.

    What have states already put in place?

    1. Surveillance: States have begun to strengthen surveillance systems, which is the first line of detection for post-disaster outbreaks.
    2. Heat action plans: States have developed region-specific and city-specific heat action plans.
    3. Emergency preparedness: States have improved emergency preparedness arrangements within the health system.
    4. Programme integration: States have begun integrating climate considerations into several public-health programmes rather than treating climate as a separate vertical.
    5. The illustrative case: Kerala's response to the floods illustrates how health departments are increasingly incorporating public-health measures into disaster response.

    What does the South and Southeast Asia evidence show?

    1. The regional scope: The analysis covers climate-health governance across South and Southeast Asia, so the finding is regional rather than confined to one country.
    2. The central finding: Workforce development across the region remains fragmented, with no common architecture linking training to the health system's own institutions.
    3. The funding pattern: Climate-health training is largely confined to donor-supported or project-supported initiatives.
    4. What that implies: Capability rises and falls with the funding cycle of individual projects rather than accumulating within the system.
    5. Why the region matters for India: India's own state-level heat action plans and surveillance strengthening sit inside this regional pattern, so the fragmentation finding applies directly to Indian districts.

    Why does workforce capacity remain a surge response rather than a standing capability?

    1. The three questions the record raises: Whether these capacities can be sustained across all states, districts and levels of the health system; how surge capacities can be developed given the severe shortage of health workers across India; and whether capacities are being embedded across the workforce or continue to depend on individual relief-specific programmes and emergency mobilisation.
    2. The competency position: The competencies needed are largely present already, so the deficit is not one of knowledge.
    3. The institutional position: Those competencies sit in isolated training programmes rather than in the systems that produce, supervise and evaluate health workers.
    4. The consequence: Capacity is activated only during emergencies rather than translated into routine practice.
    5. The shortage constraint: The severe shortage of health workers across India limits how much surge capacity can be raised from an already stretched base.

    What would institutionalising climate-health competencies require?

    1. Beyond isolated training: Building climate-resilient health systems requires moving beyond isolated training programmes towards institutionalising climate-health competencies.
    2. The five integration points: These competencies should be integrated into pre-service education, professional development, supportive supervision, planning, and performance management.
    3. Pre-service education first: Placing climate-health content in pre-service education means every entrant carries the competency, rather than only those a project reaches.
    4. Supervision and performance: Embedding competencies in supportive supervision and performance management is what converts a completed training into observed practice.
    5. The three enablers: The integration must be supported by sustained governance, financing and institutional mechanisms.

    Challenges to Building a Climate-Resilient Health Workforce

    1. Absolute workforce shortage: Surge capacity cannot be drawn from a base that is already below norm, since redeploying staff for a flood response leaves routine services uncovered. Eg. Rural health facilities across India carry large shortfalls of specialists against Indian Public Health Standards, and community health centres report specialist vacancies in the range of two-thirds of sanctioned posts.
    2. Donor-cycle training: Competencies built through project funding disappear when the project closes, so the same district is trained repeatedly. Eg. Climate-health training across South and Southeast Asia remains largely confined to donor-supported or project-supported initiatives.
    3. Absence from pre-service curricula: Medical, nursing and allied health curricula do not carry climate-health competencies, so every entrant needs retrofitting. Eg. Heat illness protocols and post-flood outbreak management reach practitioners through workshops rather than through undergraduate training.
    4. Frontline worker load: Community health workers already carry multiple programme responsibilities, so a climate role is added without relief elsewhere. Eg. Accredited Social Health Activists deliver maternal health, immunisation, non-communicable disease screening and survey duties on an incentive-based payment structure.
    5. Data and early warning gaps: Health surveillance and meteorological forecasting run on separate systems, so an alert does not automatically reach a health facility. Eg. Heat action plans depend on India Meteorological Department warnings reaching district health officers in time for hospital preparation.
    6. Financing for adaptation: Adaptation finance for health competes with mitigation and infrastructure, so recurring workforce costs go unfunded. Eg. Global adaptation finance fell from 28 billion dollars to 26 billion dollars between 2022 and 2023, against a commitment to double it to 40 billion dollars by 2025.
    7. Attrition and contractual staffing: Much of the trained emergency workforce is on contract, so trained staff leave and the competency leaves with them. Eg. National Health Mission staff are engaged on contract across most States, with recurring demands for regularisation.

    Conclusion

    The health workforce is what prevents a climate disaster from becoming a prolonged public-health crisis, and its competencies are already largely present within health systems. The deficit is institutional, since climate-health training across South and Southeast Asia sits in donor-funded and project-funded initiatives rather than in pre-service education, professional development, supportive supervision, planning and performance management. Embedding those five points, supported by sustained governance, financing and institutional mechanisms, is what converts emergency mobilisation into routine practice. Until that happens, every flood and heatwave will draw on a surge capacity that has to be assembled afresh.

    Climate Change and Health in India

    1. The exposure: India faces heatwaves, floods, cyclones, droughts and air pollution simultaneously, so climate acts on health through multiple pathways rather than one.
    2. Heat: Rising heat exposure raises heat stroke, cardiovascular and renal illness, and reduces outdoor labour productivity, with outdoor workers, the elderly and pregnant women most exposed.
    3. Vector-borne disease: Warming and altered rainfall shift the range and season of malaria, dengue, chikungunya and Japanese encephalitis, moving transmission into districts and altitudes previously unaffected.
    4. Water-borne disease: Floods and cyclones contaminate drinking water and trigger diarrhoeal disease, cholera and leptospirosis outbreaks in the weeks after the event.
    5. Air quality: Ambient and household air pollution contribute to a very large share of India's non-communicable disease burden, with respiratory and cardiac mortality concentrated in the Indo-Gangetic Plain during winter.
    6. Nutrition: Crop yield loss and price shocks from extreme weather transmit into dietary quality, which shows up as child undernutrition rather than as a disaster statistic.
    7. The institutional response: The National Programme on Climate Change and Human Health, launched in 2019 under the National Health Mission, is the nodal programme, with State and district climate-health cells and nodal officers.
    8. The global frame: The Global Goal on Adaptation under the Paris Agreement now carries the 59 Belem Adaptation Indicators, the first global indicators for adaptation, spanning water, food, health, ecosystems, infrastructure and livelihoods.

    Government Initiatives

    1. National Action Plan on Climate Change: The 2008 framework of national missions, whose State Action Plans on Climate Change carry the health adaptation components at State level.
    2. National Action Plan for Heat Related Illnesses: Issued by the health ministry, it prescribes surveillance of heat-related illness and death, hospital preparedness, and health advisories during the heat season.
    3. National Disaster Management Authority heat guidelines: Guidelines for preparation of heat action plans, first issued in 2016 and revised subsequently, which States and cities use to build local plans.
    4. Ayushman Arogya Mandirs: Health and wellness centres delivering comprehensive primary health care, which are the delivery point for climate-sensitive surveillance and outreach at the community level.
    5. Integrated Disease Surveillance Programme and Integrated Health Information Platform: The national outbreak detection system, which is the mechanism through which post-flood and post-cyclone outbreaks are identified.
    6. Mission LiFE: A behavioural initiative on sustainable consumption, positioned as the demand-side counterpart to institutional climate action.

    Key Facts about Climate and Health Governance

    1. World Health Day: Observed on 7 April, marking the founding of the World Health Organization in 1948.
    2. National Doctors' Day: Observed on 1 July in India.
    3. Declaration on Climate and Health: COP28 at Dubai in 2023 was the first Conference of the Parties to formally address the health impacts of climate change, with a Declaration on Climate and Health endorsed by more than 140 nations, calling for climate-resilient health systems, extreme heat protocols and health co-benefits of mitigation. India did not sign it.
    4. Health Day at COP: COP28 also hosted the first dedicated Health Day on the official Conference of the Parties agenda, convened by the Presidency and the World Health Organization.
    5. Belem Adaptation Indicators: The 59 Belem Adaptation Indicators adopted at COP30 are the first global indicators for the Global Goal on Adaptation, and health is one of the domains they cover.
    6. Baku Adaptation Road Map: A two-year structured agenda running from 2026 to 2028 under the global goal on adaptation work programme, guiding progress on the Belem indicators and adaptation finance tracking.
    7. Adaptation finance goal: COP30 signalled a tripling of adaptation funding to 120 billion dollars a year by 2035 within the wider 1.3 trillion dollar pact, as a political signal rather than a binding commitment.

    Challenges in Climate and Health Governance

    1. Split institutional mandates: Climate policy sits with the environment ministry, disaster response with disaster management authorities and delivery with health departments, so no single authority owns climate-health outcomes. Eg. Heat action plans are issued under disaster management guidelines, and heat illness surveillance runs through the health ministry.
    2. Plans without financing: State and city plans are prepared without a dedicated budget line, so implementation depends on reallocating funds from other heads. Eg. Reviews of Indian heat action plans have found most lack identified funding sources and legal backing.
    3. Weak local vulnerability data: Plans use uniform thresholds rather than locally derived ones, so warnings misfire in humid or high-altitude districts. Eg. Heat thresholds calibrated for dry inland cities do not capture the combined temperature and humidity stress in coastal districts.
    4. Under-recording of climate-attributable deaths: Heat and flood-related mortality is recorded under proximate clinical causes, which understates the burden used to justify funding. Eg. Heat stroke deaths are frequently certified as cardiac or renal failure without the heat exposure being recorded.
    5. Primary care infrastructure gaps: Facilities lack cooling, uninterrupted power and water security, which are prerequisites for functioning during a heatwave or a flood. Eg. Many primary health centres operate without assured power backup for cold chain and emergency care.
    6. Fragmented surveillance integration: Meteorological, water quality and disease surveillance systems do not exchange data automatically, so early warning does not translate into facility-level preparation. Eg. Outbreak detection after floods relies on manual reporting through the Integrated Disease Surveillance Programme.
    7. International finance shortfall: Adaptation finance for the health sector remains a small fraction of climate finance, which pushes workforce costs back onto domestic budgets. Eg. Adaptation finance globally fell from 28 billion dollars to 26 billion dollars between 2022 and 2023.

    Way Forward

    1. Put climate-health in pre-service curricula: Introduce climate-health competencies into medical, nursing, allied health and public health curricula, so every new entrant carries them without retrofitting.
    2. Embed competencies in supervision and appraisal: Add climate-health tasks to supportive supervision checklists and to the annual performance appraisal of district health officers and facility staff.
    3. Fund workforce costs from domestic budgets: Provide a recurring National Health Mission budget line for climate-health cells, district nodal officers and refresher training, so capability does not lapse with donor projects.
    4. Localise heat and flood thresholds: Derive district-specific temperature, humidity and rainfall thresholds from local mortality and morbidity data, rather than applying uniform national cut-offs.
    5. Integrate the data systems: Link India Meteorological Department warnings, water quality testing and the Integrated Disease Surveillance Programme, so an alert automatically triggers facility-level preparation.
    6. Improve cause-of-death recording: Add climate exposure fields to death certification for heat, flood and cyclone events, so the burden is measured and can be budgeted against.
    7. Climate-proof health facilities: Provide assured power backup, cooling, water security and structural resilience at primary health centres and community health centres in high-exposure districts.
    8. Regularise the emergency workforce: Convert contract emergency and surveillance staff into regular cadres, so trained capacity remains in the system rather than leaving with the contract.

    Matching Previous Year Question

    “[2024, GS2, 15] In a crucial domain like the public healthcare system, the Indian State should play a vital role to contain the adverse impact of marketisation of the system. Suggest some measures through which the State can enhance the reach of public healthcare at the grassroots level.”
  • [3rd August 2026] The Hindu OpED: Strong health systems for all with better public spending 

    PYQ Relevance
    [UPSC 2024] In a crucial domain like the public healthcare system, the Indian State should play a vital role to contain the adverse impact of marketisation of the system. Suggest some measures through which the State can enhance the reach of public healthcare at the grassroots level.
    Linkage: The PYQ focuses on strengthening public healthcare through better financing and governance. The article shows how efficient spending, preventive care, and stronger governance can improve grassroots healthcare despite limited funds.

    Mentor’s Comment

    As donor countries reduce health aid and developing countries face rising debt repayments, increasing health funding for low- and middle-income countries (LMICs) is not a realistic option in the near future. The focus has therefore shifted to using existing health budgets more effectively through full utilisation of funds, greater investment in preventive and public health, and better governance. However, while improving efficiency is essential, it cannot fully overcome the basic problem of inadequate per-person health spending.

    Why does the LMIC health financing gap appear to be narrowing but is actually widening?

    1. GDP-share convergence: The health expenditure gap between LMICs and high-income countries as a share of GDP narrowed from 2.05 percentage points in 2000 to 1.68 percentage points in 2023.
    2. Per capita divergence: In per capita terms, the same gap has expanded more than three-fold over the same period.
    3. Absolute shortfall: Per capita public spending on universal health coverage in LMICs, including government expenditure and off-budget aid, is about half the minimum benchmark identified by the World Bank.
    4. Misleading metric: A GDP-share comparison understates the real resource gap. LMIC economies and populations are growing, so per capita spending is the more accurate measure of unmet need.

    Why can LMICs no longer count on external aid or fiscal headroom to close this gap?

    1. DAH peak and reversal: Development assistance for health (DAH) peaked in 2021 during the COVID-19 pandemic and has declined sharply since.
    2. US cuts: The United States, historically the source of over a third of global DAH, announced a 67% cut to foreign assistance in early 2025.
    3. Allied cuts: The United Kingdom, France, and Germany followed with cuts of 39%, 35%, and 12% respectively.
    4. Projected decline: The OECD projects health funding could fall by up to 60% from its 2022 peak.
    5. Debt burden: Global public debt reached $102 trillion in 2024. Developing countries owed $31 trillion of this, growing twice as fast as advanced-country debt since 2010.
    6. Crowding out: Developing countries paid a record $921 billion in net interest payments in 2024, leaving less fiscal space for health.

    Why does allocated health money not reach the ground in LMICs?

    1. Execution rates: LMIC health budgets are executed at 85-90%, lower than execution rates for the general budget and for education.
    2. Deprioritisation at implementation: Underspending against allocation amounts to a deprioritisation of health at the implementation stage, even when the budget itself was adequate on paper.
    3. India infrastructure mission: A parliamentary panel found only about two-thirds of the allocation for the flagship health infrastructure mission was spent in 2024-25.
    4. India disease programmes: Within the National Health Mission, only 26% of the money earmarked for communicable and non-communicable disease programmes was used that year.
    5. Category-wise variation: Wage and salary budgets are implemented in full. Spending on goods and services is underutilised. Health workers are left without adequate supplies and equipment.

    Why does the composition of health spending matter as much as its volume?

    1. Curative bias: A large share of public health spending goes to curative care at the secondary and tertiary levels rather than preventive, primary care.
    2. India preventive share: India spends less than one-fourth of public health money on preventive care, per London School of Hygiene & Tropical Medicine estimates.
    3. Public goods logic: Public health money delivers the highest impact when spent on classic public goods such as infectious disease control or sanitation, where market failure prevents private provision.
    4. Evidence on outcomes: Public health spending markedly improves infectious disease outcomes through access, vaccination, and sanitation. It does far less for maternal, child, and non-communicable disease outcomes.
    5. Emerging pressure: Ageing populations will increase the need for spending on chronic disease risk factors, early detection, and management.

    How does governance quality determine whether health spending converts into health outcomes?

    1. Governance-spending interaction: Countries with lower corruption and stronger bureaucratic quality see greater positive effects of public health spending on outcomes such as child mortality.
    2. Converse risk: Increasing spending where governance is weak does not reliably improve outcomes.
    3. Decentralisation challenge: Growing decentralisation of service delivery makes subnational governance quality increasingly central to health outcomes.
    4. PFM components: Budget credibility, timely cash disbursement, and flexible budgets that can respond to unforeseen circumstances such as pandemics are central to good public finance management.
    5. Provider involvement: Involving public health providers in budget processes improves both their accountability and motivation.
    6. Procurement: Improving procurement processes helps achieve greater value for money in health-sector resources.

    Does spending health money better substitute for spending more, or does it merely defer the underlying financing question?

    1. Efficiency as necessity, not choice: With external aid contracting and fiscal space shrinking, efficiency reforms are being pushed as the primary lever, not because they are sufficient but because more money is currently unavailable.
    2. Limits of efficiency: Even full execution and optimal prioritisation cannot close a financing gap that stems from an absolute shortfall in per capita resources relative to benchmarks.
    3. Equity argument: Returns to health spending are greatest exactly where outcomes are poorest. Underfunded LMICs stand to lose the most from a financing pullback that efficiency measures alone cannot offset.
    4. Unresolved question: The article does not specify how the residual financing gap, after full execution and reprioritisation, will eventually be closed.

    Conclusion

    The contraction of development assistance for health and the fiscal squeeze from rising public debt have made the additional-financing pathway to closing LMIC health gaps unreliable. The immediate policy response must be to spend existing health budgets more fully, reprioritise toward preventive and public-goods spending, and strengthen governance and public finance management. These measures improve outcomes per rupee spent but do not eliminate the underlying financing shortfall. Since returns to health spending are highest where outcomes are worst, the case for restoring adequate financing remains unresolved.

  • Why is the centre revising the NFSA 

    Why in the News?

    The Union Food and Public Distribution Department has published a draft amendment to the National Food Security Act (NFSA), 2013 converting the Antyodaya Anna Yojana (AAY) entitlement from a household-based to a per-capita formula. Tamil Nadu and Kerala have objected, arguing the change will cut monthly foodgrain allocations for smaller households even though it is framed as an equity correction. The dispute revives a food-politics fault line between the Centre and these two States that traces back to the NFSA’s 2013 enactment.

    What has the Centre proposed, and what does it claim to fix?

    1. Current rule: Every Antyodaya Anna Yojana (AAY) household receives 35 kg of foodgrains per month, regardless of household size.
    2. Proposed rule: Each person in an AAY household is entitled to 7 kg per month, subject to a ceiling of 35 kg per household.
    3. Legal provision amended: The first provision to Section 3(1) of the NFSA, which governs the right to subsidised foodgrains for eligible households.
    4. Stated rationale: The F&PD Department says the household-based system causes intra-category inequity. Smaller households get a higher per-capita share. Larger households get a lower per-capita share that can fall below what priority households receive.
    5. Stated objective: The amendment aims to make allocation more rational and align entitlements with nutritional norms.
    6. Consultation window: Public comments were invited till July 13, 2026.
    7. Gap in the amendment: The draft does not address inclusion of ineligible persons as beneficiaries. This problem remains a State-level issue.

    Why have Tamil Nadu and Kerala historically treated food policy as high-stakes politics?

    1. Kerala’s PDS legacy: Kerala traces informal food distribution mechanisms to the erstwhile princely State of Travancore and launched a formal Public Distribution System (PDS) in 1962, three years before the Food Corporation of India (FCI) was established.
    2. Tamil Nadu’s political precedent: Incumbent governments lost power in 1952 and 1967 over failure to manage rice shortages, making rice policy a lasting political sensitivity.
    3. Kerala’s resistance to the 2013 NFSA: The Congress-led UDF government, despite the Congress-led UPA pushing the law at the Centre, resisted implementation. It argued the law would drop a large number of poor families and impose a heavy financial burden on the State.
    4. Delayed Kerala rollout: Chief Minister Oommen Chandy committed to enforcing the NFSA, but the formal decision was taken only under his successor, Pinarayi Vijayan.
    5. Tamil Nadu’s universal rice policy: Chief Minister Jayalalithaa opposed the NFSA after her government began distributing free rice to all ration cardholders in 2011, regardless of economic status.
    6. Concession extracted in 2013: Tamil Nadu secured a Central guarantee that its then-existing allocation levels would be legally protected under the NFSA.
    7. Delayed adoption: Both southern States joined the rest of the country in implementing the NFSA only in November 2016.

    Why does a per-capita formula built on a household ceiling disadvantage southern States?

    1. Mechanical effect of the formula: A household with fewer than five members receives less than 35 kg under the per-capita rule, since 7 kg multiplied by fewer than five persons falls short of the existing ceiling.
    2. Kerala’s structural exposure: Kerala’s Food Minister has argued that States characterised by nuclear families will lose out, since Kerala took the position in 2013 that AAY cardholders deserved “special consideration,” a stance it maintains.
    3. Tamil Nadu’s quantified loss: The State’s monthly allocation is projected to fall from 65,261 tonnes to 42,040 tonnes under the new formula.
    4. Scale of exposure in Tamil Nadu: Of 18.64 lakh AAY households, 15.75 lakh have fewer than five members, covering 58.51 lakh of the State’s 69.27 lakh AAY beneficiaries.
    5. Non-substitutability argument: Rice is a staple across all three daily meals for AAY cardholders and cannot be replaced with market purchases without significant out-of-pocket cost.
    6. North-South divide argument: Right to Food Campaign functionary Anuradha Talwar has argued that northern States, with larger average family sizes, will receive higher allocations under the new formula while southern States lose out.
    7. South’s collective stake: The five southern States and Puducherry together hold 52.51 lakh of India’s 250 lakh AAY household ceiling, about one-fifth of the national total, making the region’s exposure to the formula change substantial in absolute terms.

    What is the way forward, and does it resolve the underlying tension?

    1. Process concern: A change of this scale should have been subjected to wider public scrutiny before a consensus was sought, according to food policy commentary cited in the report.
    2. Middle-path proposal: Tamil Nadu Progressive Consumer Centre president T. Sadagopan has suggested a flat allocation of 30 kg per household, irrespective of family size, as a compromise.
    3. Fiscal rationale for the middle path: A flat 30 kg allocation would still let the Union government reduce its overall subsidy bill compared to the current 35 kg ceiling.
    4. Implementation context: Current off-take and distribution data for the financial year up to May 2026 show uneven utilisation across southern States relative to their allocations, indicating that formula design alone will not resolve execution gaps in the PDS chain.
    5. Unresolved gap: Neither the Centre’s draft nor the proposed middle path addresses the separate, State-level problem of ineligible persons remaining on beneficiary lists.

    Conclusion

    The NFSA amendment corrects a genuine per-capita inequity within the AAY category, but the household ceiling built into the new formula shifts the burden onto smaller-household southern States, reviving a federal food-politics conflict rooted in each State’s distinct PDS history. The amendment leaves the parallel problem of ineligible beneficiaries at the State level untouched, meaning one inequity is corrected while another persists. A flat per-household allocation remains a proposed middle path, but the Centre has not formally responded to it.

    PYQ Relevance

    [UPSC 2013] What are the salient features of the National Food Security Act, 2013? How has the Food Security Bill helped in eliminating hunger and malnutrition in India?

    Linkage: The PYQ examines the provisions and effectiveness of the NFSA as a rights-based framework for ensuring food and nutritional security. The proposed shift from a fixed 35 kg entitlement per AAY household to 7 kg per person, capped at 35 kg, enables a critical assessment of whether rationalising foodgrain allocation may weaken existing NFSA entitlements and affect vulnerable households unevenly.

  • Poshan Tracker

    Why in News?

    The Ministry of Women and Child Development (MoWCD) highlighted the achievements of the Poshan Tracker, India’s real time nutrition monitoring platform under Mission Poshan 2.0.

    What is Poshan Tracker?

    • Mobile based application launched in March 2021.
    • Developed by MoWCD with the National e-Governance Division (NeGD).
    • Digital backbone of POSHAN Abhiyaan.
    • Enables real time monitoring of nutrition, beneficiaries, and Anganwadi services.

    About POSHAN Abhiyaan

    • Launched on 8 March 2018.
    • India’s flagship National Nutrition Mission.
    • In 2021, merged with Anganwadi Services and Scheme for Adolescent Girls under Mission Saksham Anganwadi and Poshan 2.0.

    Key Features

    • Aadhaar based beneficiary authentication.
    • Facial Recognition System (FRS) for service verification.
    • Digital home visit scheduler.
    • Poshan Calculator based on WHO Child Growth Standards.
    • Tracks stunting, wasting, underweight, SAM, MAM, and obesity.
    • Provides ECCE learning content and Poshan Helpline (1515).

    Achievements (May 2026)

    • Covers 28 States and 8 UTs.
    • 8.93 crore beneficiaries registered.
    • 7.7 crore children tracked through Aadhaar authenticated database.
    • 6.3 crore children (0 to 5 years) monitored for growth (about 94% coverage).
    • 5.5 crore beneficiaries received Supplementary Nutrition for at least 15 days.

    Significance

    • Enables evidence based nutrition governance.
    • Reduces leakages and duplicate beneficiaries.
    • Strengthens Anganwadi service delivery.
    • Supports Digital India and Viksit Bharat.

    Prelims Facts

    • POSHAN Abhiyaan: 2018.
    • Poshan Tracker: March 2021.
    • Nodal Ministry: Ministry of Women and Child Development.
    • Uses WHO Child Growth Standards.
    • Operates under Mission Saksham Anganwadi and Poshan 2.0.

    [2023] Consider the following statements in the context of interventions being undertaken under Anaemia Mukt Bharat Strategy:
    1. It provides prophylactic calcium supplementation for pre-school children, adolescents and pregnant women.
    2. It runs a campaign for delayed cord clamping at the time of child- birth.
    3. It provides for periodic deworming to children and adolescents.
    4. It addresses non-nutritional causes of anaemia in endemic pockets with special focus on malaria, hemoglobinopathies and fluorosis.
    How many of the statements given above are correct?

    [A] Only one

    [B] Only two

    [C] Only three

    [D] All four

  • Anaemia Mukt Bharat Abhiyaan (Revised Guidelines)

    Why in News?

    The Union Health Ministry has launched the revised operational guidelines for Anaemia Mukt Bharat (AMB), upgrading it to Anaemia Mukt Bharat Abhiyaan with a strengthened 7×7×7 framework, digital monitoring and expanded beneficiary coverage.

    What is Anaemia Mukt Bharat (AMB)?

    • Launched in 2018 under the National Health Mission (NHM).
    • Aims to reduce anaemia through a life-cycle approach.
    • Supports the POSHAN Abhiyaan and Anemia Reduction Strategy.

    Key Changes

    • 7×7×7 Strategy (Earlier 6×6×6): Added Low Birth Weight (LBW) babies (0 to 6 months) as the 7th beneficiary group.
    • New Intervention: Introduces “Eating Right” to promote: Iron-rich diets, Dietary diversity, and Nutrition counselling
    • Digital Monitoring: New institutional mechanism for digital tracking and programme monitoring.
    • T4 Strategy (Earlier T3): Test, Treat, Talk, and Track (new addition)
    • Better Clinical Management: Severe anaemia in pregnant/lactating women: Ferric Carboxymaltose and Iron Sucrose (IV therapy)
    • Integrated Digital Ecosystem:
      • JANANI Portal: Pregnant women
      • RBSK Portal: Children
      • U-WIN Portal: Child health records
      • Integrated into a unified AMB Abhiyaan Portal

    Causes of Anaemia

    • Iron deficiency, Folate deficiency, Vitamin B12 deficiency, Worm infestations, Infections, Inherited blood disorders, and Poor dietary diversity

    NFHS-5 Highlights

    • Children (6 to 59 months): 67.1%
    • Women (15 to 49 years): 57%
    • Pregnant women: 52.2%
    • Adolescent girls (15 to 19 years): 59.1%

    Significance

    • Early intervention for vulnerable infants.
    • Improved diagnosis and follow-up.
    • Promotes nutrition-sensitive interventions.
    • Strengthens digital health governance.
    • Supports reduction in maternal and child morbidity.

    [2023] Consider the following statements in the context of interventions being undertaken under Anaemia Mukt Bharat Strategy:
    1. It provides prophylactic calcium supplementation for pre-school children, adolescents and pregnant women.
    2. It runs a campaign for delayed cord clamping at the time of child- birth.
    3. It provides for periodic deworming to children and adolescents.
    4. It addresses non-nutritional causes of anaemia in endemic pockets with special focus on malaria, hemoglobinopathies and fluorosis.
    How many of the statements given above are correct?

    [A] Only one

    [B] Only two

    [C] Only three

    [D] All four

  • Appropriate local community-level healthcare intervention is a prerequisite to achieve ‘Health for All ‘ in India. Explain.

    The goal of ‘Health for All’, as envisioned in the Alma-Ata Declaration (1978) and reinforced through National Health Policy 2017, emphasizes universal, equitable, and accessible healthcare.

    Importance of Local Community-Level Healthcare Interventions

    Accessibility and Inclusivity – Brings primary healthcare closer to grassroot and reduces dependency on overburdened tertiary hospitals. Eg- Ayushman Bharat – Health and Wellness Centres (HWCs)

    Preventive and Promotive Health – Community health workers (e.g., ASHA, Anganwadi, ANM) enable early detection, immunization, maternal and child care.

    Local interventions are more trust-based, improving adoption of health services. Eg- ASHA workers act as a bridge between local communities and formal healthcare systems

    Cost-Effectiveness – Community-based preventive healthcare reduces out-of-pocket expenditure (OOPE). (Presently at 40%)

    Empowering Local Governance – Panchayati Raj Institutions (PRIs) and Village Health Sanitation and Nutrition Committees (VHSNCs) ensure decentralized planning and monitoring.

    Integration of Traditional and Modern Systems – Incorporates AYUSH practices alongside allopathy to widen reach and enhance preventive health.

    Empowering Women and Local Workforce – ASHAs and Anganwadi workers-over 10 lakh women-act as frontline caregivers.

    Community health networks enable rapid disease surveillance and emergency response. Eg- ASHAs and PRIs played a critical role in contact tracing during COVID-19

    Continuous community engagement increases awareness of disease prevention, hygiene, family planning, and nutrition.

    Key Challenges

    Shortage of trained manpower and high attrition among ASHA and ANM workers.

    Inadequate infrastructure at Sub-Centres and PHCs.

    Weak inter-sectoral convergence (between health, sanitation, and nutrition departments).

    Limited community participation due to lack of awareness and ownership.

    Way Forward

    Strengthen Primary Health Infrastructure: Upgrade all 1.5 lakh HWCs with telemedicine and diagnostics.

    Capacity Building: Continuous training and performance-based incentives for ASHA and ANM workers.

    Community Ownership: Empower Panchayats and SHGs in planning and monitoring local health outcomes.

    Technology Integration: Use eSanjeevani, digital health IDs, and mobile-based health tracking.

    Social Determinants Approach: Integrate health with nutrition, sanitation (Swachh Bharat), and clean energy (Ujjwala Yojana).

    Achieving Universal Health Coverage (UHC) by strengthening local healthcare will help realize the vision of “Swasth Bharat – Samriddh Bharat.”