Index
- What is the census?
- When was the first census in India held
- Why the census is important
- Key Findings of the Census of India 2011

What is the census?
Census is nothing but a process of collecting, compiling, analyzing, evaluating, publishing and disseminating statistical data regarding the population. It covers demographic, social and economic data and are provided as of a particular date.
When was the first census in India held?
Census operations started in India long back during the period of the Maurya dynasty. It was systematized during the years 1865 to 1872, though it has been conducted uninterruptedly from the year 1881 being a trustworthy resource of information.
Why is the census important?
1. The Indian Census is the most credible source of information on Demography (Population characteristics), Economic Activity, Literacy and Education, Housing & Household Amenities, Urbanisation, Fertility and Mortality, Scheduled Castes and Scheduled Tribes, Language, Religion, Migration, Disability and many other socio-cultural and demographic data since 1872. Census 2011 is the 15th National Census of the Country. This is the only source of primary data in the village , town and ward level, It provides valuable information for planning and formulation policies for Central and the State Governments and is widely used by National and International Agencies, scholars, business people, industrialists, and many more.
2. The delimitation/reservation of Constituencies – Parliamentary/Assembly/Panchayats and other Local Bodies is also done on the basis of the demographic data thrown up by the Census. Census is the basis for reviewing the country’s progress in the past decade, monitoring the ongoing Schemes of the Government and most importantly, plan for the future.
Key findings of Census of India 2011 (Summary for UPSC Notes)
Source
| Key Findings | Data & Statistics |
|---|---|
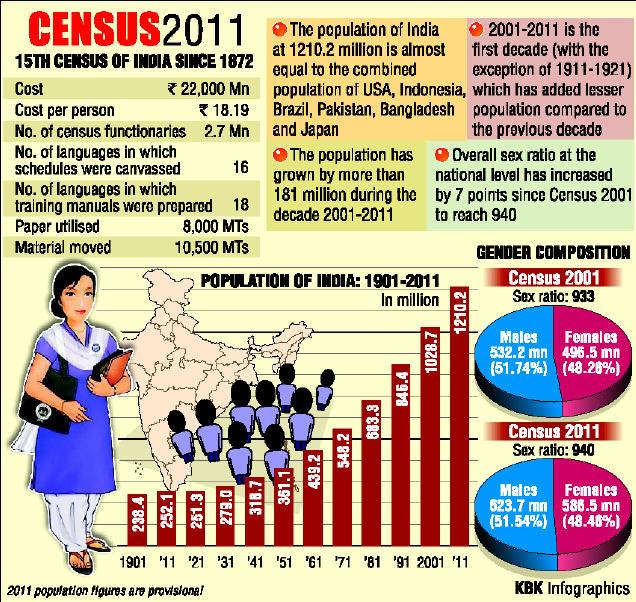
| Total Population (2011) | 1.21 billion (an increase of 17.7% from the previous decade). |
| Male-Female Population Growth | Males: Increased by 90.97 million. Females: Increased by 90.99 million. Growth rate: Females (18.3%) higher than Males (17.1%). |
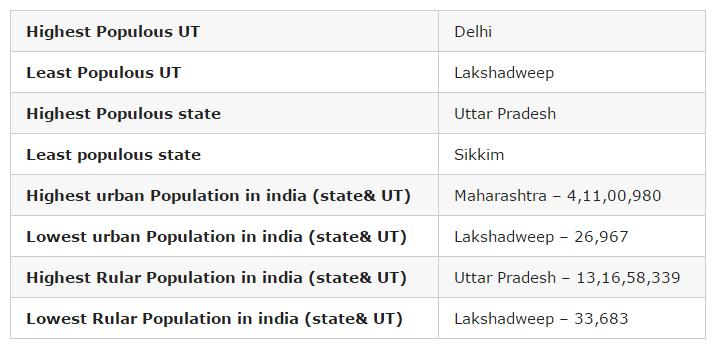
| Rural vs Urban Population | Rural: 833.5 million (more than two-thirds). Urban: 377.1 million (urban proportion increased to 31.2% from 17.3% in 1951). Highest urban population in Delhi (97.5%). |
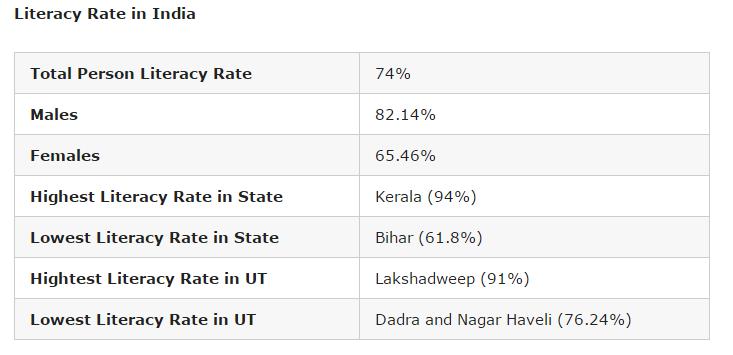
| Literacy Rate | 73% (up from 64.8% in 2001). Male literacy: 80.9%, Female literacy: 64.6%. Highest literacy rates: Kerala (94%), Lakshadweep (91.8%), Mizoram (91.3%). |
| Population Density | Increased from 325 (2001) to 382 (2011) per sq. km. Highest density: Delhi (11,320 per sq. km). Lowest: Arunachal Pradesh (17 per sq. km). |
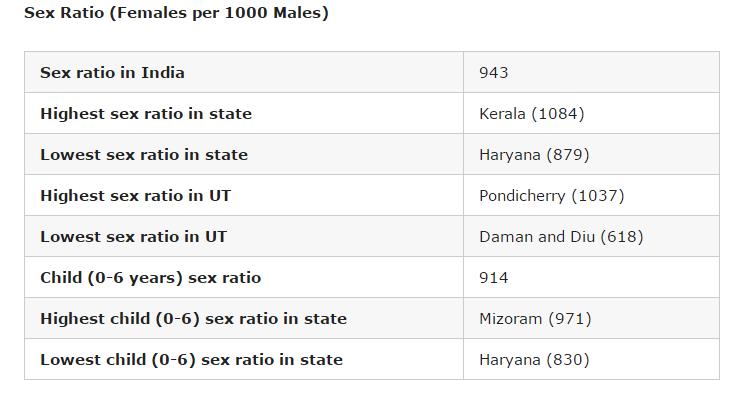
| Sex Ratio | 940 females per 1000 males (an increase from 933 in 2001). Highest: Kerala (1,084 females per 1000 males). Lowest: Haryana (879 females per 1000 males). |
| Child Population (0-6 years) | 164.5 million (0.4% increase from 2001). Child sex ratio: 919 females per 1000 males (a decline from 927 in 2001). |
| SC/ST Population | SC: 201.4 million (20% increase from 2001). ST: 104.3 million (23.7% increase from 2001). |
| Religious Demographics | Hindus: 79.8%, Muslims: 14.23%, “No Religion” category: 2.87 million (0.24%). |
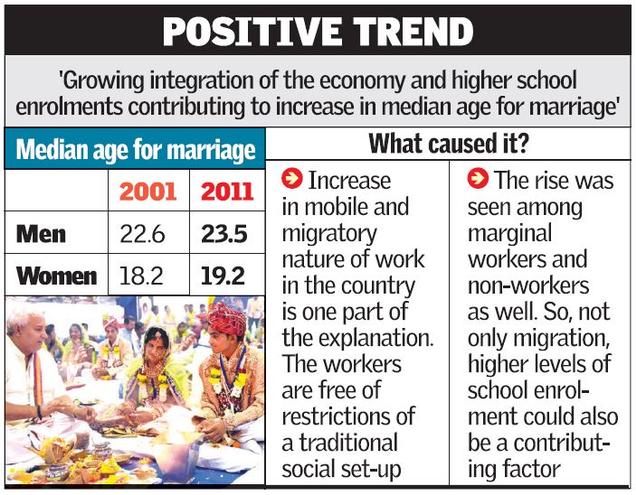
| Median Marriage Age | Men: 23.5 years (up from 22.6 in 2001). Women: 19.2 years (up from 18.2 in 2001). |
1. Population of India as per 2011 Census
- India’s total population stands at 1.21 billion, which is 17.7 per cent more than the last decade, and growth of females was higher than that of males.
- There was an increase of 90.97 million males and increase of 90.99 million females. The growth rate of females was 18.3 per cent which is higher than males — 17.1 per cent. India’s population grew by 17.7 per cent during 2001-11, against 21.5 per cent in the previous decade.
- Among the major states, highest decadal growth in population has been recorded in Bihar (25.4 per cent) while 14 states and Union Territories have recorded population growth above 20 per cent.

2. Rural and urban population as per 2011 Census Data
- Altogether, 833.5 million persons live in rural area as per Census 2011, which was more than two-third of the total population, while 377.1 million persons live in urban areas. Urban proportion has gone up from 17.3 per cent in 1951 to 31.2 per cent in 2011. Empowered Action Group (EAG) states have lower urban proportion (21.1 per cent) in comparison to non-EAG states (39.7 per cent).
- Highest proportion of urban population is in NCT Delhi (97.5 per cent). Top five states in share of urban population are Goa (62.2 per cent), Mizoram (52.1 per cent), Tamil Nadu (48.4 per cent), Kerala (47.7 per cent) and Maharashtra (45.2 per cent).
3. Literacy Rate as per Census of India 2011
- Literacy rate in India in 2011 has increased by 8 per cent to 73 per cent in comparison to 64.8 per cent in 2001.
- While male literacy rate stands at 80.9 per cent – which is 5.6 per cent more than the previous census, the female literacy rate stands at 64.6 per cent — an increase of 10.9 per cent than 2001.
- The highest increase took place in Dadra and Nagar Haveli by 18.6 points (from 57.6 per cent to 76.2 per cent), Bihar by 14.8 points (from 47.0 per cent to 61.8 per cent), Tripura by 14.0 points (from 73.2 per cent to 87.2 per cent)
- Improvement in female literacy is higher than males in all states and UTs, except Mizoram (where it is same in both males and females) during 2001-11.
- The gap between literacy rate in urban and rural areas is steadily declining in every census. Gender gap in literacy rate is steadily declining in every census. In Census 2011, the gap stands at 16.3 points.
- Top five states and UTs, where literacy rate is the highest, are Kerala (94 per cent), Lakshadweep (91.8 per cent), Mizoram (91.3 per cent), Goa (88.7 per cent) and Tripura (87.2).
- The bottom five states and UTs are Bihar (61.8 per cent), Arunachal Pradesh (65.4 per cent), Rajasthan (66.1 per cent), Jharkhand (66.4 per cent) and Andhra Pradesh (67 per cent).
4. Census 2011 Population Density Data
- The density of population in the country has also increased from 325 in 2001 to 382 in 2011 in per sq km. Among the major states, Bihar occupies the first position with a density of 1106, surpassing West Bengal which occupied the first position during 2001.
- Delhi (11,320) turns out to be the most densely inhabited followed by Chandigarh (9,258), among all states and UT’s, both in 2001 and 2011 Census. The minimum population density works out in Arunachal Pradesh (17) for both 2001 and 2011 Census.
5. India’s Sex ratio as per 2011 Census
- The sex ratio of population in the country in 2011 stands at 940 female against 1000 males, which is 10 per cent more than the last census when the number female per thousand male stood at 933. Haryana has the dubious distinction of having the worst male-female ratio among all states while Kerala fares the best.
- The number of females per 1000 males in Haryana in 2011 stands at 879 followed by Jammu and Kashmir (889 female) and Punjab (895 females).
- The other two worst-performing states in terms of skewed sex ration are Uttar Pradesh (912 females) and Bihar (918 females).
- Five top performing states in terms of sex ratio were Kerala (1,084 females), Tamil Nadu (996), Andhra Pradesh (993), Chhattisgarh (991), Odisha (979).
6. Child population in India as per Census of India 2011
- Child population in the age of 0 to 6 years has seen an increase of 0.4 per cent to 164.5 million in 2011 from 163.8 million in 2001.
- The child population (0-6) is almost stationary. In 17 states and UTs, the child population has declined in 2011 compared to 2001.
- With the declaration of sex ratio in the age group 0-6, the Census authorities tried to bring out the recent changes in the society in its attitude and outlook towards the girl child. It was also an indicator of the likely future trends of sex ratio in the population.
- There has been a decline of 8 per cent in the sex ratio of 0-6 age group. In 2011, the child sex ratio (0-6) stands at 919 female against 1000 male in comparison to 927 females in 2001.
- Male child (0-6) population has increased whereas female child population has decreased during 2001-11. Eight states, Jammu and Kashmir, Rajasthan, Uttar Pradesh, Bihar, Jharkhand, Arunachal Pradesh, Mizoram, and Meghalaya have proportion of child population more than 15 per cent.
- The worst performing states in regard to sex ration in the age group of 0 to 6 years are Haryana (834 females), Punjab (846), Jammu and Kashmir (862), Rajasthan (888) and Gujarat (890).
- The best performing states are Chhattisgarh (969), Kerala (964), Assam (962), West Bengal (956) Jharkhand (948) and Karnataka (948).
7. SC/ST data as per 2011 Census Data
- According to the Census, Scheduled Castes are notified in 31 states and UTs and Scheduled Tribes in 30 states. There are altogether 1,241 individual ethnic groups, etc. notified as SC’s in different states and UT’s.
- The number of individual ethnic groups, etc. notified as ST’s is 705. There has been some changes in the list of SC’s/ST’s in states and UT’s during the last decade.
- The SC population in India now stands at 201.4 million, which is 20 per cent more than the last census. The ST population stands at 104.3 million in 2011 – 23.7 per cent more than 2001.
8. Religious demographics as per Census of India 2011
The religious data on India Census 2011 was released by the Government of India on 25 August 2015. Hindus are 79.8% (966.3 million), while Muslims are 14.23% (172.2 million) in India. For the first time, a “No religion” category was added in the 2011 census. 2.87 million Were classified as people belonging to “No Religion” in India in the 2011 census. – 0.24% of India’s population of 1.21 billion. Given below is the decade-by-decade religious composition of India till the 2011 census. There are six religions in India that have been awarded “National Minority” status – Muslims, Christians, Sikhs, Jains, Buddhists and Parsis.

9. Median marriage age as per Census 2011
The median age increased for men – from 22.6 (2001) to 23.5 (2011) and for women – from 18.2 (2001) to 19.2 (2011)
Source
The next part of the series will cover the 2011 Socio Economic Caste Census (SECC). You must have read about it many times in the news, reading it on Civils Daily will make you clear as to what it’s actually about!
FAQs
1. What is the percentage of the child population in India according to Census 2011?
According to the Census 2011, children aged 0-6 years constituted 13.12% of India’s total population.
2. What are the important facts from Census 2011?
- Total Population: 1.21 billion.
- Male-Female Ratio: 940 females per 1000 males.
- Literacy Rate: 74.04% (Male: 82.14%, Female: 65.46%).
- Decadal Growth Rate: 17.64%.
- Child Sex Ratio: 919 females per 1000 males.
3. What is the caste-wise population distribution in India as per Census 2011?
- The caste-based population data is not published as part of Census 2011. However, estimates suggest that Scheduled Castes (SCs) and Scheduled Tribes (STs) constitute around 16.6% and 8.6% of the total population, respectively.
4. Where can I get a summary of the 2011 Census for UPSC?
Various summaries and detailed PDF documents on Census 2011 tailored for UPSC preparation are available on government and educational platforms. You can find them by searching “Census 2011 UPSC PDF” or referring to sources like Civilsdaily and NCERT resources
5. When is the latest Census of India conducted?
The latest census was planned for 2021, but it has been delayed due to the COVID-19 pandemic. The data collection is still pending as of the last update.

Comments
2 responses to “Census 2011 | The basics and summary of important findings”
Highest population growth is NOT Bihar it is MEGHALAYA
Meghalaya highest in decadal population growth.