
Inflation or price rise has been a major concern of policymakers for a long long time. Common man also lists price rise among his top most concerns. Responsibility of controlling price rise lies with government and RBI. But to control something, we need data which tells us direction in which we are moving.
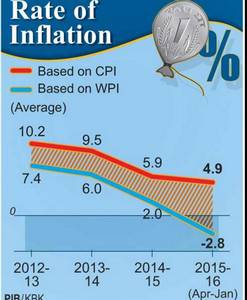
In India, that data or measure of inflation is Wholesale Price Index (WPI) and Consumer Price Index (CPI). But of late both these data sets are moving in opposite direction.
Then are the prices rising or falling? What explains the difference b/w these two indicators? Which one should be used for taking important policy decisions which affect the whole economy? And finally why is inflation such a bad thing and if it were such a bad thing, surely deflation should be great. who wouldn’t like cheap goods! But why is then Japan struggling with precisely such a thing and Eurozone doing its utmost to avoid deflation?
Let’s understand inflation
Inflation is a sustained increase in the general price level of goods and services in an economy over a period of time.
Note here the term general price level i.e. increase in price of only 1 or 2 commodities is not inflation but increase in prices of a basket of goods and services.
Let’s understand this with a one commodity economy first-
Suppose in India only apples are consumed and they cost 100 rs a kg in 2010
| Year | Commodity | Price | Quantity (Kg) | Bill | Inflation |
| 2010 | Apple | 100 | 1 | 100 | No data |
| 2011 | Apple | 110 | 1 | 110 | 110-100/100 |
| 2012 | Apple | 130 | 1 | 130 | 130-110/110 |
But suppose both apples are oranges are consumed in India and prices of oranges actually fell from 100 to 95 and then 90.
Inflation in oranges 95-100/100 would be -5%
so general inflation would be 10% + (-5%) = 5% right? If you think so, CSAT mein kamjor lagte ho. Consider this
| Year | Commodity | Price | Quantity (kg) | Bill | Inflation |
| 2010 | 1. Apple
2. Orange |
100
100 |
1
2 |
100*1 + 100*2 = 300 | No data |
| 2011 | 1. Apple
2. Oranges |
110
95 |
1
2 |
100*1 + 95*2= 300 | 300-300/300 = |
Here, we introduce the concept of weights. When calculating general inflation, we need to assign weights to different goods and services in the proportion they are consumed and then we take weighted average to compute general inflation.
The year whose consumption level is included in creation of basket of goods and services is called base year, in this case 2010. Base Year has to be frequently revised as consumption basket keeps on changing. For instance, pizza would not have been in the consumption basket about a decade back.
Base Effect
Scenario one,
| Year | Commodity | Price | inflation |
| 2010 | Apple | 100 | No data |
| 2011 | Apple | 150 | 50% |
| 2012 | Apple | 140 | 140-150/150= negative inflation |
in 2012 there is negative inflation while w.r.t to 2010, prices have risen significantly.
Scenario two
| Year | Commodity | Price | inflation |
| 2010 | Apple | 100 | No data |
| 2011 | Apple | 120 | 20% |
| 2012 | Apple | 140 | 140-120/120= 17% |
In this scenario also prices in 2010 and 2012 are same but due to excessive inflation in 2011 in earlier case, 2012 appeared to be deflationary. This anomalous situation is being created due to base effect.
What we were calculating till now was price rise in items average citizen consume. Because we are talking about consumers this is called Consumer Price Index (CPI) inflation.
Let’s know more about CPI inflation in India
Base year- 2012
Calculated by – Central Statistical Organization (CSO) in Ministry of Statistics and Programme Implementation (MoSPI) using Laspeyres formula (basically our weighted average formula)
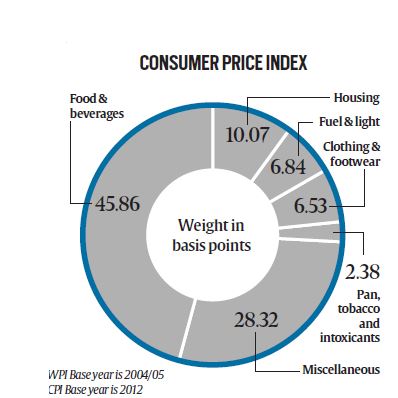
Basket:
These broad categories are further divided into subcategories but that’s not important. What is important is that about 46% weight is given to food items and any increase in food prices will lead to increase in CPI inflation.
Other point to note is that health, education etc services are also there in CPI basket. we shall later see services are not in WPI basket and thus CPI gauges services inflation as well.
But food prices are highly volatile as food products can’t be stored for long and prices depend on agriculture output. Also food is an essential good and people will buy food no matter what the food prices are, food inflation is not much affected by central bank policies. It’s a supply side issue.
Similar is the case with fuel prices which are highly volatile.
- When we remove these components from overall inflation, we get core inflation
- Core CPI =Headline CPI MINUS (food and fuel components.)
Why is overall inflation called Headline Inflation?
That is what newspaper headlines report
Because consumption basket of rural and urban areas are different, CPI inflation is calculated separately for rural and urban areas.
CPI (rural) and CPI (urban) both have same 2012 base with slightly different weightage. For instance Rural CPI doesn’t consider Housing inflation. Weightage of food items is about higher in rural areas. Weighted average of CPI(R) and CPI(U) gives overall CPI inflation.
Earlier we used to calculate 4 different categories of CPI inflation
- Agricultural Labourer (AL)
- Rural Labourer (RL)
- Industrial Workers (IW)
- Urban Non-Manual Employees (UNME)
First 3 computed by Labour bureau, as you can guess and the last one by CSO. We continue to compute these indices but focus now is on CPI (rural), CPI (Urban) and overall CPI
Why is CPI important-
It directly affects what consumers pay to buy a select basket of goods and services. It is thus better indicator of the cost of living and, hence, reflecting the welfare objective of monetary policy.
Let’s now take a look at Wholesale Price Index (WPI) inflation.
As the name suggests it computes price rise at the level of goods and services sold at wholesale level
Base Year : 2004
Calculated by Economic Adviser in the commerce ministry using same Laspeyres formula

Basket
Primary Articles include food, non food and minerals
Weightage of food items in WPI is weightage of primary food articles (cereal, pulses etc) + weightage of manufactured food items (ice cream, ghee, butter etc)
14% + 10% = 24%
- Core WPI ignore Food and Fuel (volatile components)
- Core WPI is WPI of Non-food manufacturing industries
- Core WPI = Headline WPI – (primary + fuel + food mfg. industries)
Note here that WPI does not take into account inflation in services sector such as education, health etc. while 65% of our GDP comes from services sector i.e. it does not give complete picture of price rise in the economy.
In spite of that, RBI used to focus on WPI earlier as CPI basket and base year was not frequently revised and data set was not robust but after the signing of monetary policy framework RBI has decided to focus on CPI as it directly affects consumers and thus better indicator for policy formulation.
But if RBI is to focus on CPI only, what’s the importance of WPI and why so much divergence with WPI in negative and CPI 5% in positive.
- Statistical difference –
- inclusion of services in CPI
- Different weightage to different items with food occupying highest weightage in CPI and food inflation being higher
- While reduced crude prices leading to negative WPI
2. Transaction costs – Middlemen might have increased their profit margin
3. Taxes – Indirect taxes
If same item has higher inflation in CPI than WPI, possible reason could be higher margins and govt can target that area to bring down inflation.
Other measure of inflation is GDP deflator which we understood in this article
What is Produce Price Index (PPI)
PPI is inflation at producer level without any tax component
Advantage of PPI over WPI
- Majority of the OECD countries measure inflation based on PPI (International Best Practice)
- WPI includes taxes while PPI tracks inflation minus tax component
- PPI will track average change over time in selling prices received by domestic producers for their output for both goods and services while WPI tracks transaction only at the wholesale level for goods.
Govt set up a committee headed by Professor BN Goldar to devise PPI.
Earlier two separate groups headed by Abhijit Sen and Saumitra Chaudhuri underscored the importance of PPI but felt that more work and data was needed to fully construct PPI.
Let’s understand some other terms associated with inflation
Deflation- Opposite of inflation i.e. general decline in prices. it is generally associated with contracting economy i.e. recession and is much more dangerous than inflation.
Disinflation-Slow down in the rate of inflation i.e. prices are still rising but as the lower pace. Eg. If inflation rate was 10%, 2 years back, 8% last year and, 6% this year, economy is said to be in disinflation.
Hyperinflation– Very high and accelerating inflation which cause people to severely curtail their use of the currency as currency simply becomes worthless. For instance in Germany after 1st world war or in Zimbabwe a few years back. Prices rise 10% or more month on month.


Stagflation-
stagnation plus inflation i.e. inflation in a stagnating economy. Generally inflation is associated with a booming, high growth economy but when economy is contracting, growth rates are coming down, unemployment is rising and there is high inflation , it is called stagflation.
What are the causes of inflation?
Essentially there is more amount of money to buy limited amount of goods and services leading to rise in prices (demand supply mismatch). It could be due to following reasons-
- Demand pull inflation – increases in aggregate demand due to increased private and government spending. Thus high fiscal deficits, high subsidies lead to demand pull inflation.
- Cost push inflation– also called “supply shock inflation,” is caused by a drop in aggregate supply. This may be due to natural disasters, or increased prices of inputs. For example, a sudden decrease in the supply of oil, leading to increased oil prices, can cause cost-push inflation. Producers for whom oil is a part of their costs could then pass this on to consumers in the form of increased prices. Another example could be inflation due to high administered prices due to high MSP.
Monetary policy can mainly control demand pull inflation by raising interest rates, tightening liquidity thus reducing amount of money available. Supply side inflation is difficult to control by monetary authorities and in case of India main cause of inflation is high food prices which is a supply side issue due to rigidities in agriculture markets. Then why does RBI raise interest rate when inflation is due to supply side issues such as high food prices?
Here comes the role of 3rd factor-
3. Built in inflation is induced by adaptive expectations, and is often linked to the price-wage spiral. Essentially workers try to keep their wages up with prices (above the rate of inflation), and firms pass these higher labor costs on to their customers as higher prices, leading to a ‘vicious circle’.

RBI raises rates to break this vicious circle.
For this very reason, RBI conducts survey of inflationary expectations and latest surveys suggest in spite of inflation being down to 5%, expectations are of double digit inflation due to very high inflation for a prolonged period.
Let’s now understand effects of inflation
General Effects –
- As same amount of money buys less goods, purchasing power of currency comes down, currency depreciates in international exchange rate market. How? Learn here
- It benefit borrowers or debtors as in real terms they have to repay less amount in real terms while it hurts creditors or savers.
| Year | Borrowed/ lent | Inflation | Apple price | Real amount Borrowed/ returned |
| 2010 | 1000 | No data | 100 | 10 kg |
| 2011 | 1000 | 10% | 110 | 9 .1 kg |
You can clearly see, borrower/ debtor has to return less in real term, thus advantage debtor/and disadvantage creditor / bond holder.
Negative effect-
- Uncertainty about future rate of inflation makes it difficult to conclude business deals, affects investment.
- Savers tend to park their money in fixed assets, financial savings fall. One of the reason for gold rush in India was high inflation.
- Hurts poor the most as they are not able to bargain for higher wages to keep up with the rising prices
- Hoarding– to take advantage of higher prices in future, this furthers inflation and vicious cycle starts. Recall the case of pulse hoarders when pulse prices were shooting up.
- Finally there is always that risk of inflation going out of control resulting in hyperinflationary situation which can cripple the whole economy
Positives
1.Most important positive is that it avoids deflationary tendencies which is the worst
Effects of deflation
- As we saw above, it harms borrowers resulting in inability to repay loans. Companies and banks collapse
- While in inflation people start hoarding, here people postpone their purchases in the expectation of future fall in prices. If nobody buys, demand goes down and economy goes under recession resulting in job losses and high unemployment
- Labour-market adjustments- Nominal wages are slow to adjust downwards. Since inflation allows real wages to fall even if nominal wages are kept constant, moderate inflation enables labor markets to reach equilibrium faster.
Consider this, real salary has decreased but person would feel he had been awarded 8% pay hike.
| Year | Nominal salary | Inflation | Apple price | Real salary in apples |
| 2010 | 1000 | No data | 100 | 10 kg |
| 2011 | 1080 | 20% | 120 | 9 kg |
But if there were no inflation, he would have resisted wage decline, though it would have been same, worth 9 kg apples.
| Year | Nominal salary | Inflation | Apple price | Real salary in apples |
| 2010 | 1000 | No data | 100 | 10 kg |
| 2011 | 900 | 0 | 100 | 9 kg |
In emerging economies such as India, structure of economy changes rapidly and thus more frequent churning and adjustment in labour market is required. It is for this reason that inflation level of 4-6% is considered healthy in emerging economies while most advanced economies don’t like inflation beyond 2%.
Inflation especially demand pull inflation is associated with high growth and low unemployment. As demand rises, industries increase their production leading to higher growth and employment. This holds true only for short term.
A few more terms before we wind up our discussion –
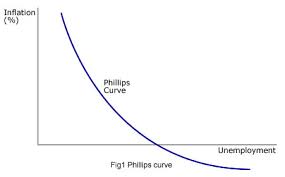
Phillips curve is a historical inverse relationship between rates of unemployment and corresponding rates of inflation.
Misery index – the sum of the inflation and unemployment rates
Modified misery index – sum of the interest, inflation, and unemployment rates, minus the year-over-year percent change in per-capita GDP growth
In the next article we shall discuss tools available with government and RBI to control inflation and why monetary policy transmission is very poor in India.
Now it’s time to solve a few questions asked in previous years IAS prelims-
#1. Which of the following brings out the ‘Consumer Price Index Number for Industrial Workers? (IAS pre 2015)
- (a) The Reserve Bank of India
- (b) The Department of Economic Affairs
- (c) The Labour Bureau
- (d) The Department of Personnel and Training
#2. A rise in general level of prices may be caused by
- an increase in the money supply
- a decrease in the aggregate level of output
- an increase in the effective demand
Select the correct answer using the codes given below.
- 1 only
- 1 and 2 only
- 2 and 3 only
- 1, 2 and 3
#3. Consider the following statements: (IAS Pre 2014)
- Inflation benefits the debtors.
- Inflation benefits the bond-holders.
Which of the statements given above is/are correct?
- 1 only
- 2 only
- Both 1 and 2
- Neither 1 nor 2
#4. India has experienced persistent and high food inflation in the recent past. What could be the reasons?(2011)
- Due to a gradual switchover to the cultivation of commercial crops, the area under the cultivation of food grains has steadily decreased in the last five years by about 30%.
- As a consequence of increasing incomes, the consumption patterns of the% people have undergone a significant change.
- The food supply chain has structural constraints.
Which of the statements given above are correct?
- (a.) 1 and 2 only
- (b.) 2 and 3 only
- (c.) 1 and 3 only
- (d.) 1, 2 and 3
#5. A rapid increase in the rate of inflation is sometimes attributed to the “base effect”. What is “base effect”?(2011)
- (a.) It is the impact of drastic deficiency in supply due to failure of crops
- (b.) It is the impact of the surge in demand due to rapid economic growth
- (c.) It is the impact of the price levels of previous year on the calculation of inflation rate
- (d.)None of the statements (a), (b) and (c) ‘given above is correct in this context
#6. Economic growth is usually coupled with (2011)
- (a.) Deflation
- (b.) Inflation
- (c.) Stagflation
- (d.) Hyperinflation

Comments
One response to “Economics | Inflation explained with real life examples”
1 – c
2 – d
3- a
4 -b
5 – c
6 – b