💥Join UPSC 2027,2028 Mentorship (July Batch) + XFactor Notes & Microthemes PDF

GS Paper: GS1-14.Important Geophysical phenomena such as earthquakes, Tsunami, Volcanic activity, cyclone etc.,

  • Northern European Enclosure Dam (NEED)


    An extraordinary measure to protect 25 million people and important economic regions of 15 Northern European countries from rising seas has been proposed. It is called Northern European Enclosure Dam (NEED) enclosing all of the North Sea.

    Northern European Enclosure Dam (NEED)

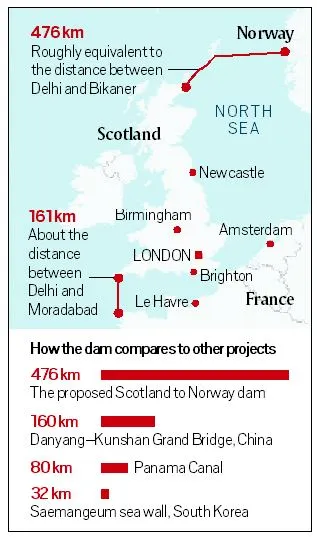
    • The scientists have proposed the construction of two dams of a combined length of 637 km — the first between northern Scotland and western Norway.
    • It would be 476 km and with an average depth of 121 m and maximum depth of 321 m; the second between France and southwestern England, of length 161 km, and average depth of 85 m and maximum depth of 102 m.
    • A/c to scientists, separating the North and Baltic Seas from the Atlantic Ocean is considered to be the “most viable option” to protect Northern Europe against unstoppable sea level rise (SLR).
    • They have also identified other regions in the world where such mega-enclosures could potentially be considered, including the Persian Gulf, the Mediterranean Sea, the Baltic Sea, the Irish Sea, and the Red Sea.

    The rationale behind

    • The concept of constructing NEED showcases the extent of protection efforts that are required if mitigation efforts fail to limit sea level rise.
    • While NEED may appear to be “overwhelming” and “unrealistic”, it could be “potentially favourable” financially and in scale when compared with alternative solutions to fight SLR, the research argues.
    • The researchers classify the solutions to SLR into three categories of taking no action, protection, and managed retreat — and submit that NEED is in the second category.
    • While managed retreat, which includes options such as managed migrations, may be less expensive than protection (NEED), it involves intangible costs such as national and international political instability, psychological difficulties, and loss of culture and heritage for migrants.
    • NEED, the paper says, will have the least direct impact on people’s daily lives, can be built at a “reasonable cost”, and has the largest potential to be implemented with the required urgency to be effective.

    Viability of NEED

    • The researchers have estimated the total costs associated with NEED at between €250 billion and €550 billion.
    • They referred to the costs of building the 33.9-km Saemangeum Seawall in South Korea and the Maasvlakte 2 extension of the Rotterdam harbour in the Netherlands as examples,
    • If construction is spread over a 20-year period, this will work out to an annual expense of around 0.07%-0.16% of the GDP of the 15 Northern European countries that will be involved.
    • Also the construction will “heavily impact” marine and terrestrial ecosystems inside and outside the enclosure, will have social and cultural implications, and affect tourism and fisheries.
  • Urban Heat Islands in India


    A recent study from IIT Kharagpur called “Anthropogenic forcing exacerbating the urban heat islands in India” noted that the relatively warmer temperature in urban areas, compared to suburbs, may contain potential health hazards due to heat waves apart from pollution.

    About the study

    • The research did study the difference between urban and surrounding rural land surface temperatures, across all seasons in 44 major cities from 2001 to 2017.
    • It found evidence of mean daytime temperature of surface urban heat island (UHI Intensity) going up to 2 degrees C for most cities, as analysed from satellite temperature measurements in monsoon and post monsoon periods.
    • Other researchers from elsewhere have also noticed similar rise in daytime temperatures in Delhi, Mumbai, Bengaluru, Hyderabad and Chennai.

    What is an Urban Heat Island?

    • An urban heat island (abbreviated as UHI) is where the temperature in a densely populated city is as much as 2 degrees higher than suburban or rural areas.
    • This happens because of the materials used for pavements, roads and roofs, such as concrete, asphalt (tar) and bricks, which are opaque, do not transmit light, but have higher heat capacity and thermal conductivity than rural areas, which have more open space, trees and grass.
    • Trees and plants are characterised by their ‘evapotranspiration’— a combination of words wherein evaporation involves the movement of water to the surrounding air, and transpiration refers to the movement of water within a plant and a subsequent lot of water through the stomata (pores found on the leaf surface) in its leaves.
    • Grass, plants and trees in the suburbs and rural areas do this. The lack of such evapotranspiration in the city leads to the city experiencing higher temperature than its surroundings.

    Latent impacts

    • UHI s also decrease air quality in the cities, thanks to pollution generated by industrial and automobile exhaust, higher extent of particulate matter and greater amounts of dust than in rural areas.
    • Due to this higher temperature in urban areas, the UHI increases the colonization of species that like warm temperatures, such as lizards and geckos.
    • Insects such as ants are more abundant here than in rural areas; these are referred to as ectotherms.
    • In addition, cities tend to experience heat waves which affect human and animal health, leading to heat cramps, sleep deprivation and increased mortality rates.
    • UHIs also impact nearby water bodies, as warmer water (thanks to the pavements, rooftops and so on) is transferred from the city to drains in sewers, and released into nearby lakes and creeks, thus impairing their water quality.

    Control of UHIs and mitigation

    • Industrialization and economic development are vital to the country, but the control of UHIs and their fallouts are equally vital. Towards this, several methods are being, and can be, tried.
    • One of them is to use greener rooftops, using light-coloured concrete (using limestone aggregates along with asphalt (or tar) making the road surface greyish or even pinkish (as some places in the US have done); these are 50% better than black, since they absorb less heat and reflect more sunlight.
    • Likewise, we should paint rooftops green, and install solar panels there amidst a green background.
    • The other is to plant as many trees and plants as possible

    Why plant more trees?

    Relevant to the present context are:

    • they combat climate change; clean the surrounding air by absorbing pollutant gases (NXOy, O3, NH3, SO2, and others) and trapping particulates on their leaves and bark;
    • they cool the city and the streets; conserve energy (cutting air-conditioning costs by 50%); save water and help prevent water pollution; help prevent soil erosion; protect people and children from UV light;
    • they offer economic opportunities; bring diverse group of people together; encourage civic pride by giving neighborhoods a new identity; mask concrete walls, thus muffling sounds from streets and highways, and eye-soothing canopy of green; and the more a business district has trees, more business follows.
  • ‘Future of Earth, 2020’ Report


    The “The Future of Earth, 2020” Report was recently released.

    About the report

    • The report is released by the South Asia Future Earth Regional Office, Divecha Centre for Climate Change, Indian Institute of Science.
    • The report was prepared with the aim of reducing carbon footprint and halting global warming below 2 degree Celsius by 2050.

    Highlights of the report

    • Five global risks that have the potential to impact and amplify one another in ways that may cascade to create global systemic crisis have been listed by report.
    • It listed the following as five global risks:
    1. failure of climate change mitigation and adaptation
    2. extreme weather events
    3. major biodiversity loss and ecosystem collapse
    4. food crises; and
    5. water crises
    • Offering examples of how the interrelation of risk factors play a role, scientists say extreme heatwaves can accelerate global warming by releasing large amounts of stored carbon from affected ecosystems, and at the same time intensify water crises and/ or food scarcity.
    • The loss of biodiversity also weakens the capacity of natural and agricultural systems to cope with climate extremes, increasing our vulnerability to food crises, they point out.
  • Thwaites Glacier


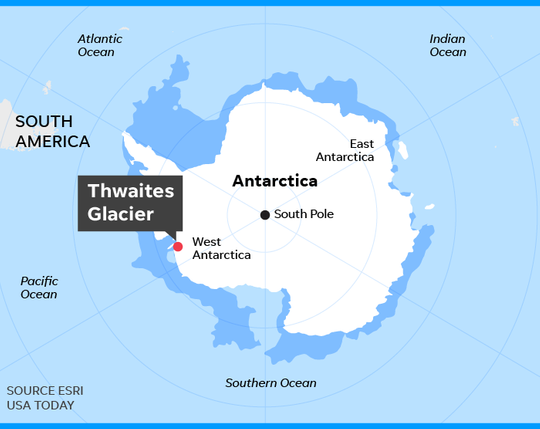
    In the Antarctic floats a massive glacier, roughly the size of Britain, whose melting has been a cause of alarm for scientists over the years. Now, a new study has pinned the cause of the melting to the presence of warm water at a vital point beneath the glacier.

    Thwaites Glacier

    • The Thwaites Glacier is 120 km wide at its broadest, fast-moving and melting fast over the years.
    • Because of its size (1.9 lakh square km), it contains enough water to raise the world sea level by more than half a metre.
    • Studies have found the amount of ice flowing out of it has nearly doubled over the past 30 years. Today, Thwaites’s melting already contributes 4% to global sea level rise each year.
    • It is estimated that it would collapse into the sea in 200-900 years. Thwaites is important for Antarctica as it slows the ice behind it from freely flowing into the ocean.
    • Because of the risk it faces — and poses — Thwaites is often called the Doomsday Glacier.

    What has the new study found?

    • A 2019 study had discovered a fast-growing cavity in the glacier.
    • More recently researchers detected warm water at a vital point below the glacier.
    • Scientists dug a 600-m-deep and 35-cm-wide access hole, and deployed an ocean-sensing device called Icefin to measure the waters moving below the glacier’s surface.
    • The study reported water at just two degrees above freezing point at Thwaites’s “grounding zone” or “grounding line”.

    What is the grounding line?

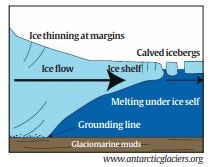
    • The grounding line is the place below a glacier at which the ice transitions between resting fully on bedrock and floating on the ocean as an ice shelf.
    • The location of the line is a pointer to the rate of retreat of a glacier.
    • When glaciers melt and lose weight, they float off the land where they used to be situated. When this happens, the grounding line retreats.
    • That exposes more of a glacier’s underside to seawater, increasing the likelihood it will melt faster.
    • This resulted in the glacier speeding up, stretching out, and thinning, causing the grounding line to retreat ever further.
  • Thawing of Permafrost


    A recent study makes a disturbing connection between the loss of Arctic sea ice and thawing (melting) of permafrost in the region, with global implications.

    What is Permafrost?

    • ‘Permafrost’ or permanently frozen ground is land that has been frozen at or below 0 degrees Celsius for two or more consecutive years.
    • A staggering 17 per cent of Earth’s entire exposed land surface is comprised of permafrost.
    • Composed of rock, sediments, dead plant and animal matter, soil, and varying degrees of ice, permafrost is mainly found near the poles, covering parts of Greenland, Alaska, Northern Canada, Siberia and Scandinavia.
    • The Arctic region is a vast ocean, covered by thick ice on the surface (called sea ice), surrounded by land masses that are also covered with snow and ice.

    Permafrost thawing

    • When permafrost thaws, water from the melted ice makes its way to the caves along with ground sediments, and deposits on the rocks.
    • In other words, when permafrost thaws, the rocks grow and when permafrost is stable and frozen, they do not grow.

    Why thawing?

    • The link between the Siberian permafrost and Arctic sea ice can be explained by two factors:
    • One is heat transport from the open Arctic Ocean into Siberia, making the Siberian climate warmer.
    • The second is moisture transport from open seawater into Siberia, leading to thicker snow cover that insulates the ground from cold winter air, contributing to its warming.
    • This is drastically different from the situation just a couple of decades ago when the sea ice acted as a protective layer, maintaining cold temperatures in the region and shielding the permafrost from the moisture from the ocean.
    • If sea ice (in the summer) is gone, permafrost start thawing.

    Impact on Climate Change

    • Due to relentlessly rising temperatures in the region, since the late-twentieth century, the Arctic sea ice and surrounding land ice are melting at accelerating rates.
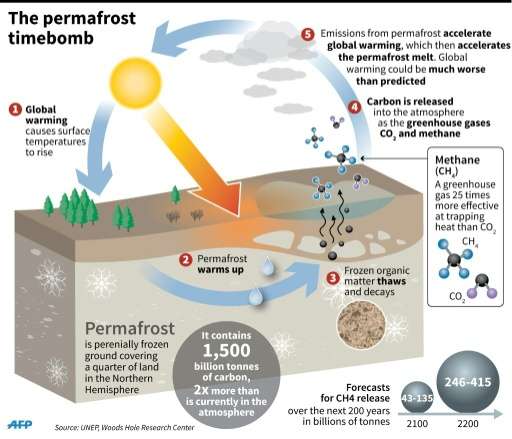
    • When permafrost thaws due to rising temperatures, the microbes in the soil decompose the dead organic matter (plants and animals) to produce methane (CH4) and carbon dioxide (CO2), both potent greenhouse gases.
    • CH4 is at least 80 times more powerful than CO2 on a decadal timescale and around 25 times more powerful on a century timescale.
    • The greenhouse gases produced from thawing permafrost will further increase temperatures which will, in turn, lead to more permafrost thawing, forming an unstoppable and irreversible self-reinforcing feedback loop.
    • Experts believe this process may have already begun. Giant craters and ponds of water (called ‘thermokarst lakes’) formed due to thawing have been recorded in the Arctic region. Some are so big that they can be seen from space.

    Why a matter of concern?

    • An estimated 1,700 billion tonnes — twice the amount currently present in the atmosphere — of carbon is locked in all of the world’s permafrost.
    • Even if half of that were to be released to the atmosphere, it would be game over for the climate.
    • Scientific estimates suggest that the Arctic Ocean could be largely sea ice-free in the summer months by as early as 2030, based on observational trends, or as late as 2050, based on climate model projections.
  • Blaze down under

    Context

    In Australia, forest fires, among the worst in the country’s history, have been raging since September and show no signs of abating.

     Unabated fire in Australia

    • The fire, worst in Australia’s history, has been raging since September and shows no signs of abating.
    • At least 24 people lost their lives, 500 million animal have perished, and more than 12bn acres of land has turned to cinders.
    • New South Wales, the country’s worst-affected state, declared an emergency last week in its southeastern region.

    Climate change and the fire

    • Australians have vented their anger at Prime Minister for playing down the blaze’s association with climate change.
    • Bushfires are actually a part of Australia’s ecosystem. Many plants depend on them to cycle nutrients and clear vegetation.
    • Eucalyptus trees in Australia depend on fire to release their seeds.
    • The prolonged blaze this year has coincided with Australia’s harshest summer.
    • Parts of the country recorded their highest recorded temperature in December.
    • Much of Australia is facing a drought that is a result of three consecutive summers with very little precipitation.
    • This, according to climate scientists, is unprecedented.
    • Australian Bureau of Meteorology’s 2018 State of the Climate report had given a hint of the change.
    • It said “Australia’s climate has warmed by just over 1 degree Celsius since 1910, leading to an increase in the frequency of extreme heat events.’’
    • This has led to more rainfall in northern Australia but created drought-like conditions in the more densely populated southeast.

    Damage caused to the flora and fauna of Australia

    • Australia is home to nearly 250 animal species.
    • Some of them like the koalas and kangaroos are not found elsewhere.
    • The region also has the highest rate of native animals going extinct over the past 200 years.
    • Experts, for example, reckon that more than a quarter of the koala habitat has been consumed by the blaze.
    • The fires have also caused a drop in the bird, rodent and insect populations.

    Conclusion

    • These creatures perished are the building blocks of the ecosystem and the fall in their population is bound to have long-term impacts. In Australia’s bushfires lies a warning about the complex ways in which climate variables interact.
  • Smog Tower

    Recently New Delhi got its first smog tower (a prototype air purifier). In November, the Supreme Court had directed the Centre and the Delhi government to prepare a plan to install ‘smog towers’ across the capital to deal with air pollution.

    What is a ‘Smog Tower’?

    • Smog towers are structures designed to work as large-scale air purifiers.
    • They are usually fitted with multiple layers of air filters, which clean the air of pollutants as it passes through them.
    • The smog tower installed at Lajpat Nagar is capable of treating 6,00,000 cubic metres of air per day and can collect more than 75 per cent of particulate matters (PM) 2.5 and 10.
    • After the cleaning, the tower releases clean air.
    • The project is collaboration between the IIT Bombay, IIT-Delhi and the University of Minnesota, the latter having helped design a similar tower of over 100 metres in China’s Xi’an city.
    • The Central Pollution Control Board (CPCB) will also be involved with the project.

    How it works?

    • The 20-metre (65 feet) high tower will trap particulate matter of all sizes suspended in the air.
    • Large-scale air filters shall draw in the air through fans installed at the top before passing it through the filters and releasing it near the ground.
    • The filters installed in the tower will use carbon nanofibres as a major component and will be fitted along its peripheries. The tower will focus on reducing particulate matter load.

    Other examples in the world

    • China, which has been battling air pollution for years, has two smog towers — in its capital Beijing and in the northern city of Xi’an.
    • The Xi’an tower is dubbed the world’s largest, and has reportedly brought down PM 2.5 by 19% in an area of around 6 sq km in its vicinity.
    • The 100-metre (328 feet) high tower has produced 10 million cubic metres of clean air every day since its launch.
    • On severely polluted days the tower is able to bring down smog close to moderate levels.
  • Carbon Stock in Indian forests

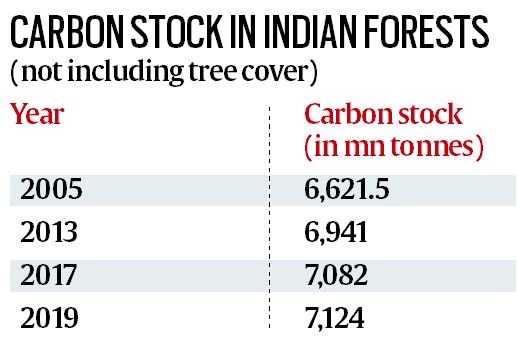
    • The State of Forest Report (SFR) 2019 has shown an increase in the carbon stock trapped in Indian forests in the last two years.
    • However it shows why it is going to be an uphill task for India in meeting one of its international obligations on climate change.

    India’s carbon commitment

    • India, as part of its contribution to the global fight against climate change, has committed itself to creating an “additional carbon sink of 2.5 to 3 billion tonnes of carbon dioxide equivalent” by 2030.
    • That is one of the three targets India has set for itself in its climate action plan, called Nationally Determined Contributions, or NDCs, that every country has to submit under the 2015 Paris Agreement.
    • The other two relate to an improvement in emissions intensity and an increase in renewable energy deployment.
    • India has said it would reduce its emissions intensity (emissions per unit of GDP) by 33% to 35% by 2030 compared to 2005.
    • It has also promised to ensure that at least 40% of its cumulative electricity generation in 2030 would be done through renewable energy.

    What is the relationship between forests and carbon?

    • Forests, by absorbing carbon dioxide from the atmosphere for the process of photosynthesis, act as a natural sink of carbon.
    • Together with oceans, forests absorb nearly half of global annual carbon dioxide emissions.
    • In fact, the carbon currently stored in the forests exceeds all the carbon emitted in the atmosphere since the start of the industrial age.
    • An increase in the forest area is thus one of the most effective ways of reducing the emissions that accumulate in the atmosphere every year.

    How do the latest forest data translate into carbon equivalent?

    • The latest forest survey shows that the carbon stock in India’s forests (not including tree cover outside of forest areas) have increased from 7.08 billion tonnes in 2017.
    • This translates into 26.14 billion tonnes of carbon dioxide equivalent as of now.
    • It is estimated that India’s tree cover outside of forests would contribute another couple of billion of tonnes of carbon dioxide equivalent.

    How challenging does this make it for India in meeting its target?

    • An assessment by the Forest Survey of India (FSI) last year had projected that, by 2030, the carbon stock in forests as well as tree cover was likely to reach 31.87 billion tonnes of CO2 equivalent.
    • An additional 2.5 to 3 billion tonnes of sink, as India has promised to do, would mean taking the size of the sink close to 35 billion tonnes of CO2 equivalent.
    • Considering the rate of growth of the carbon sink in the last few years, that is quite a stiff target India has set for itself.
    • In the last two years, the carbon sink has grown by just about 0.6%%. Even compared to 2005, the size of carbon sink has increased by barely 7.5%.
    • To meet its NDC target, even with most optimistic estimates of carbon stock trapped in trees outside of forest areas, the sink has to grow by at least 15% to 20% over the next ten-year period.

    Way Forward

    • There are two key decisions to be made in this regard — selection of the baseline year, and addition of the contribution of the agriculture sector to carbon sink.
    • When India announced its NDC in 2015, it did not mention the baseline year.
    • India’s emissions intensity target uses a 2005 baseline, so there is an argument that the forest target should also have the same baseline.
    • But there is a strong demand for a 2015 baseline as well, so that it results in some concrete progress in adding new forest cover.
    • The NDC specifically mentions that and “additional” 2.5 to 3 billion tonnes of carbon sink would be created through additional forest and tree cover by 2030 MoEFCC insist that tree cover outside forest areas must include agriculture as well.
    • India would also have to specify whether it wants to count the carbon sink in the agriculture sector in its target.